Downloaded 21 times

![8
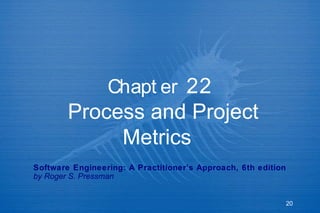
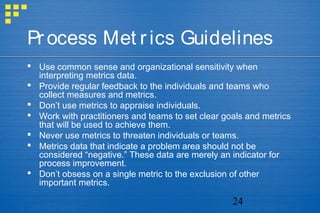
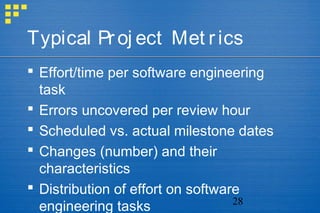
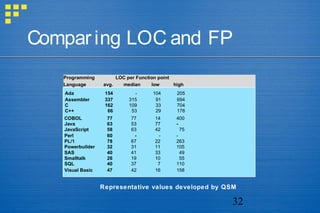
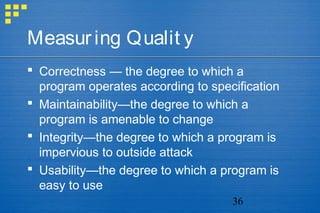
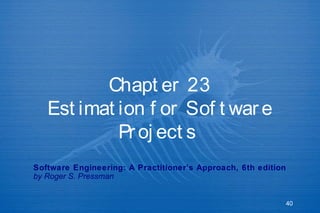
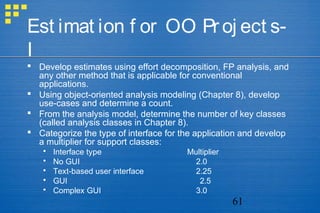
Organizat ional Paradigms
Closed paradigm—structures a team along a traditional
hierarchy of authority
Random paradigm—structures a team loosely and depends on
individual initiative of the team members
Open paradigm—attempts to structure a team in a manner that
achieves some of the controls associated with the closed
paradigm but also much of the innovation that occurs when
using the random paradigm
Synchronous paradigm—relies on the natural
compartmentalization of a problem and organizes team
members to work on pieces of the problem with little active
communication among themselves
suggested by Constantine [CON93]](https://image.slidesharecdn.com/managingsoftwareproject-150405102919-conversion-gate01/85/Managing-Software-Project-8-320.jpg)
![16
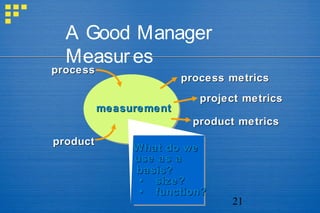
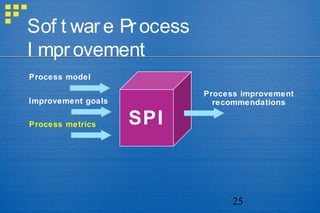
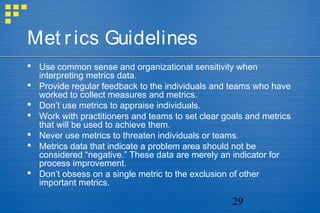
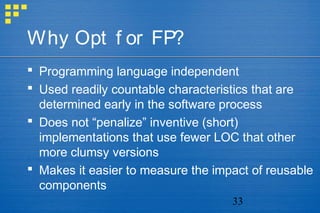
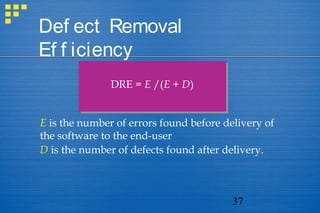
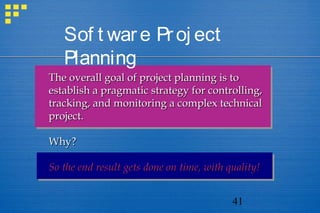
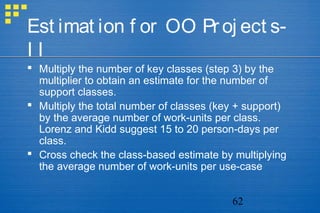
The Proj ect
Projects get into trouble when …
Software people don’t understand their customer’s needs.
The product scope is poorly defined.
Changes are managed poorly.
The chosen technology changes.
Business needs change [or are ill-defined].
Deadlines are unrealistic.
Users are resistant.
Sponsorship is lost [or was never properly obtained].
The project team lacks people with appropriate skills.
Managers [and practitioners] avoid best practices and lessons
learned.](https://image.slidesharecdn.com/managingsoftwareproject-150405102919-conversion-gate01/85/Managing-Software-Project-16-320.jpg)
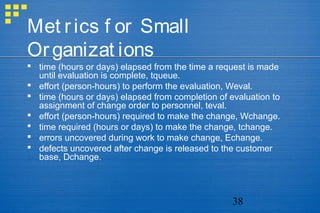
![60
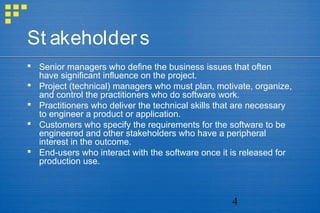
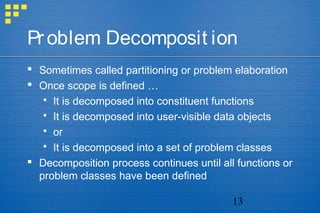
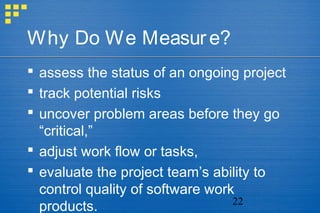
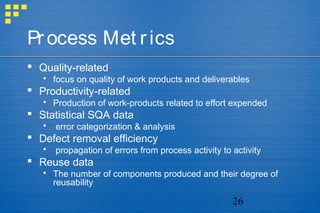
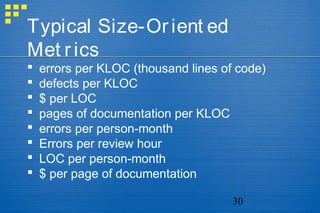
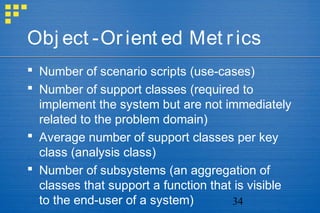
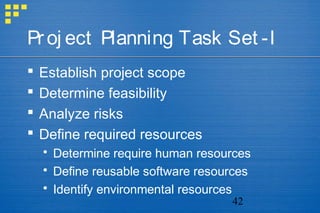
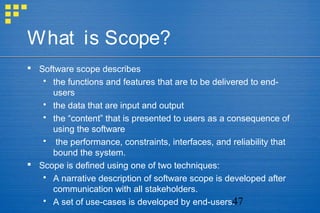
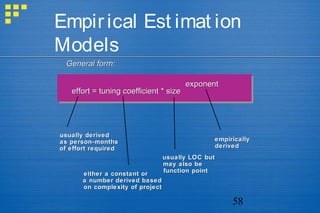
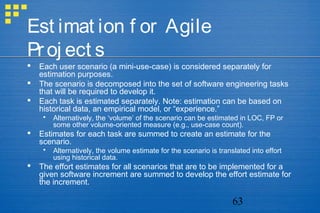
The Sof t ware Equat ion
A dynamic multivariable modelA dynamic multivariable model
E = [LOC x BE = [LOC x B0.3330.333
/P]/P]33
x (1/tx (1/t44
))
wherewhere
E = effort in person-months or person-yearsE = effort in person-months or person-years
t = project duration in months or yearst = project duration in months or years
B = “special skills factor”B = “special skills factor”
P = “productivity parameter”P = “productivity parameter”](https://image.slidesharecdn.com/managingsoftwareproject-150405102919-conversion-gate01/85/Managing-Software-Project-60-320.jpg)

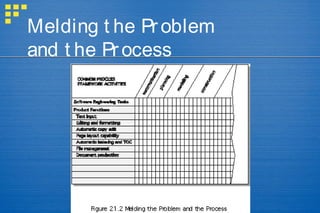
This document discusses key concepts in project management for software engineering projects. It covers the four Ps of project management - people, product, process, and project. It describes stakeholders and considerations for organizing software teams. Factors for selecting a team structure and paradigms are outlined. The document also discusses defining the product scope, decomposing problems, and melding the problem and process. It provides guidelines for a common-sense approach to managing projects.