Downloaded 260 times
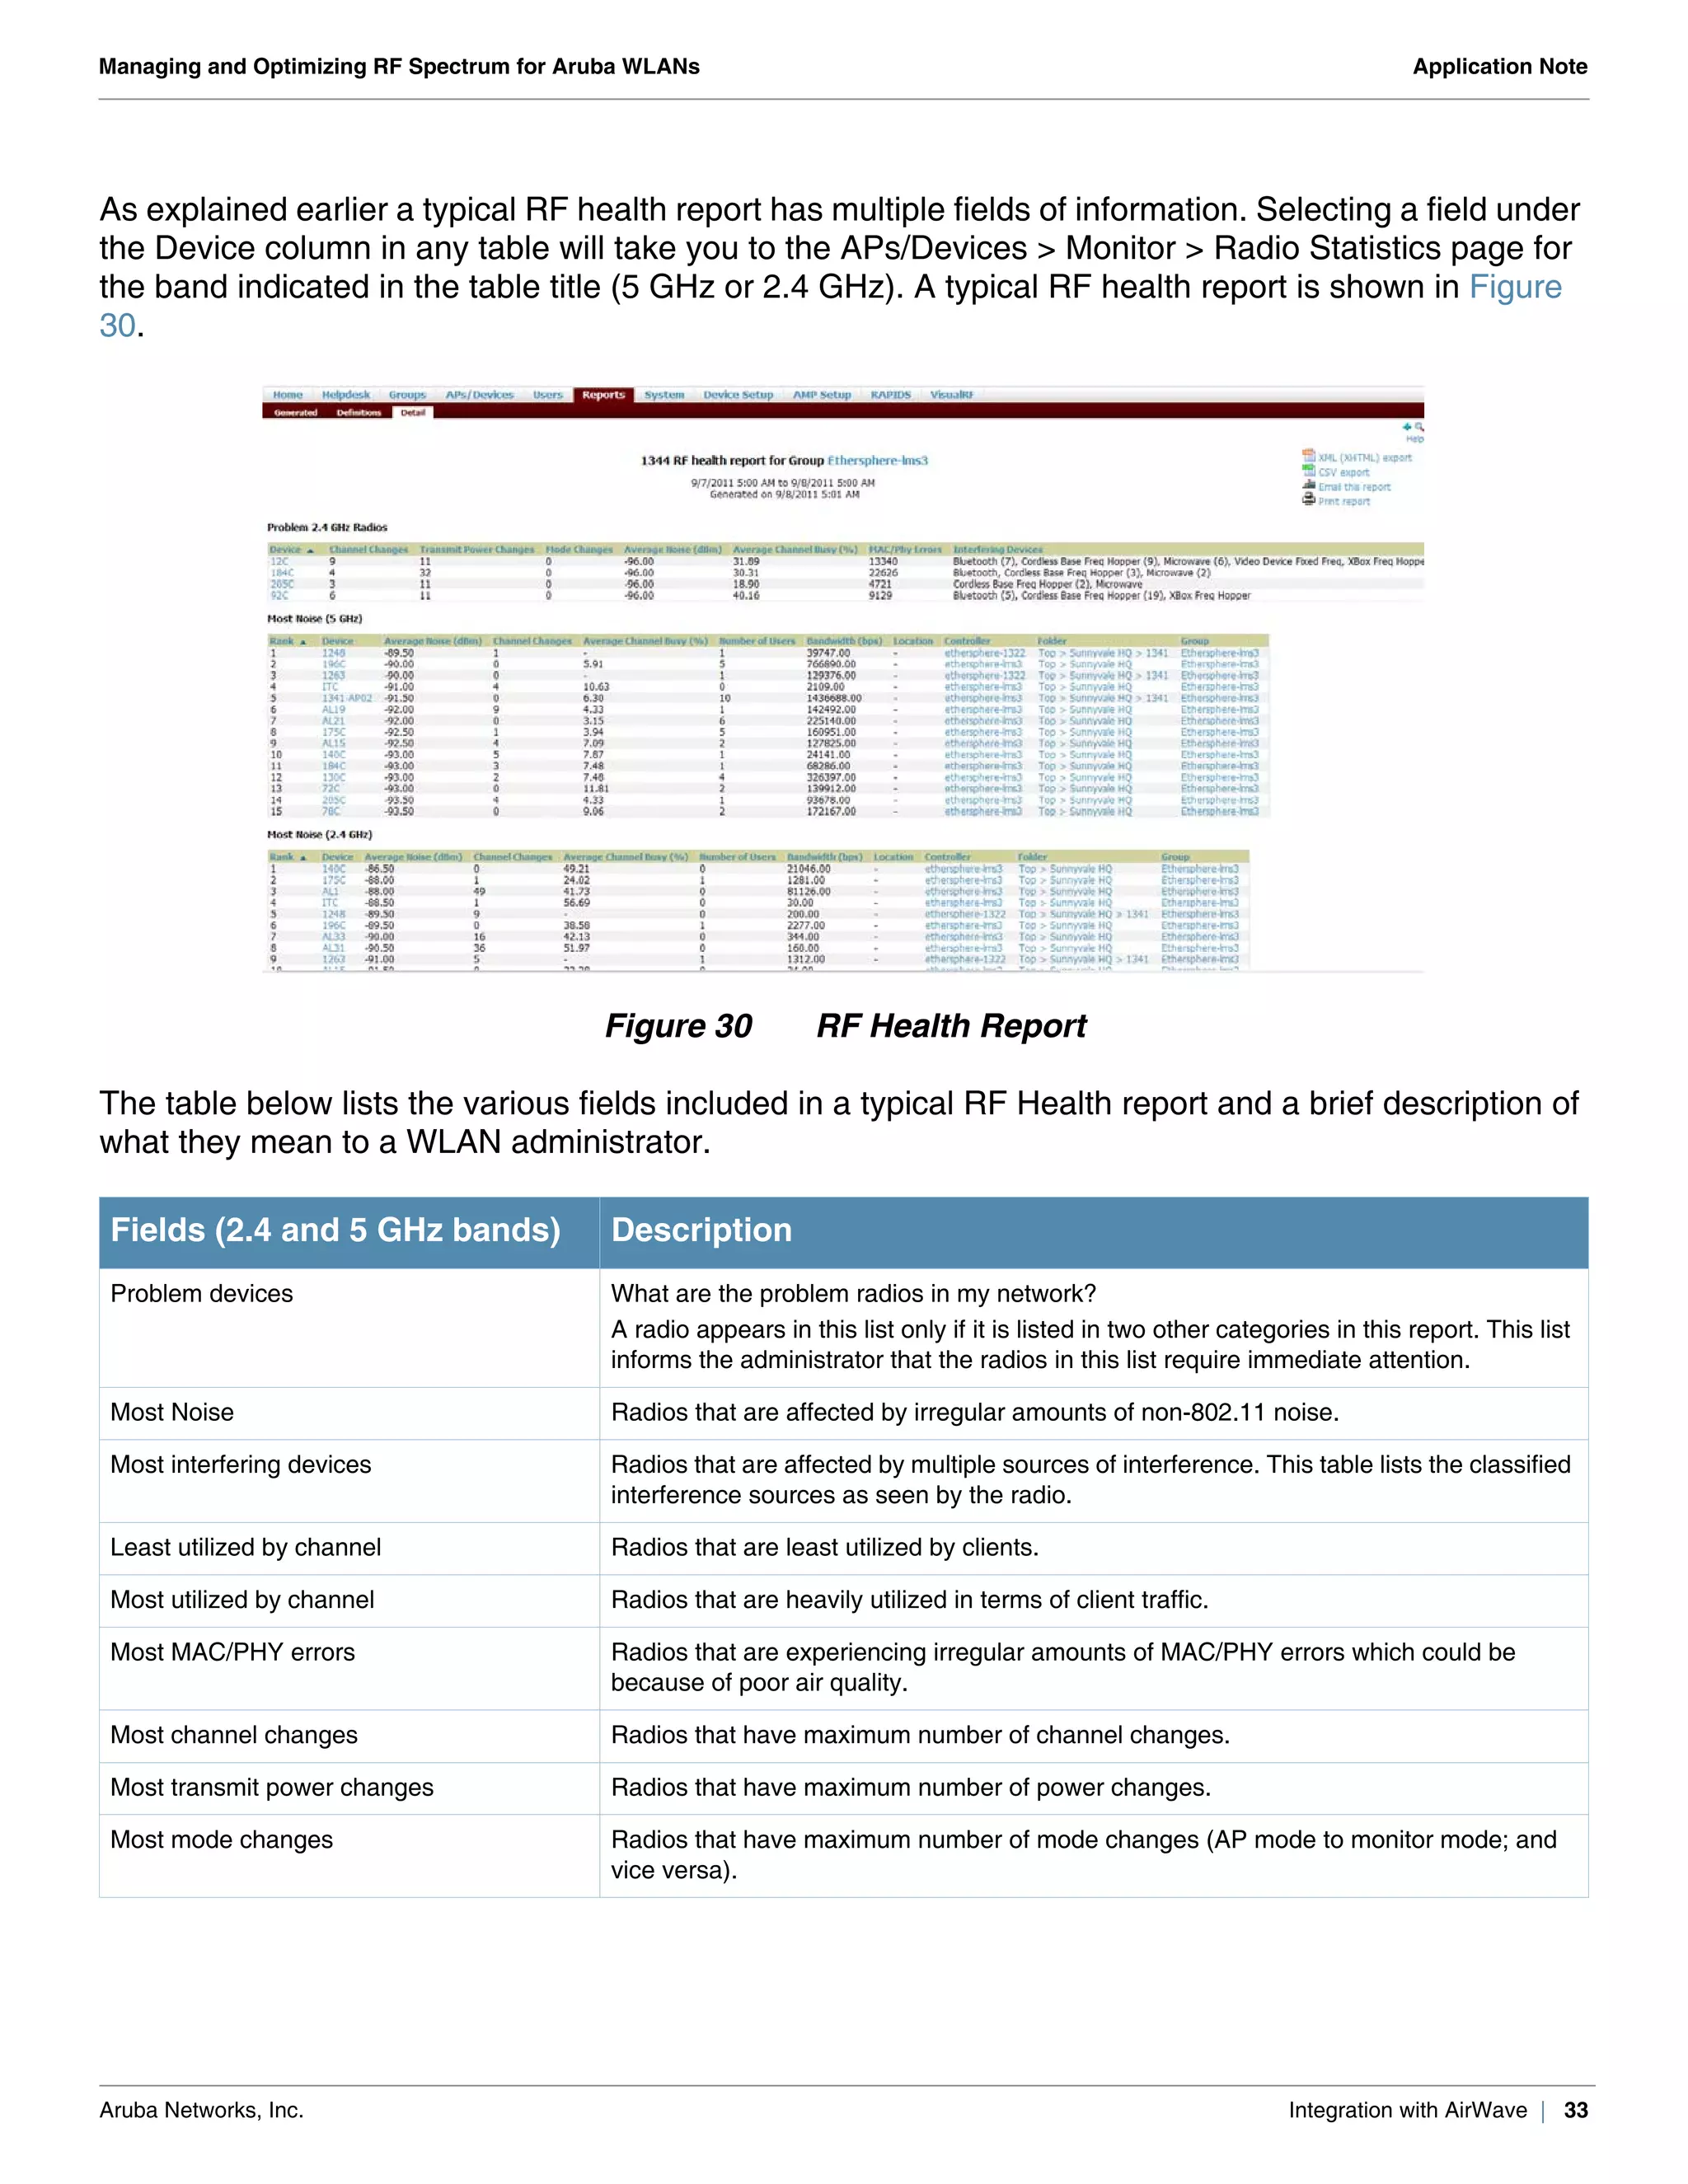
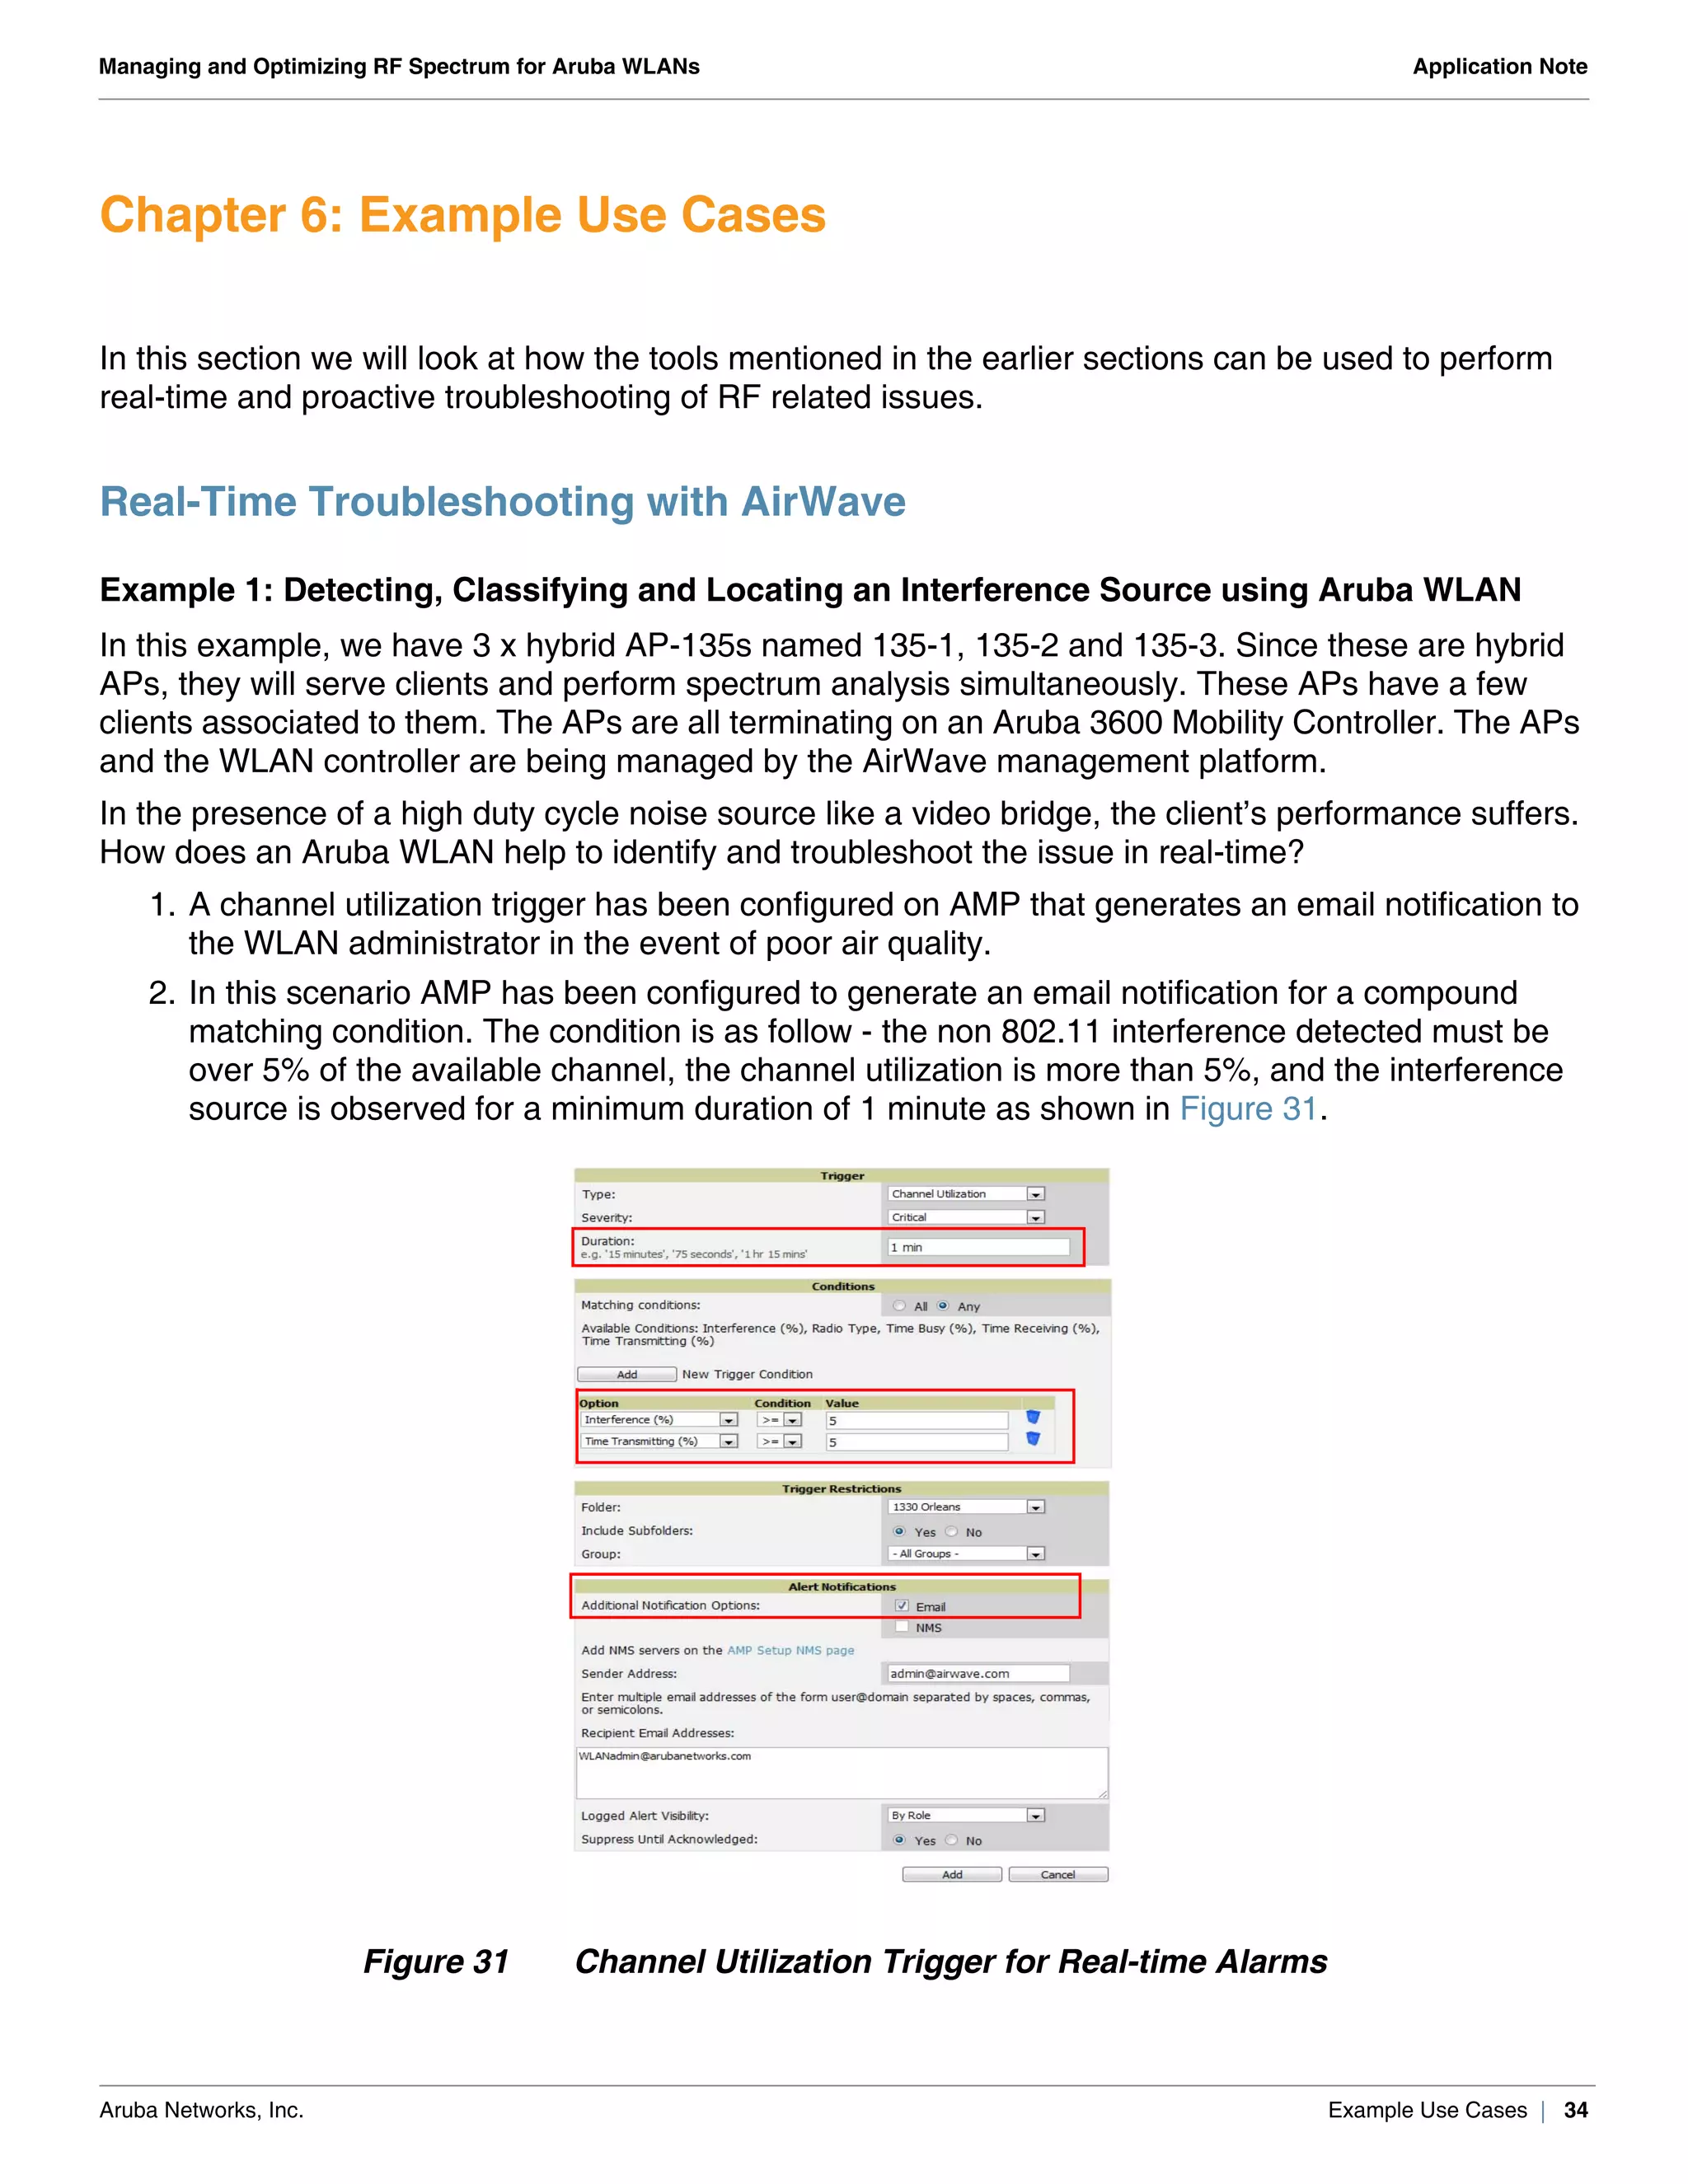
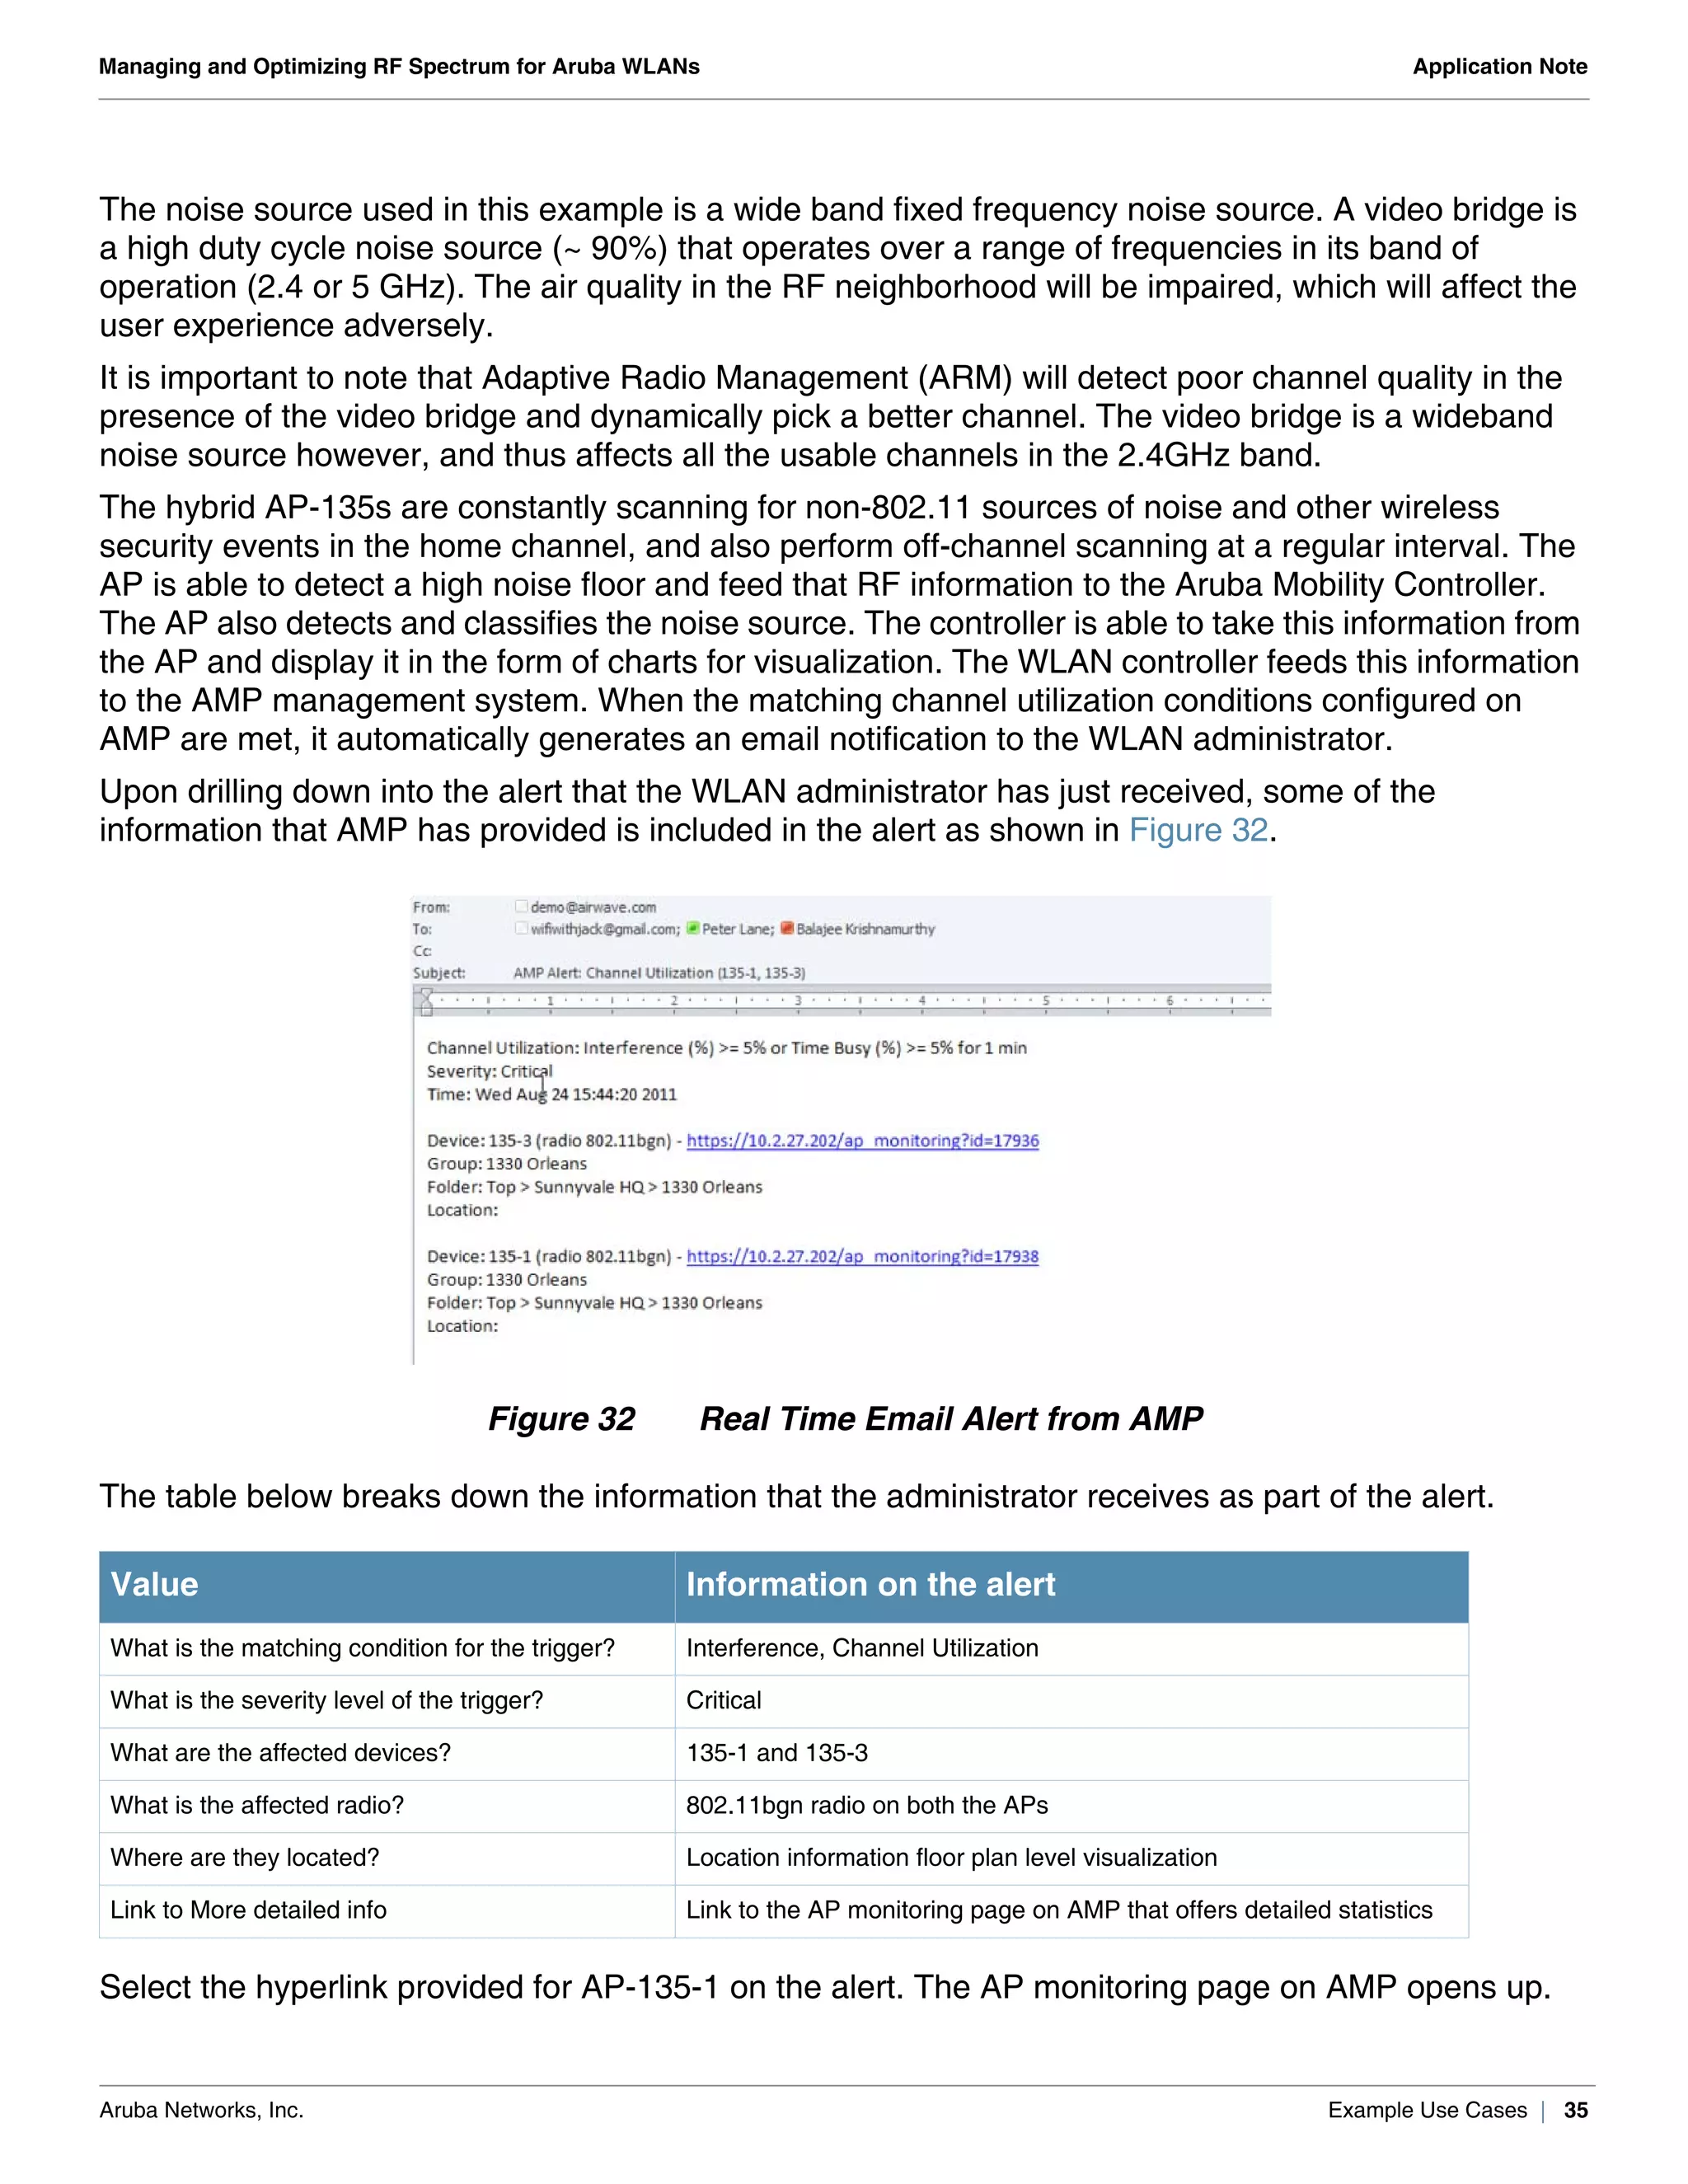
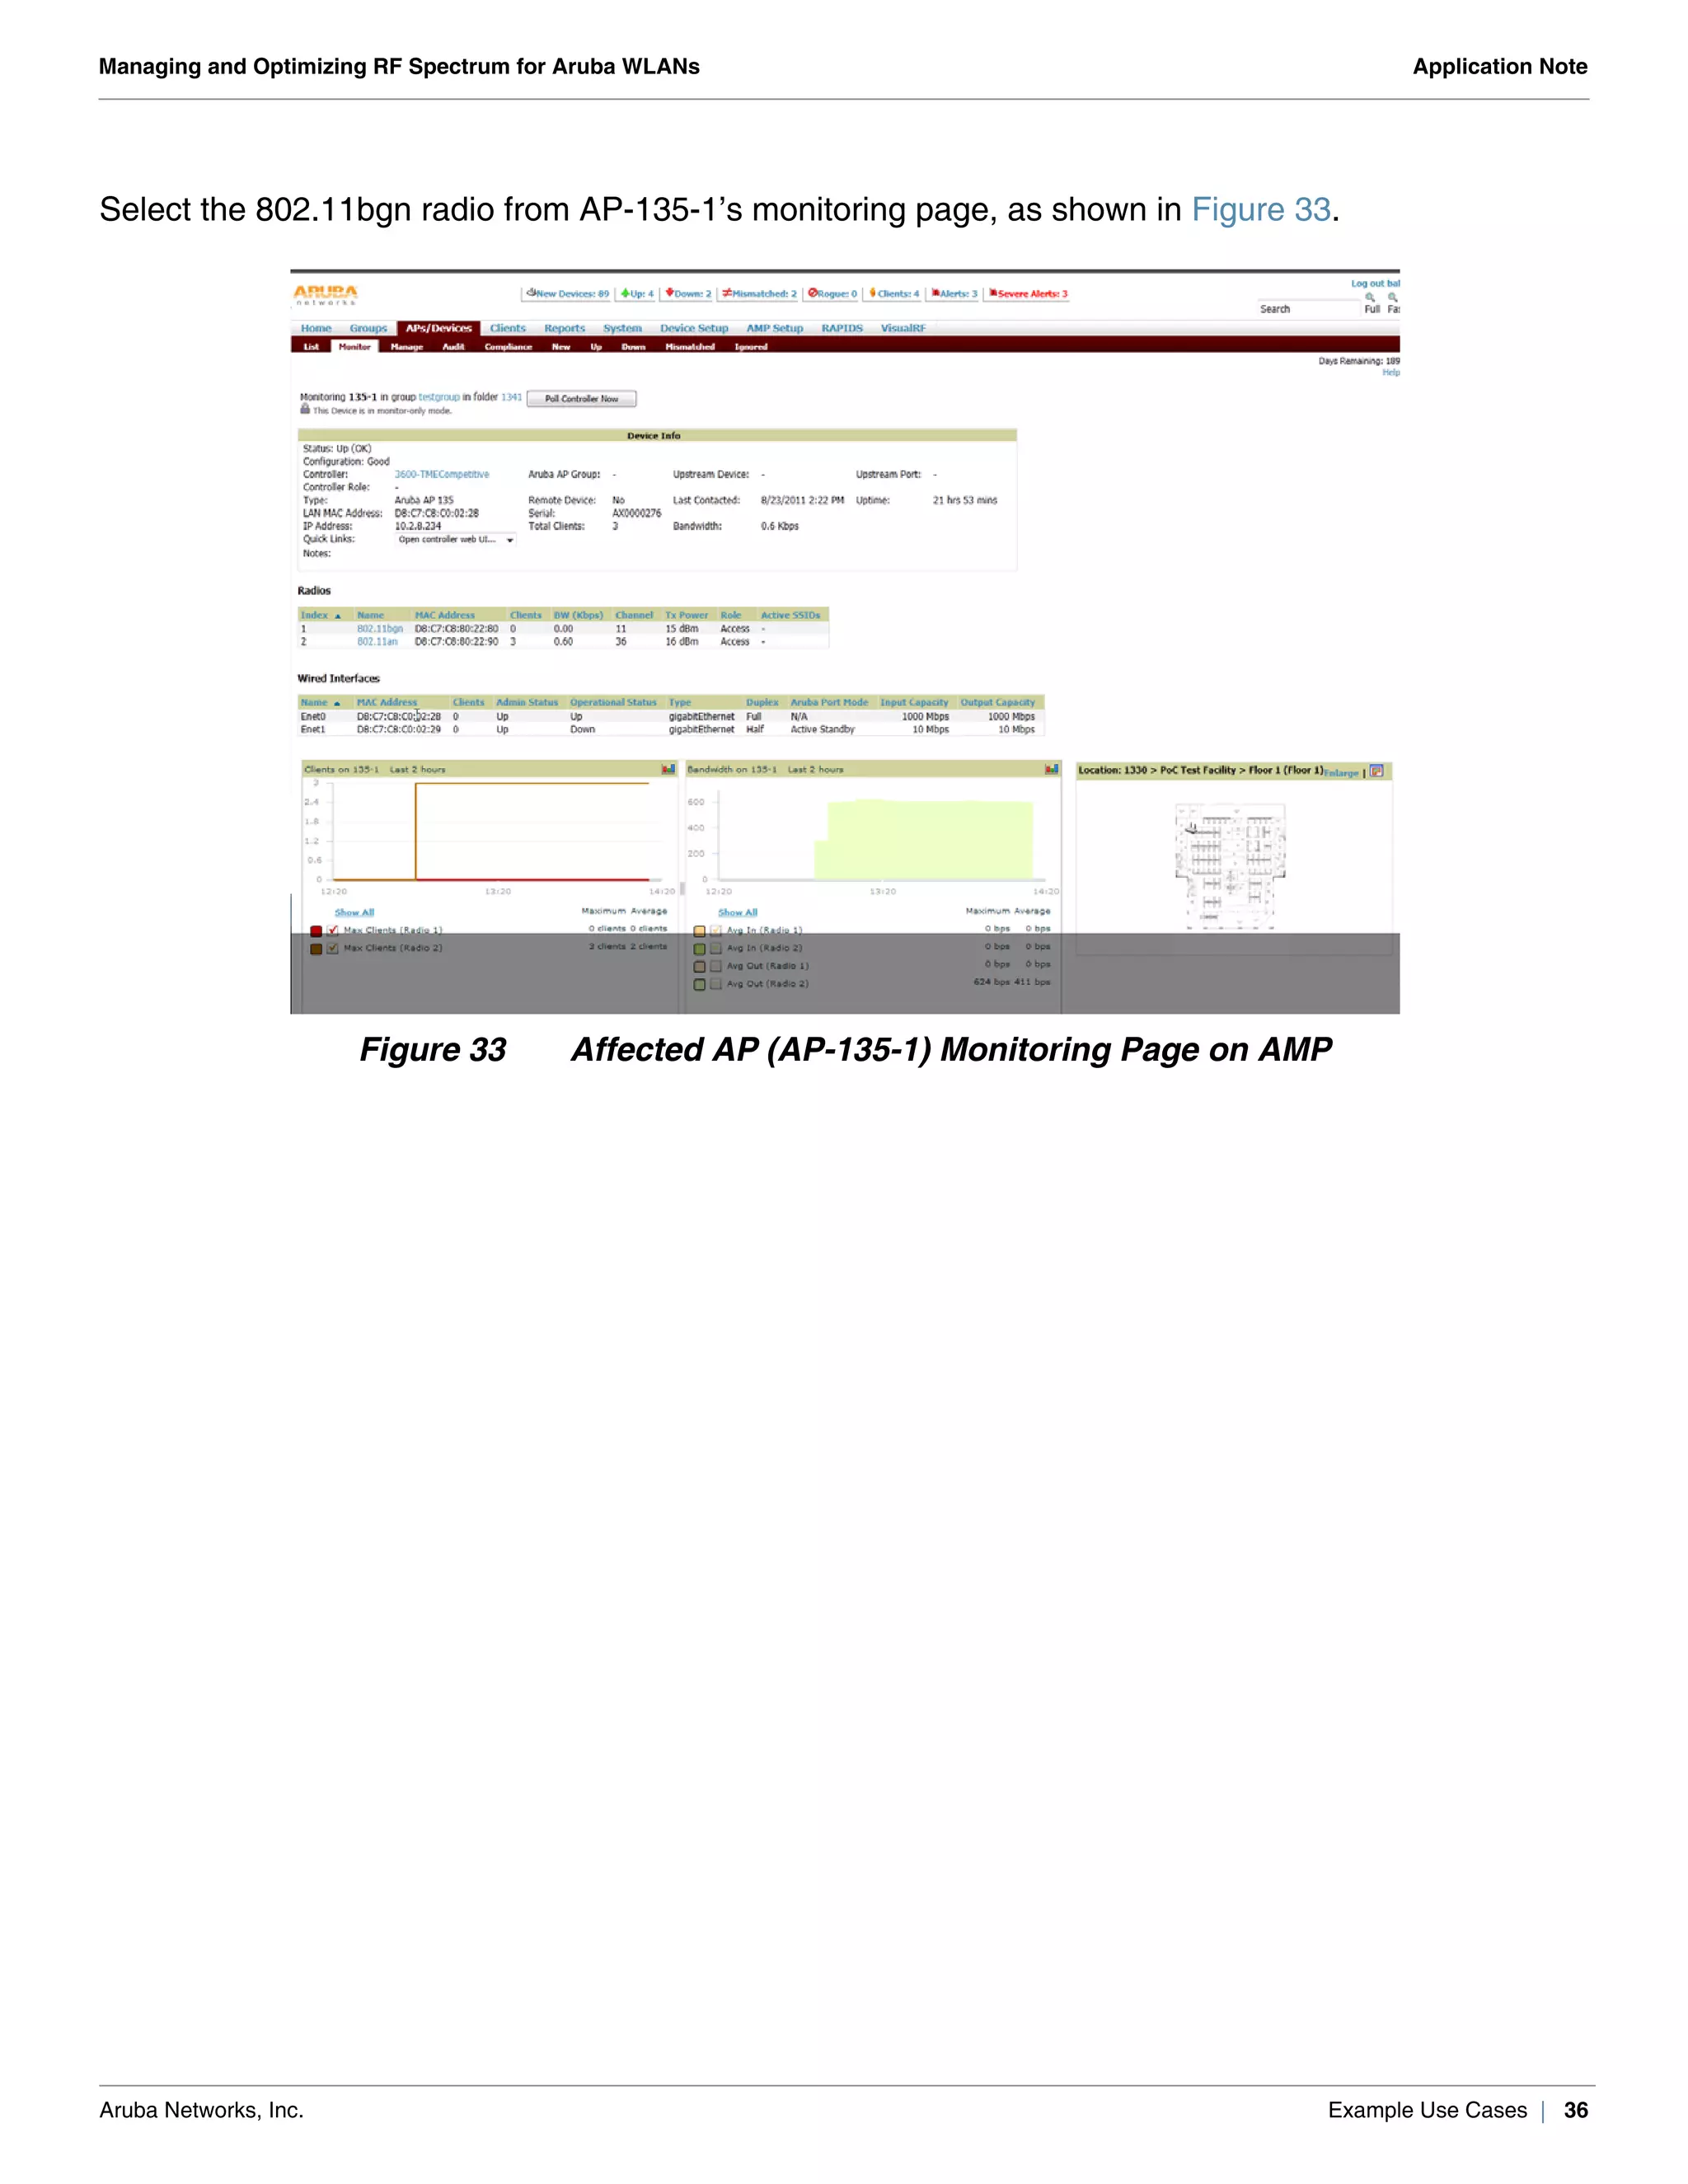
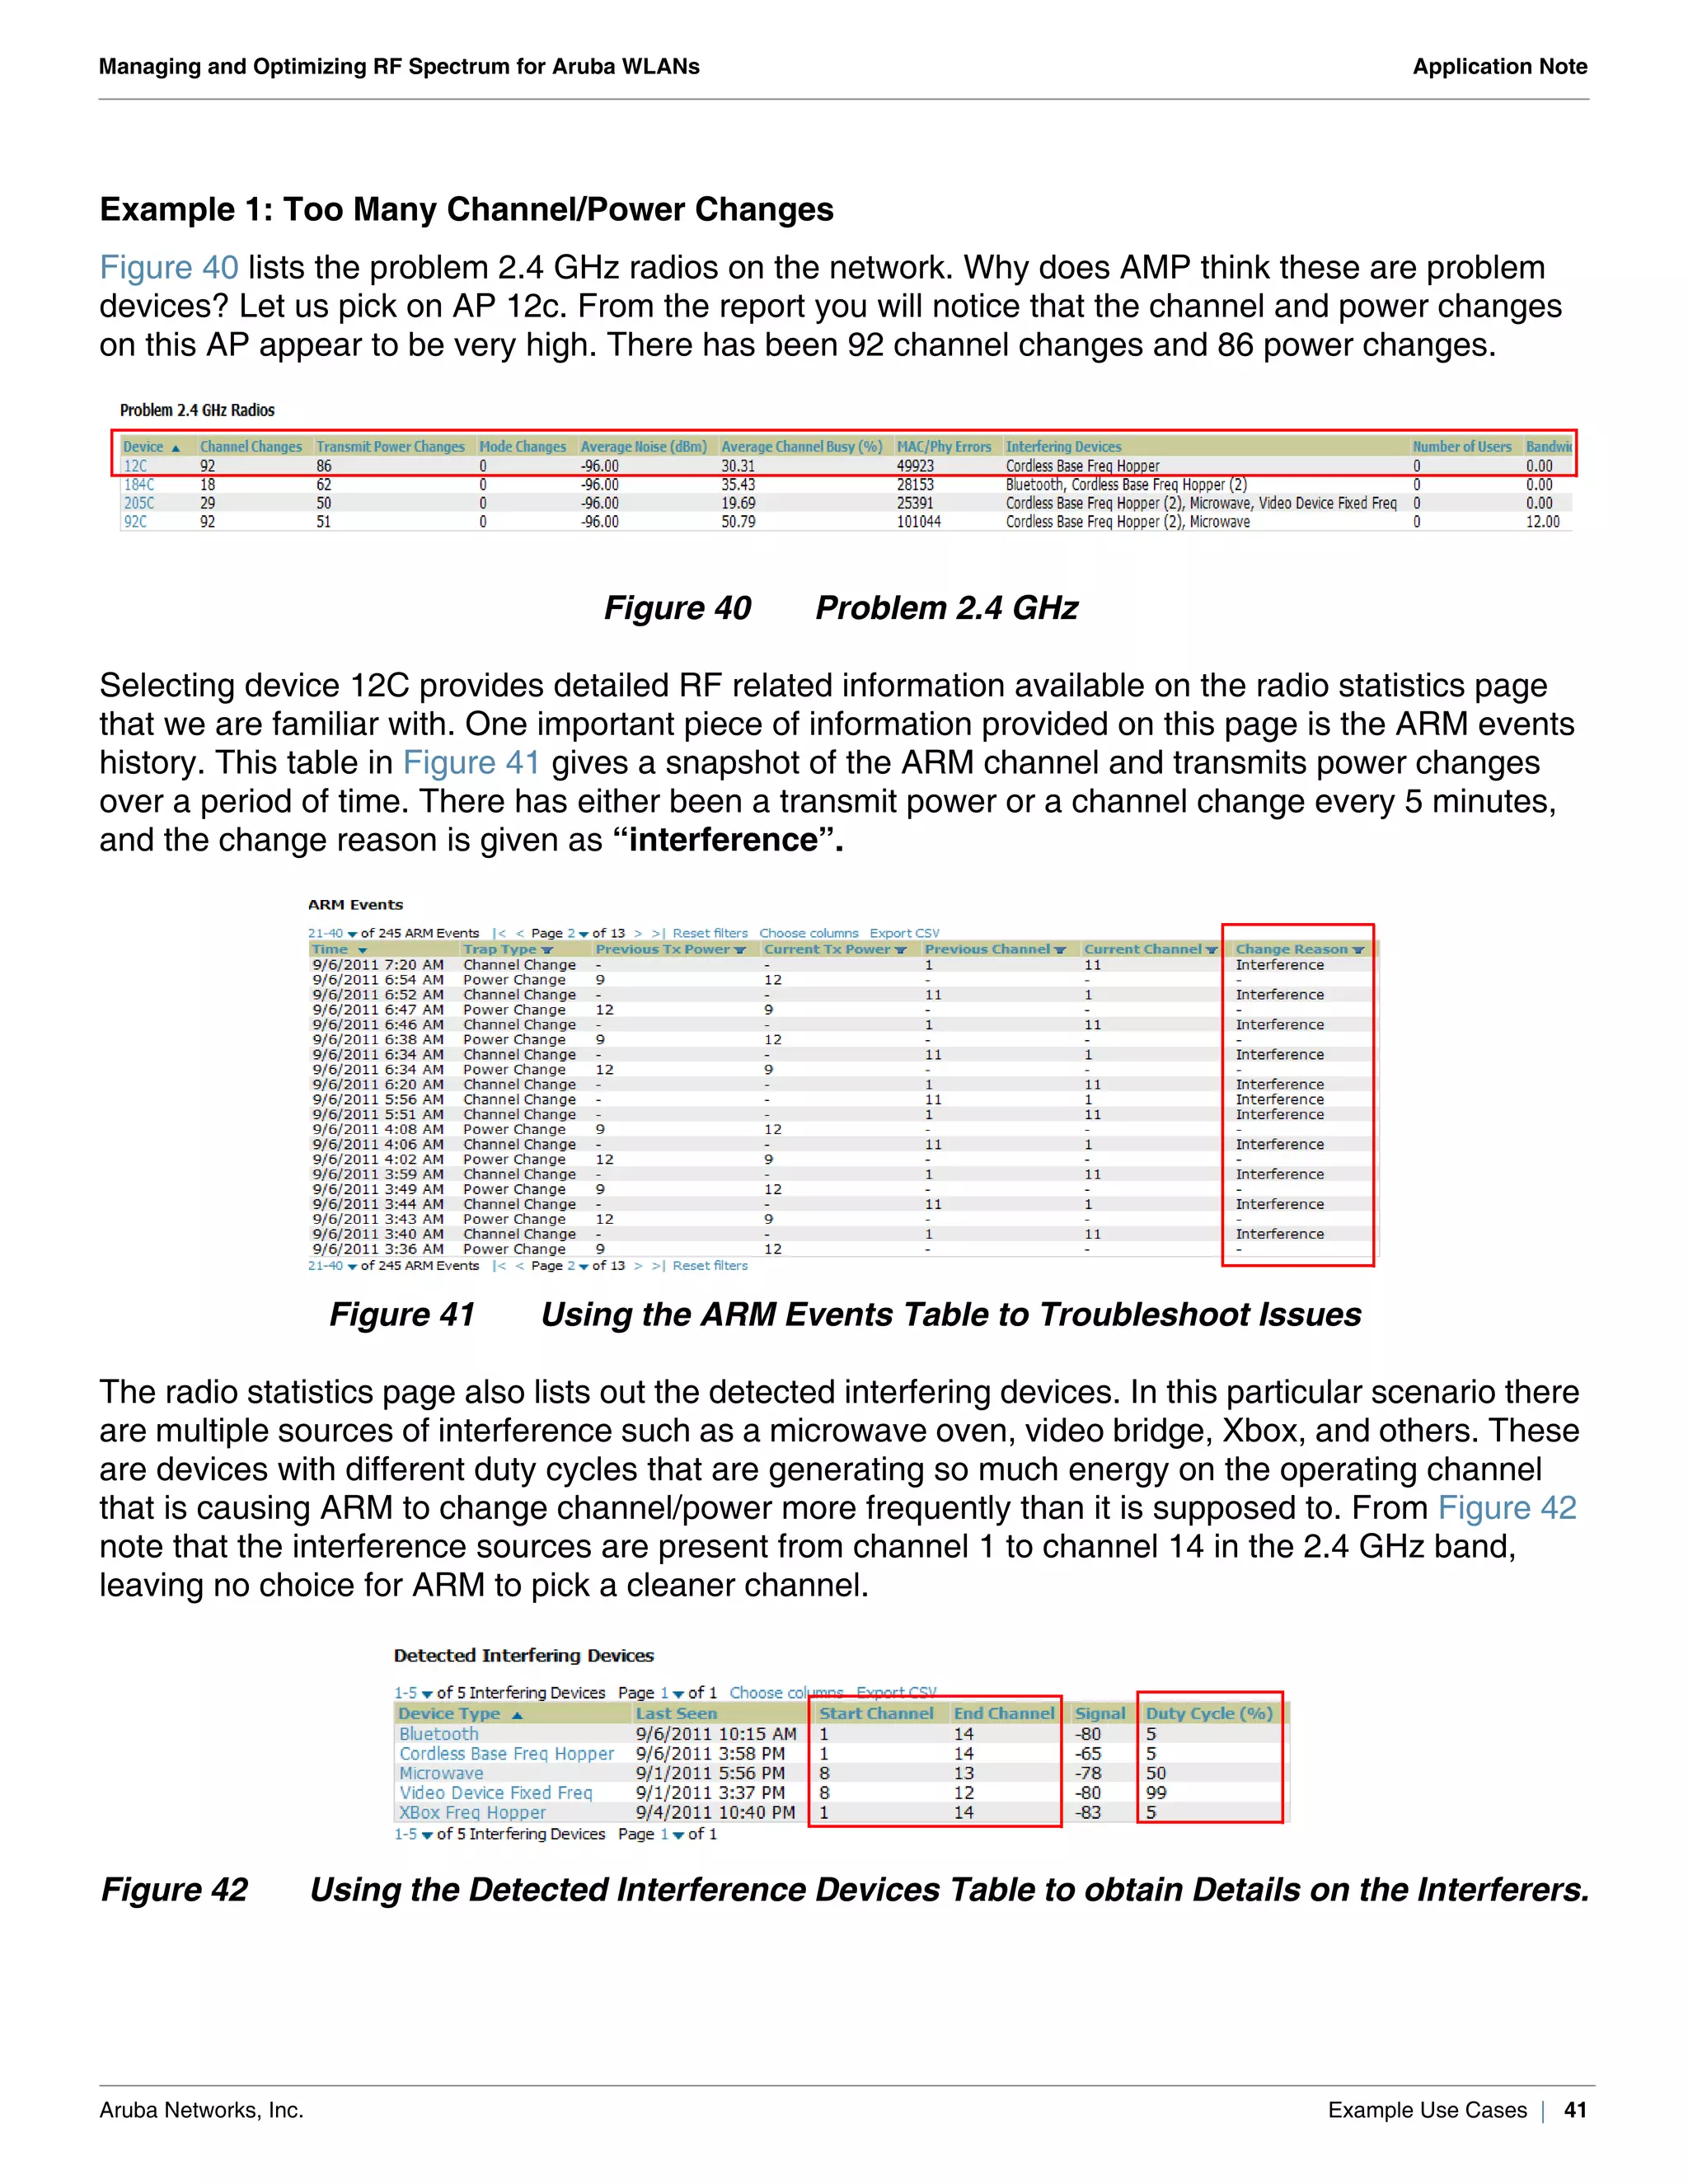
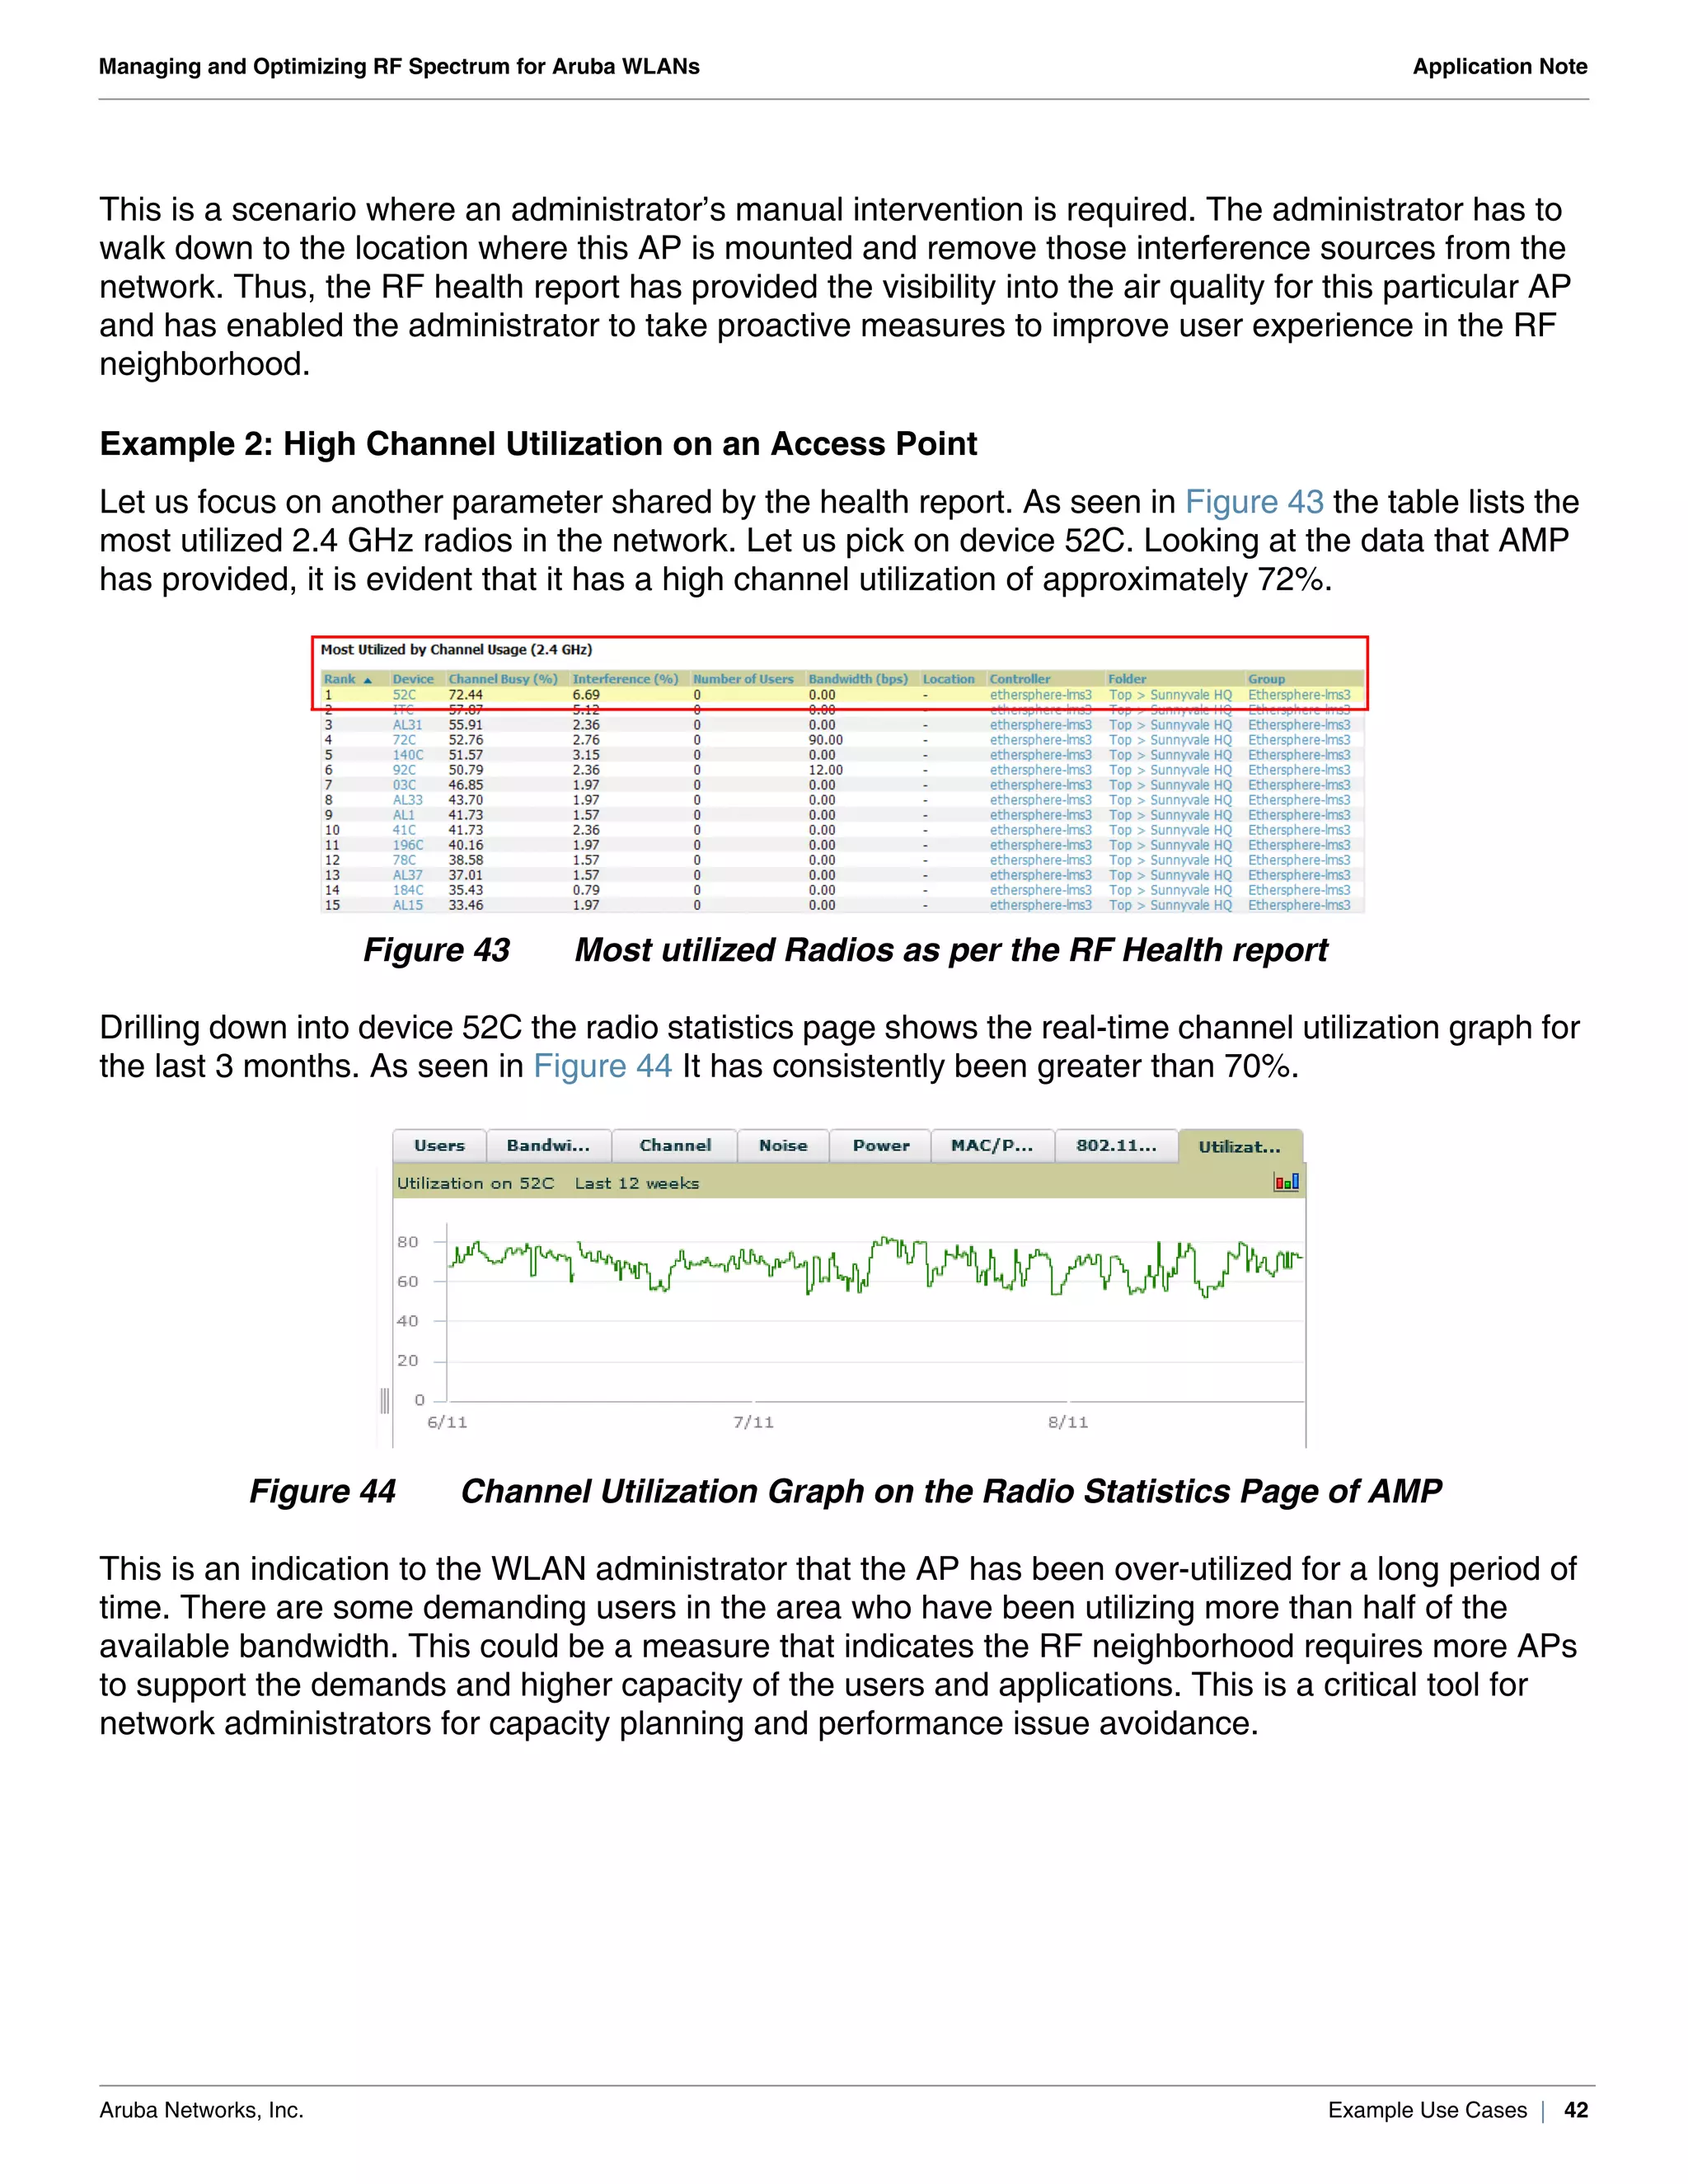

The document outlines the management and optimization of RF spectrum for Aruba WLANs, detailing the challenges of wireless networks and the solutions provided by Aruba's technology. It describes the components of Aruba's spectrum management solution, including mobility controllers, access points, and the AirWave management platform, emphasizing the need for continuous monitoring and adaptive management to mitigate interference. The document also includes a detailed configuration guide and practical examples for deploying spectrum analysis features to ensure reliable WLAN performance.


![Vibe Coding vs. Spec-Driven Development [Free Meetup]](https://cdn.slidesharecdn.com/ss_thumbnails/vibecodingvsspecdrivendevelopment-251209105622-43f455e7-thumbnail.jpg?width=640&height=640&fit=bounds)


