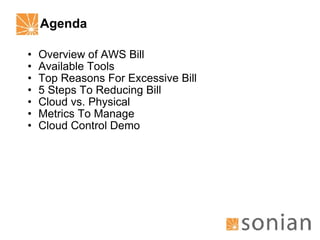
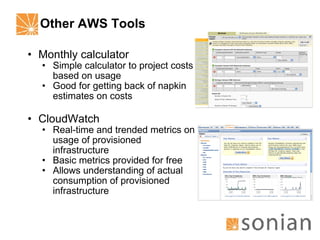
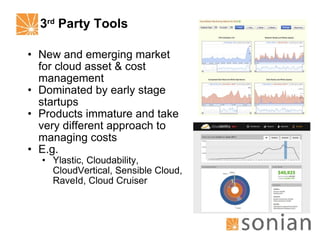
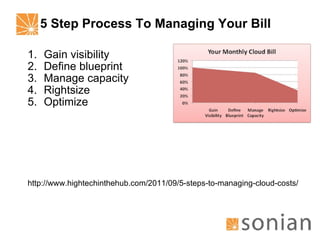
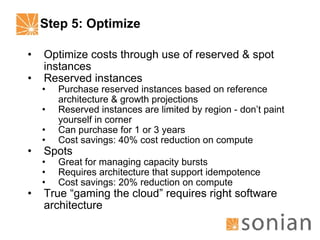
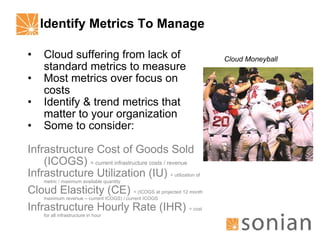
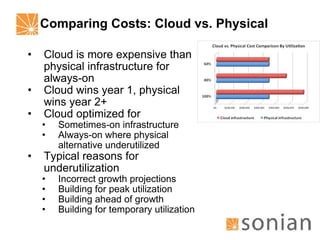
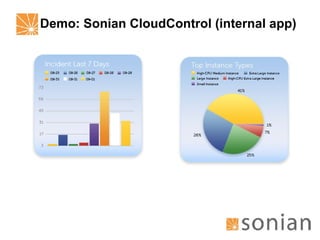
Cloudy Mondays Joe Kinsella, VP of Engineering, Sonian Twitter: @joekinsella, Blog: HighTechInTheHub.com November 2011 Managing AWS Costs
Agenda Overview of AWS Bill Available Tools Top Reasons For Excessive Bill 5 Steps To Reducing Bill Cloud vs. Physical Metrics To Manage Cloud Control Demo
Early Warning Sign: Cloud Dropouts Each month we see more cloud dropouts E.g. Company: Mixpanel Real-time analytics platform launched in 2009 Funded by Sequoia & Y Combinator Started using Rackspace cloud Low initial cost Fast deployment times Consumption-based pricing Cheap CPU performance Issues as cloud usage scaled One size fits all Lack of access to high-end hardware At mercy of neighbors Costs Solution Rebuilt on dedicated infrastructure hosted at SoftLayer Dropouts are early warning sign not everyone successful in the cloud
Amazon AWS Bill Is Complex AWS bill details costs by Service – e.g. EC2, S3, RDS Region –  e.g. US East, US West Service item –  Linux m1.large compute hours Each service has multiple components to pricing All pricing consumption-based Pricing model  very  complex Pricing changes periodically
Example: EC2 Pricing EC2 Compute Pay per compute hour by instance type and OS List and reserved pricing Spot pricing Data transfer out or within regions EC2 Block Store Per GB of provisioned storage I/O requests EC2 Other Elastic IP addresses by hour/remap CloudWatch by metric per month http://aws.amazon.com/ec2/pricing/
Limited AWS Tools For Managing Costs Four primary tools available from AWS Activity Report Usage Report Cost Calculator Cloud Watch Tools provide useful raw data that can be used in managing costs – but not complete solution Tools sufficient for managing small deployments Medium to large deployments require more than AWS currently provides
AWS Activity & Usage Reports Activity report Details costs by service By service and account Current and historical Usage report Export of usage by hour or day Allows filtering on usage type Minimal documentation on how to decipher usage information Using reports with accounts AWS supports designating single account for consolidated bill Common practice to designate empty account for consolidated bill Multiple accounts often used to work around lack of sub-accounts Activity Report Usage Report
Other AWS Tools Monthly calculator Simple calculator to project costs based on usage Good for getting back of napkin estimates on costs CloudWatch Real-time and trended metrics on usage of provisioned infrastructure Basic metrics provided for free Allows understanding of actual consumption of provisioned infrastructure
3 rd  Party Tools New and emerging market for cloud asset & cost management Dominated by early stage startups Products immature and take very different approach to managing costs E.g. Ylastic, Cloudability, CloudVertical, Sensible Cloud, RaveId, Cloud Cruiser
Top Reasons For High AWS Bills Lack of understanding of what software actually costs to operate Lack of understanding of infrastructure & its usage Over optimism on infrastructure lifespan Not taking advantage of all available AWS options to manage costs Lack of infrastructure standardization Inattention to the pricing outliers Human error
5 Step Process To Managing Your Bill Gain visibility Define blueprint Manage capacity Rightsize Optimize http://www.hightechinthehub.com/2011/09/5-steps-to-managing-cloud-costs/
Step 1: Gain Visibility Decide on tool to provide near real-time visibility into your infrastructure, e.g. E.g. AWS console, custom application, Ylastic, Excel spreadsheet Ensure tool supports correlating infrastructure and application Cannot understand costs without knowing how application uses infrastructure Adopt tool that allows customization
Step 2: Define Blueprint Define reference architecture for application(s) Goal: use as close to 100% of provisioned infrastructure without impacting availability & performance Reference architecture should capture all required infrastructure by functional cluster E.g. node sizes, attached storage, production vs. non-production Create cost model for reference architecture Perform R&D to optimize cost model Sample Reference Architecture
Step 3: Manage Capacity Define capacity management policy for each functional clusters Identify all metrics for scale (e.g. # concurrent users, # transactions per second) Identify thresholds for capacity alarms (warning, critical) for both under and over-capacity Identify “run book” for handling capacity constraints Automate alarms through proactive monitoring Iteratively tune policy to use as close to 100% of provisioned infrastructure as possible
Step 4: Rightsize Start to standardize all infrastructure to reference architecture Target infrastructure for rightsizing Non-standard – infrastructure that deviates from reference architecture Underutilized – infrastructure that can be consolidated based on capacity management policy Unused infrastructure – infrastructure that is used infrequently or not at all Implement iteratively over time to minimize disruption
Step 5: Optimize Optimize costs through use of reserved & spot instances Reserved instances Purchase reserved instances based on reference architecture & growth projections Reserved instances are limited by region - don’t paint yourself in corner Can purchase for 1 or 3 years Cost savings: 40% cost reduction on compute Spots Great for managing capacity bursts Requires architecture that support idempotence Cost savings: 20% reduction on compute True “gaming the cloud” requires right software architecture
Identify Metrics To Manage Cloud suffering from lack of standard metrics to measure Most metrics over focus on costs Identify & trend metrics that matter to your organization Some to consider: Infrastructure Cost of Goods Sold (ICOGS)  = current infrastructure costs / revenue Infrastructure Utilization (IU)  = utilization of metric / maximum available quantity Cloud Elasticity (CE)  = (ICOGS at projected 12 month maximum revenue – current ICOGS) / current ICOGS Infrastructure Hourly Rate (IHR)  = cost for all infrastructure in hour Cloud Moneyball
Comparing Costs: Cloud vs. Physical Cloud is more expensive than physical infrastructure for always-on Cloud wins year 1, physical wins year 2+ Cloud optimized for Sometimes-on infrastructure Always-on where physical alternative underutilized Typical reasons for underutilization Incorrect growth projections Building for peak utilization Building ahead of growth Building for temporary utilization
Demo: Sonian CloudControl (internal app)

Managing Amazon AWS Costs

  • 1.
    Cloudy Mondays JoeKinsella, VP of Engineering, Sonian Twitter: @joekinsella, Blog: HighTechInTheHub.com November 2011 Managing AWS Costs
  • 2.
    Agenda Overview ofAWS Bill Available Tools Top Reasons For Excessive Bill 5 Steps To Reducing Bill Cloud vs. Physical Metrics To Manage Cloud Control Demo
  • 3.
    Early Warning Sign:Cloud Dropouts Each month we see more cloud dropouts E.g. Company: Mixpanel Real-time analytics platform launched in 2009 Funded by Sequoia & Y Combinator Started using Rackspace cloud Low initial cost Fast deployment times Consumption-based pricing Cheap CPU performance Issues as cloud usage scaled One size fits all Lack of access to high-end hardware At mercy of neighbors Costs Solution Rebuilt on dedicated infrastructure hosted at SoftLayer Dropouts are early warning sign not everyone successful in the cloud
  • 4.
    Amazon AWS BillIs Complex AWS bill details costs by Service – e.g. EC2, S3, RDS Region – e.g. US East, US West Service item – Linux m1.large compute hours Each service has multiple components to pricing All pricing consumption-based Pricing model very complex Pricing changes periodically
  • 5.
    Example: EC2 PricingEC2 Compute Pay per compute hour by instance type and OS List and reserved pricing Spot pricing Data transfer out or within regions EC2 Block Store Per GB of provisioned storage I/O requests EC2 Other Elastic IP addresses by hour/remap CloudWatch by metric per month http://aws.amazon.com/ec2/pricing/
  • 6.
    Limited AWS ToolsFor Managing Costs Four primary tools available from AWS Activity Report Usage Report Cost Calculator Cloud Watch Tools provide useful raw data that can be used in managing costs – but not complete solution Tools sufficient for managing small deployments Medium to large deployments require more than AWS currently provides
  • 7.
    AWS Activity &Usage Reports Activity report Details costs by service By service and account Current and historical Usage report Export of usage by hour or day Allows filtering on usage type Minimal documentation on how to decipher usage information Using reports with accounts AWS supports designating single account for consolidated bill Common practice to designate empty account for consolidated bill Multiple accounts often used to work around lack of sub-accounts Activity Report Usage Report
  • 8.
    Other AWS ToolsMonthly calculator Simple calculator to project costs based on usage Good for getting back of napkin estimates on costs CloudWatch Real-time and trended metrics on usage of provisioned infrastructure Basic metrics provided for free Allows understanding of actual consumption of provisioned infrastructure
  • 9.
    3 rd Party Tools New and emerging market for cloud asset & cost management Dominated by early stage startups Products immature and take very different approach to managing costs E.g. Ylastic, Cloudability, CloudVertical, Sensible Cloud, RaveId, Cloud Cruiser
  • 10.
    Top Reasons ForHigh AWS Bills Lack of understanding of what software actually costs to operate Lack of understanding of infrastructure & its usage Over optimism on infrastructure lifespan Not taking advantage of all available AWS options to manage costs Lack of infrastructure standardization Inattention to the pricing outliers Human error
  • 11.
    5 Step ProcessTo Managing Your Bill Gain visibility Define blueprint Manage capacity Rightsize Optimize http://www.hightechinthehub.com/2011/09/5-steps-to-managing-cloud-costs/
  • 12.
    Step 1: GainVisibility Decide on tool to provide near real-time visibility into your infrastructure, e.g. E.g. AWS console, custom application, Ylastic, Excel spreadsheet Ensure tool supports correlating infrastructure and application Cannot understand costs without knowing how application uses infrastructure Adopt tool that allows customization
  • 13.
    Step 2: DefineBlueprint Define reference architecture for application(s) Goal: use as close to 100% of provisioned infrastructure without impacting availability & performance Reference architecture should capture all required infrastructure by functional cluster E.g. node sizes, attached storage, production vs. non-production Create cost model for reference architecture Perform R&D to optimize cost model Sample Reference Architecture
  • 14.
    Step 3: ManageCapacity Define capacity management policy for each functional clusters Identify all metrics for scale (e.g. # concurrent users, # transactions per second) Identify thresholds for capacity alarms (warning, critical) for both under and over-capacity Identify “run book” for handling capacity constraints Automate alarms through proactive monitoring Iteratively tune policy to use as close to 100% of provisioned infrastructure as possible
  • 15.
    Step 4: RightsizeStart to standardize all infrastructure to reference architecture Target infrastructure for rightsizing Non-standard – infrastructure that deviates from reference architecture Underutilized – infrastructure that can be consolidated based on capacity management policy Unused infrastructure – infrastructure that is used infrequently or not at all Implement iteratively over time to minimize disruption
  • 16.
    Step 5: OptimizeOptimize costs through use of reserved & spot instances Reserved instances Purchase reserved instances based on reference architecture & growth projections Reserved instances are limited by region - don’t paint yourself in corner Can purchase for 1 or 3 years Cost savings: 40% cost reduction on compute Spots Great for managing capacity bursts Requires architecture that support idempotence Cost savings: 20% reduction on compute True “gaming the cloud” requires right software architecture
  • 17.
    Identify Metrics ToManage Cloud suffering from lack of standard metrics to measure Most metrics over focus on costs Identify & trend metrics that matter to your organization Some to consider: Infrastructure Cost of Goods Sold (ICOGS) = current infrastructure costs / revenue Infrastructure Utilization (IU) = utilization of metric / maximum available quantity Cloud Elasticity (CE) = (ICOGS at projected 12 month maximum revenue – current ICOGS) / current ICOGS Infrastructure Hourly Rate (IHR) = cost for all infrastructure in hour Cloud Moneyball
  • 18.
    Comparing Costs: Cloudvs. Physical Cloud is more expensive than physical infrastructure for always-on Cloud wins year 1, physical wins year 2+ Cloud optimized for Sometimes-on infrastructure Always-on where physical alternative underutilized Typical reasons for underutilization Incorrect growth projections Building for peak utilization Building ahead of growth Building for temporary utilization
  • 19.