Managing 4,000 devices across 20+ remote sites on a single console
•Download as PPTX, PDF•
0 likes•543 views

Reference Customer Implementation: Monitoring 4,000 devices distributed across 20+ remote sites made easy with OpManager Enterprise Edition - A unified approach to manage the complete IT

Recommended
Recommended
More Related Content
What's hot
What's hot (20)
Similar to Managing 4,000 devices across 20+ remote sites on a single console
Similar to Managing 4,000 devices across 20+ remote sites on a single console (20)
More from ManageEngine, Zoho Corporation
More from ManageEngine, Zoho Corporation (20)
Recently uploaded
Recently uploaded (20)
Managing 4,000 devices across 20+ remote sites on a single console
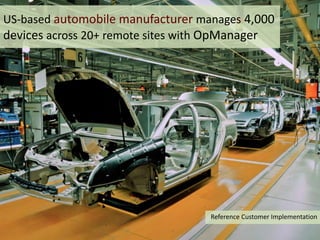
- 1. US-based automobile manufacturer manages 4,000 devices across 20+ remote sites with OpManager Reference Customer Implementation
- 2. Customer details • A leading automobile manufacturer in USA having presence in Americas, Europe & Africa.
- 3. Challenges!
- 4. Decentralized IT Network management happened in silos leading to no or limited visibility across IT infrastructure.
- 5. MTTR suffered with diverse set of tools! Identifying root-cause took longer time with disparate network monitoring tools & custom products leading to increased resolution time (MTTR).
- 6. Scalability Not every tool they used had the ability to scale across remote offices and manage such huge monitoring load. 4,000 devices to monitor | Around 20,000 interfaces | Across 20+ remote offices
- 7. Solution
- 8. The evaluation criteria • A scalable architecture • High availability engine • Ability to monitor devices across remote sites • A unified alarms console • Ability to extract reports across remote sites or for a specific site from the central location • Provide user access to remote-site admins and the central admins for faster incident identification and resolution
- 9. The evaluation criteria • 4,000 devices performance monitoring – Network devices, Windows and Linux Servers, VMware ESX/ ESXi Monitoring & other IT infrastructure devices • 1000 interfaces flow based traffic analysis – NetFlow, sFlow, IP FIX • 2,000 Network devices change, configuration and compliance management
- 10. The product chosen over Zabbix and Solarwinds Orion NPM
- 11. Result
- 12. A unified network management • Offers a unified alarm console for the complete IT infrastructure • Aggregates performance data across remote-sites to present historical trend reports for the complete IT infrastructure or specific device type or a particular remote site
- 13. Faster identification and resolution of network faults • The multi-layer fault identification and resolution helps admins curb potential performance bottlenecks before it impacts the business
- 14. The one tool to spot fault root-cause • Unambiguous root-cause identification resulting in reduced MTTR (Mean-Time-To- Resolve)
- 15. Scalability • The organization has now gained the visibility they need across multiple-remote sites. A scalable probe-central architecture that’s capable of monitoring over 50,000 interfaces or 5,000 devices on a single unified console. Each probe scales up to 10,000 interfaces or 1,000 devices comfortably.
- 16. 24x7 monitoring They have configured Failover for their probes for high availability and 24x7 monitoring
- 17. A comprehensive network management functionality
- 18. Easy to deploy • The product deployment is pretty straightforward, for a 4,000 devices network it takes lesser than two weeks to deploy • The GUI is carefully built to be intuitive and easy-to- use, even a new IT hire can navigate to the root-cause quickly • The out-of-the-box monitoring, quick configuration wizards & view, smart probe upgrade make it easy to maintain
- 19. Affordable & Faster ROI • The scalable architecture leaves lesser than datacenter footprints to manage • Not a million dollar renewal. You can own the product at the fractions of Big4 products renewal cost.