SlideShare a Scribd company logo
MANAGERIAL ECONOMICS
DR. JAYANT DUBEY
Prof. & Head,
Dept. of Business Studies,
BTIRT, Sagar
M E Syllabus
 Nature & scope of managerial economics,
 Basic Economic Tools, (Function,
 Opportunity Cost Principle, Incremental Principles,
Principle of Time Perspective, Discounting Principle.
 Role & Responsibilities of Managerial Economist,
 Demand Analysis and forecasting.
 Price and Demand. Income and Demand.
 Price of related goods and demand Advertising and
Demand.
 Demand forecasting: Methods, purpose and factors
involved.
Introduction
 Upcoming of Managerial Economic is
due to three factors;
 Complexity in business decision-making
 Use of economic concept, theories &
tools of economic analysis
 Increase in demand for trained
managerial manpower.
What Economic is?
 It is a social science. It studies how people,
individual, households, firms etc. maximizes its
gains from limited resources. In Economics this
maximizing factor is termed as “optimizing
behavior”. Ex. Firm produces goods & services.
 Economics is a study of the choice-making behavior
of the people. In reality choice-making is not simple
as it looks because world is very complex &
decision is taken under risk and uncertainty.
 Analytical tools & techniques, economic laws and
theories combined to form the body of economics.
Managerial Economics
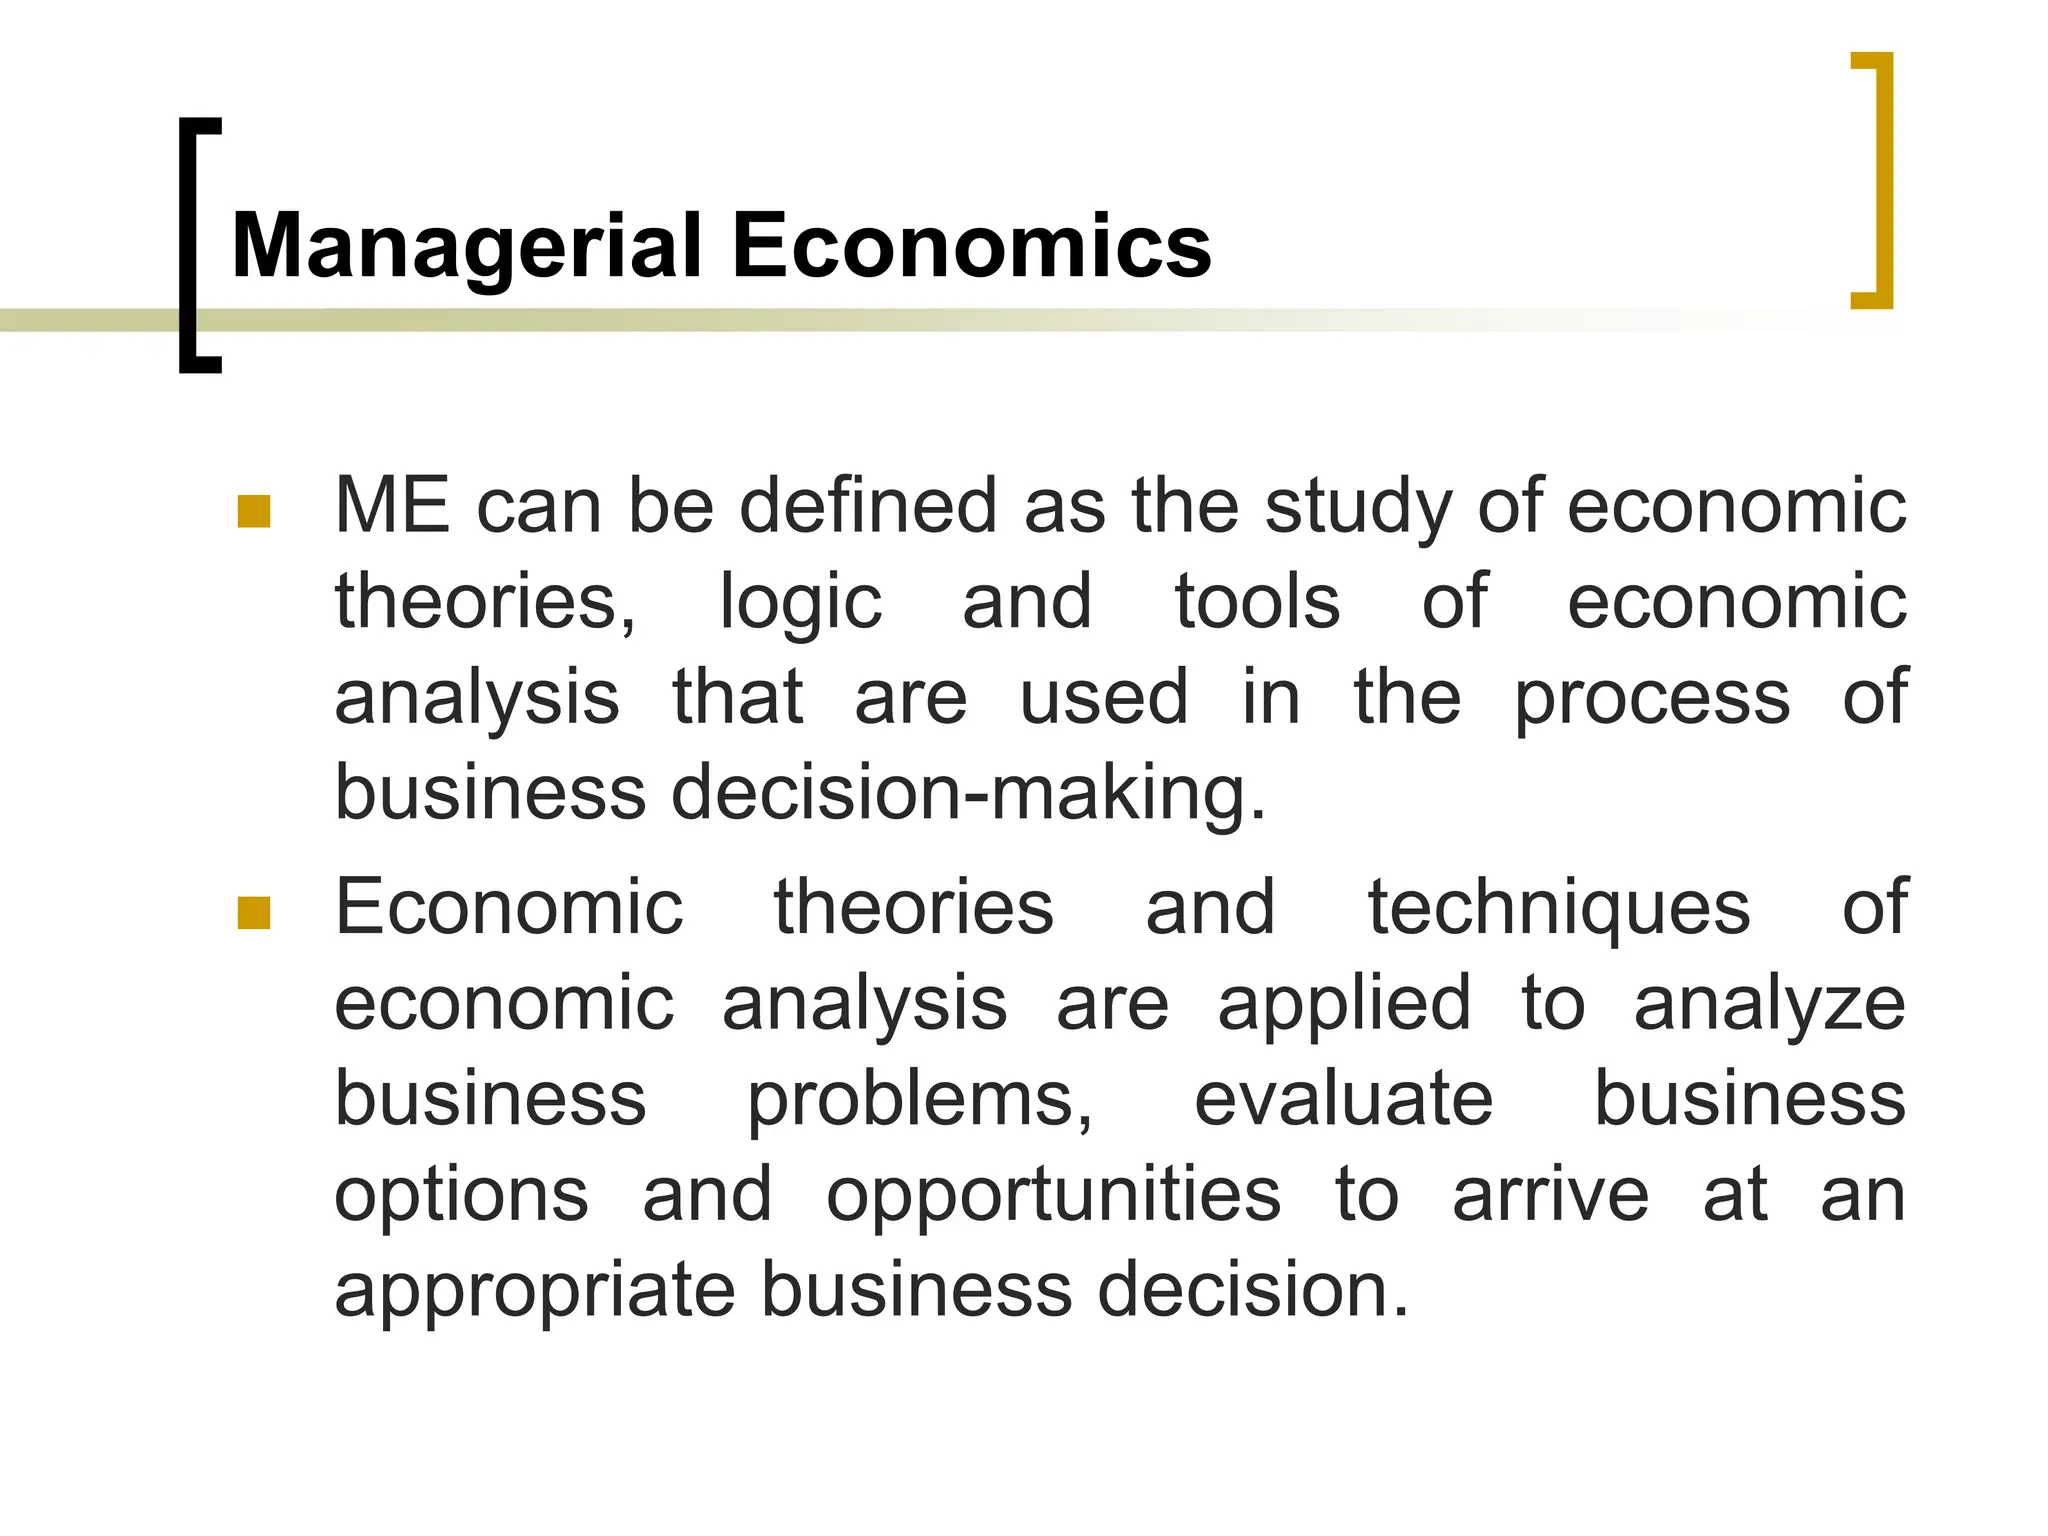
 ME can be defined as the study of economic
theories, logic and tools of economic
analysis that are used in the process of
business decision-making.
 Economic theories and techniques of
economic analysis are applied to analyze
business problems, evaluate business
options and opportunities to arrive at an
appropriate business decision.
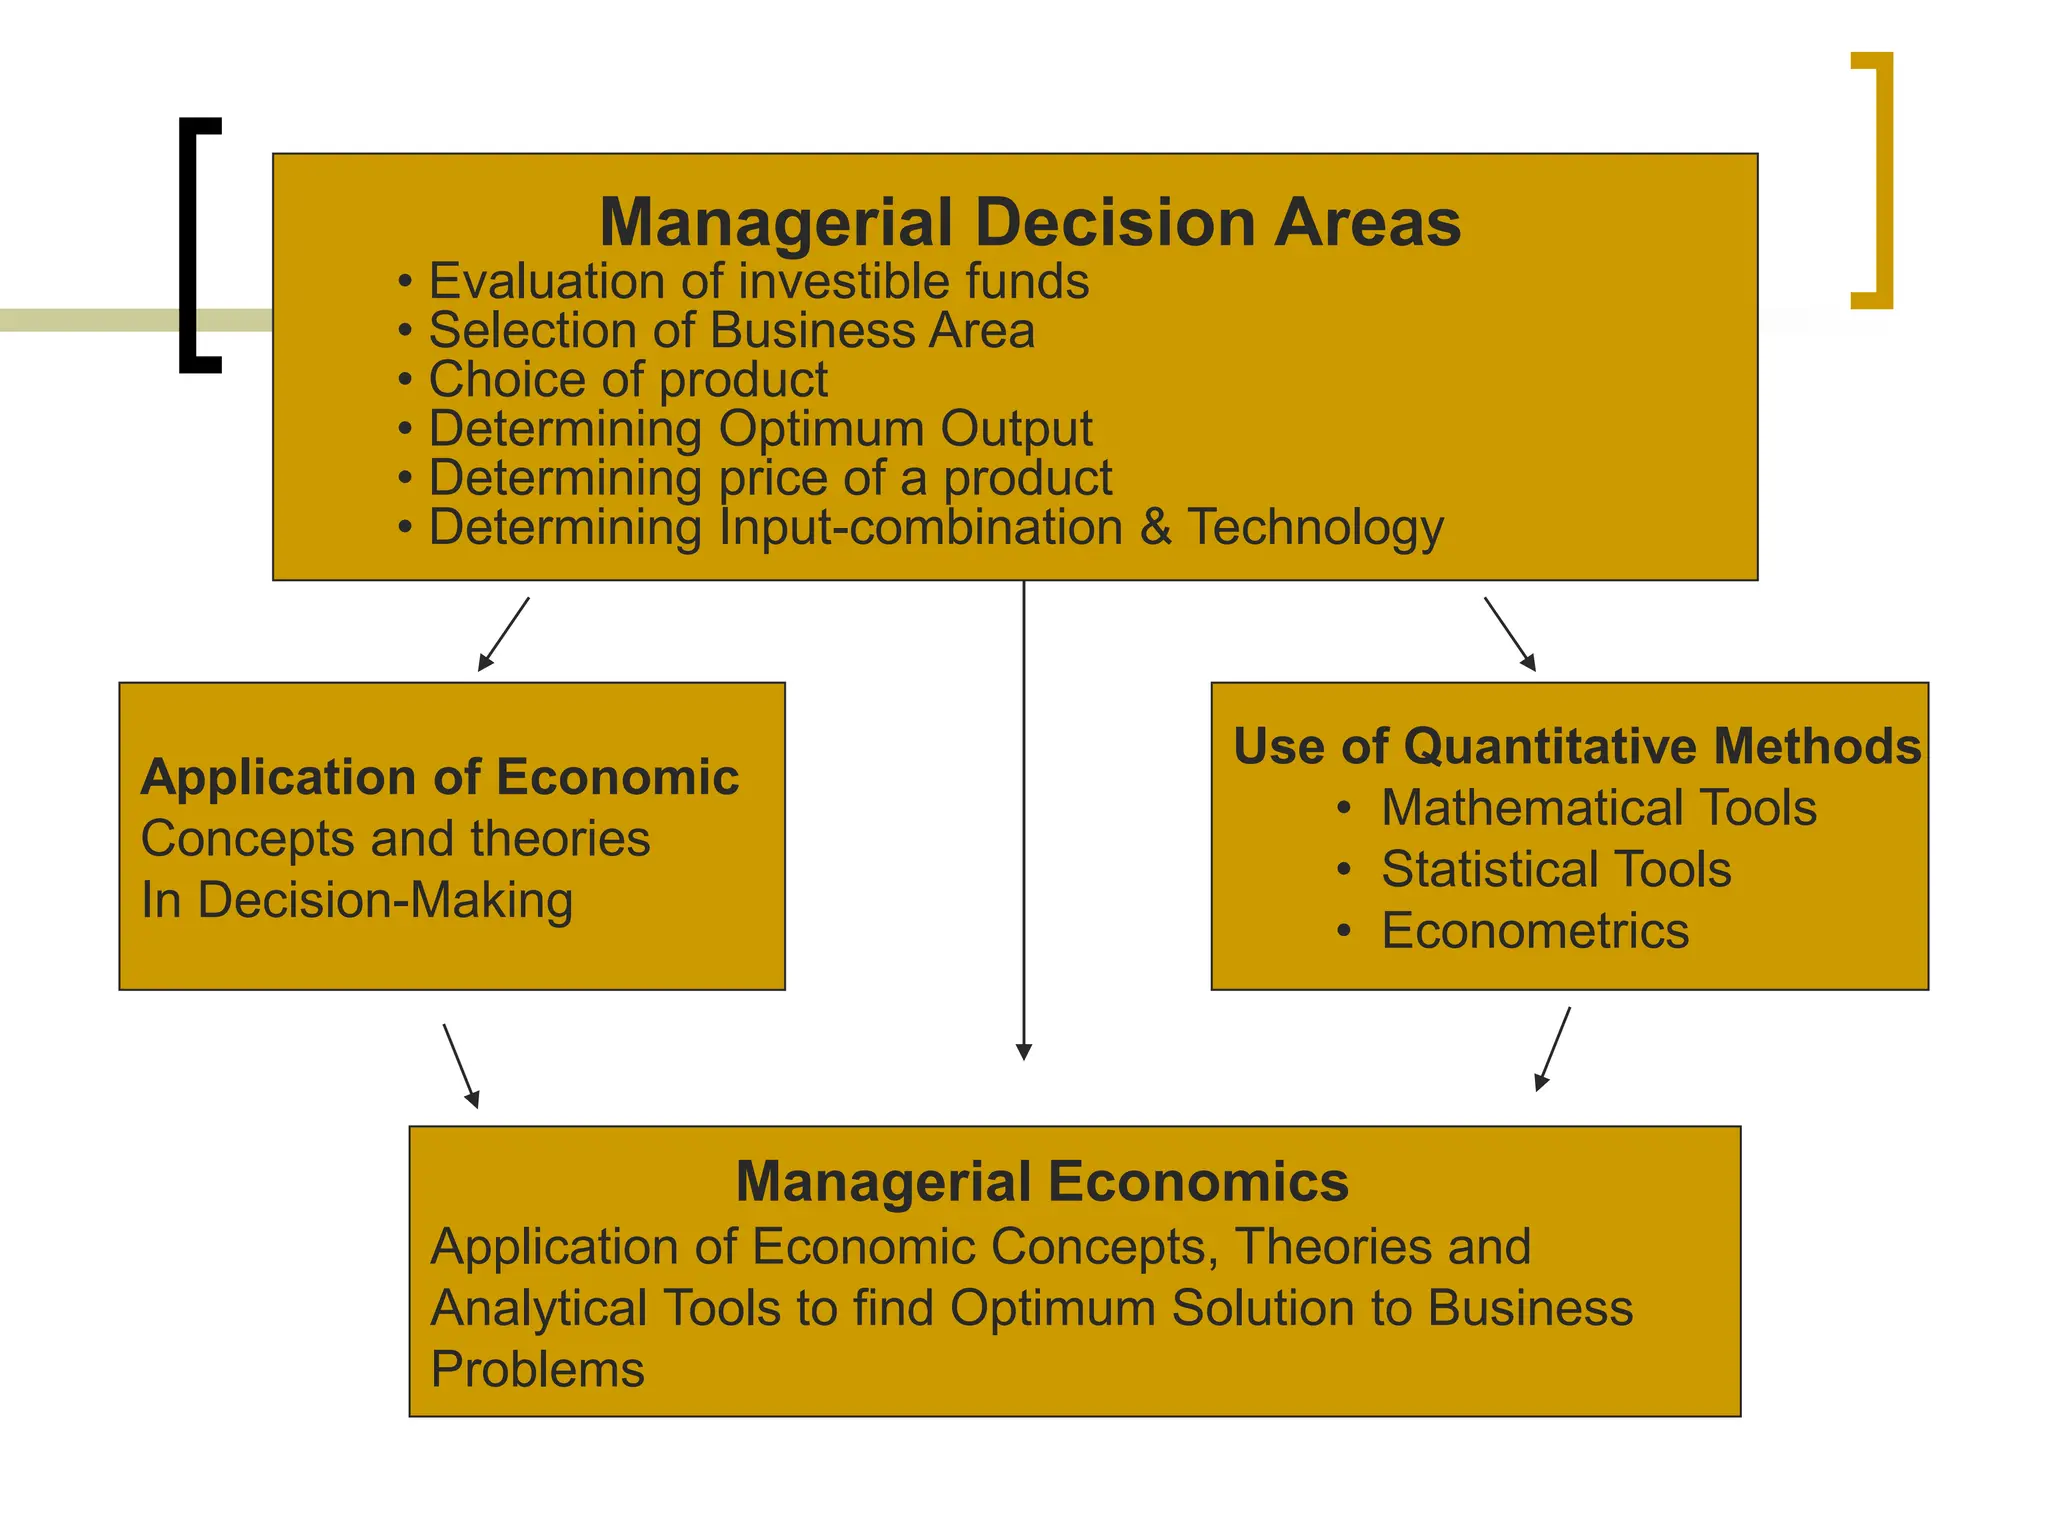
Managerial Decision Areas
• Evaluation of investible funds
• Selection of Business Area
• Choice of product
• Determining Optimum Output
• Determining price of a product
• Determining Input-combination & Technology
Application of Economic
Concepts and theories
In Decision-Making
Use of Quantitative Methods
• Mathematical Tools
• Statistical Tools
• Econometrics
Managerial Economics
Application of Economic Concepts, Theories and
Analytical Tools to find Optimum Solution to Business
Problems
Definitions :
 ME is concerned with the application of
economic concepts and economics to the
problems of formulating rational decision
making. “Mansfield”
 It is the integration of economic theory with
business practice for the purpose of facilitating
decision making and forward planning by
management. “Spencer and Seigelman”
Nature of ME
 Economics has two major branches:
 Microeconomics: It is defined as that branch where the unit
of study is an individual, firm or household.
 It studies how individual make their choices about what to
produce, how to produce, and for whom to produce, and what
price to charge.
 It is also known as the price theory and is the main source of
concepts and analytical tools for managerial decision making.
 Various micro-economic concepts such as demand, supply,
elasticity of demand and supply, marginal cost, various market
forms, etc. are of great significance to managerial economics.
 The internal issues are;
 What to produce
 How much to produce
 Choice of technology
 Choice of price
 How to promote sale
 How to face price competition
 How to decide on new investment
 How to manage profit and capital
 How to manage inventory
Microeconomic theories deal with most of these
Ques
Microeconomics Applied to Operational
or Internal Issues
Nature of ME (Cont’d)
 Macroeconomics: It’s not only individuals and firms that are
faced with having to make choices.
 Governments face many such problems.
 For e.g. How much to spend on health?
 How much to spend on services?
 How much should go in to providing social security benefits?
This is the same type of problem faced by all of us in our daily
lives but in different scales. It studies the economics as a
whole.
 It is aggregative in character and takes the entire economy as
a unit of study. Macro economics helps in the area of
forecasting. It includes National Income, aggregate
consumption, investments, employment etc.
Scope of ME
 Demand Analysis and Forecasting
 Production Function
 Cost analysis
 Inventory Management
 Advertising
 Pricing system
 Resource allocation
Basic Economic Tools
 The basic mathematical tools used in
economic analysis are;
 Functional Relationship
 Concept of Slope & its application
 Elementary differential Calculus
 Optimization Techniques
 Regression Analysis
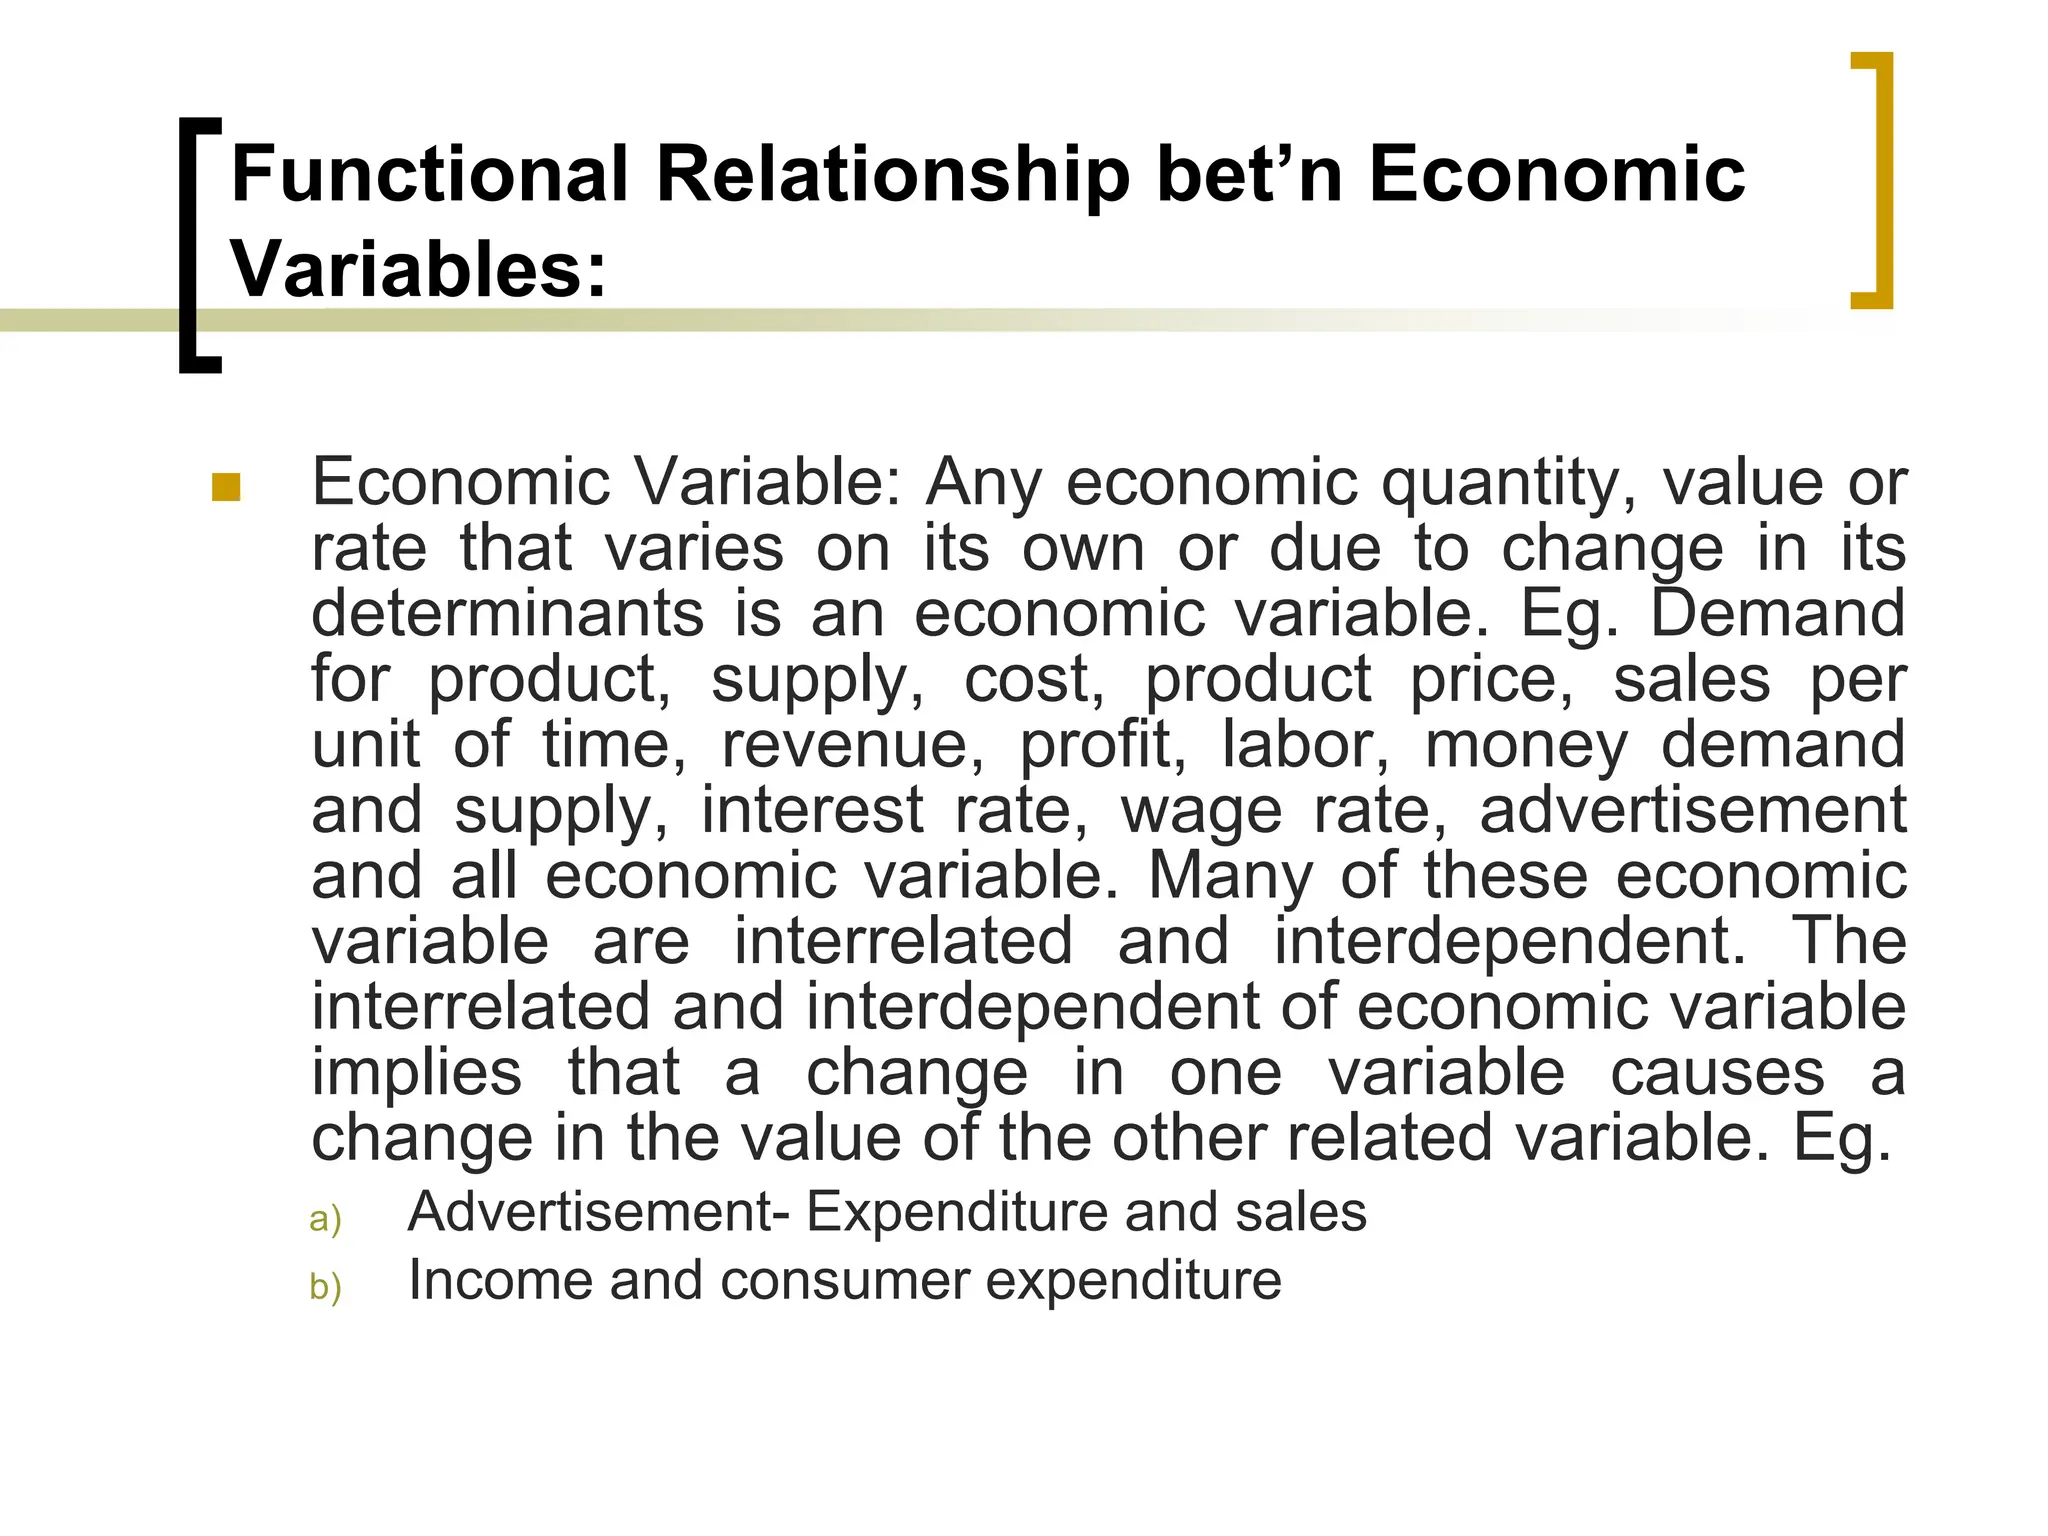
Functional Relationship bet’n Economic
Variables:
 Economic Variable: Any economic quantity, value or
rate that varies on its own or due to change in its
determinants is an economic variable. Eg. Demand
for product, supply, cost, product price, sales per
unit of time, revenue, profit, labor, money demand
and supply, interest rate, wage rate, advertisement
and all economic variable. Many of these economic
variable are interrelated and interdependent. The
interrelated and interdependent of economic variable
implies that a change in one variable causes a
change in the value of the other related variable. Eg.
a) Advertisement- Expenditure and sales
b) Income and consumer expenditure
Dependent & Independent Variable:
 A variable whose value depend on the value of
other variable is called Dependent or Endogenous
Variable. These are also called ‘controlled’ variable.
 An independent variable is one whose value
changes on its own or is assumed to change due to
certain exogenous or external factors. Eg. Price of
petrol depends on increase in import oil price.
Domestic oil price is dependent & international oil
price is independent variable. These are also
known as ‘uncontrolled’ variable.
Concept of Functions:
 As we know that most of the economic
var. are interrelated and interdependent.
In most cases, economic var. have cause
and effect relationship. The relationship
between any two or more variable can be
expressed in a tabular, a graphical and in
a functional form.
Eg. Relation between price and no. of Pizza
sold:
Pizza Price & its Demand
Price of
Pizza
No. of
Pizza sold
10 00
8 10
6 20
4 30
2 40
00 50 Demand for Pizza
Pizza
Price/
Unit
 Table shows that there is a relationship
between the price of pizza and its quantity
demanded per week. It shows as price of
pizza decreases demand increases. Figure
shows the demand curve. This gives the
law of demand. We can conclude that;
 There is inverse relationship between the pizza
price and demand for it &
 For each fall in price of pizza by Rs. 2, quantity
demanded increases by Rs.10.
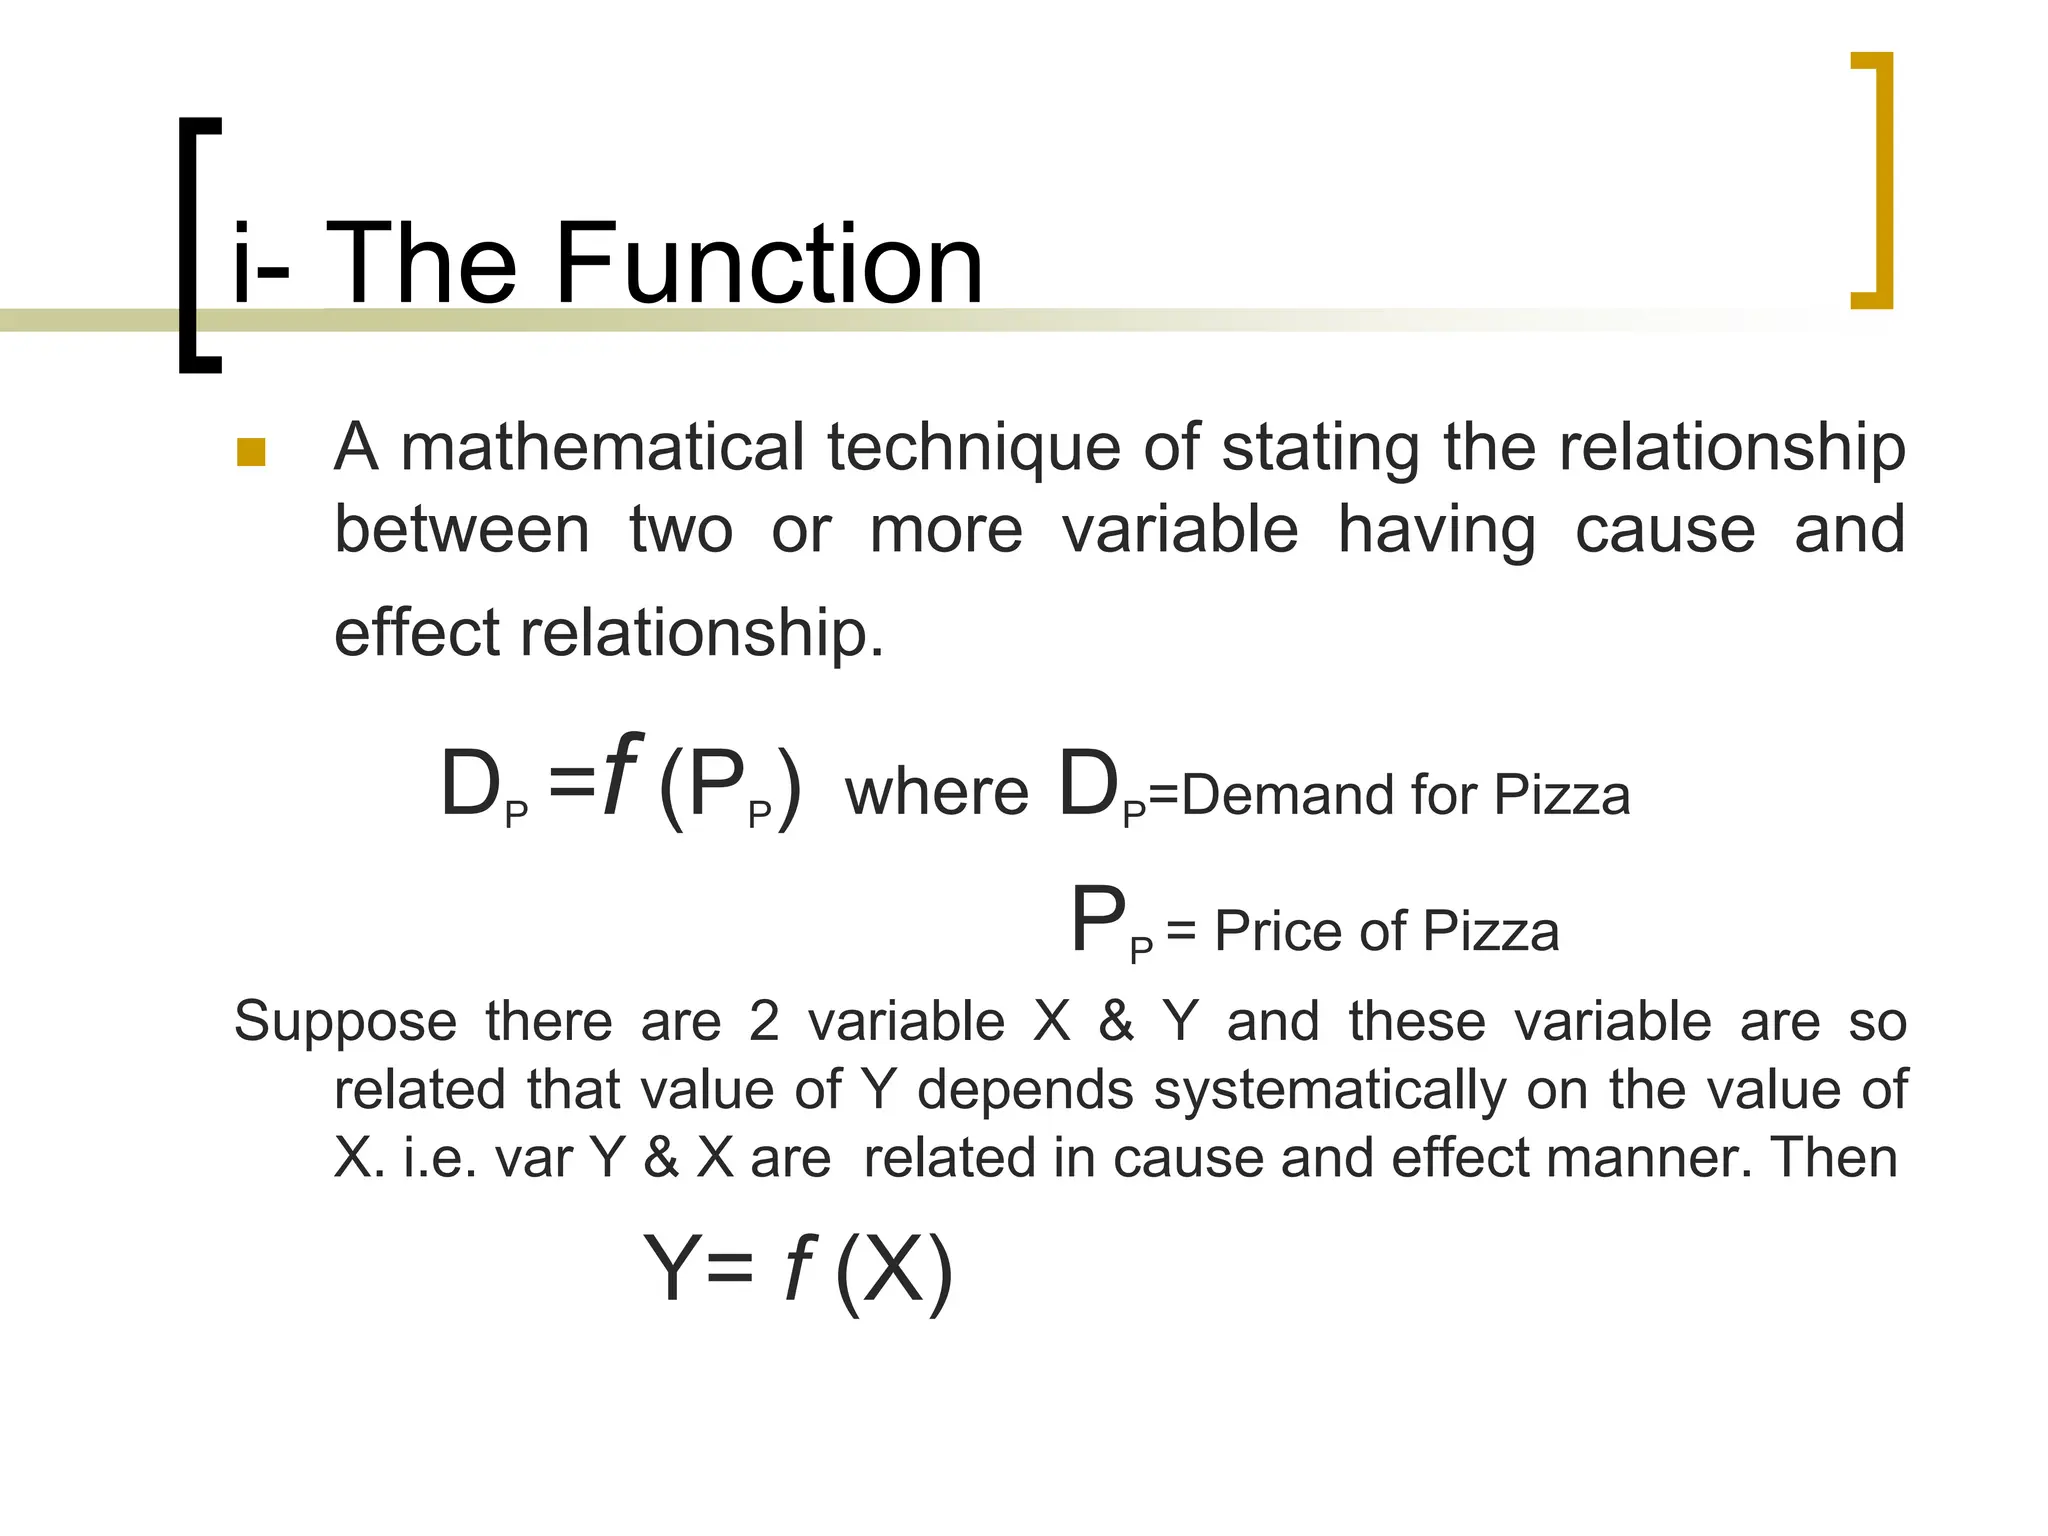
i- The Function
 A mathematical technique of stating the relationship
between two or more variable having cause and
effect relationship.
DP =f (PP) where DP=Demand for Pizza
PP = Price of Pizza
Suppose there are 2 variable X & Y and these variable are so
related that value of Y depends systematically on the value of
X. i.e. var Y & X are related in cause and effect manner. Then
Y= f (X)
 The above relationship shows that the
variable are related to each other. But
fails to reveal that:
i- Nature of relationship.
ii- Quantitative measure of relationship or
the degree of relationship.
ii- Concept of Slope and its uses
 Def.: The rate of change in the dependent
variable as a result of a change in the
independent variable.
The slope of a line or the curve shows
how strongly or weekly are the two variable
related. The steeper the curve or line, the
weaker the relationship and the flatter the
curve or line it shows stronger relationship.
Concept of Slope and its uses (Contd)
 With respect to demand curve, slope is the
ratio of change in the dependent variable
(D) to the change in the independent
variable (P). The movement down the
demand curve or the demand curve gives
the decrease in price (-ΔP) & the
consequent increase in demand (ΔD). The
ratio (-ΔP/ ΔD) gives the slope of the
demand curve.
iii- Differential Calculus
It is applied to analyze and to
find the solution to the wide range of
economic problems and to business
decision-making, especially where
an analyst or business decision-
maker has to find an optimum
solution to a problem.
It provides a technique of
measuring the marginal change in
the dependent variable (Y) due to a
change in the independent variable
(X) when the change in X
approaches zero. The measure of
such a change is called derivatives.
Mathematically
X
Y
X
Y
Y


 
 0
lim


iv- Optimization Techniques
 It is the technique of finding the value
of the independent variable that
maximizes or minimizes the value of
the dependent variable. Eg. Simplex
method, transportation problem,
assignment problem, replacement
problem etc.
v- Regression Technique
 It is used to quantify the relationship
between two or more economic
variable. Regression is used to
estimate the nature & extent of the
relationship between two or more
related variables. It is used to study
the cause & effect relationship
between the variables.
Some Basic Principles:
 Opportunity cost Principles,
 Incremental Principles,
 Principle of Time Perspective,
 Discounting Principle
Opportunity Cost Principle
 Opportunity cost of a decision is the sacrifice of alternatives required
by that decision. If there are no sacrifices, there is no cost.
 According to Opportunity cost principle, a firm can hire a factor of
production if and only if that factor earns a reward in that
occupation/job equal or greater than it’s opportunity cost. Opportunity
cost is the minimum price that would be necessary to retain a factor-
service in it’s given use. It is also defined as the cost of sacrificed
alternatives.
 Decisions involving opportunity cost includes; Make or buy;
Breakdown or preventive maintenance of machines; replacement or
new investment decision; direct recruitment from outside or
Departmental promotion.
 For instance, a person chooses to forgo (give-up) his present
profitable job which offers him Rs.50000 per month, and organizes his
own business. The opportunity lost (earning Rs. 50,000) will be the
opportunity cost of running his own business.
Marginal and Incremental Principle
 This principle states that a decision is said to be balanced and
sound if the firm’s objective is of profit maximization, it leads to
increase in profit, which is in either of two scenarios-
 If total revenue increases more than total cost.
 If total revenue declines less than total cost.
Marginal generally refers to small changes. Marginal analysis implies
judging the impact of a unit change in one variable on the other.
Marginal revenue is the change in total revenue per unit change
in output sold. Marginal cost refers to change in total costs per
unit change in output produced (While incremental cost refers to
change in total costs due to change in total output). The decision
of a firm to change the price would depend upon the resulting
impact/change in marginal revenue and marginal cost. If the
marginal revenue is greater than the marginal cost, then the firm
should bring about the change in price.
Principle of Time Perspective
 According to this principle, a manger/decision maker should
give due emphasis, both to short-term and long-term impact of
his decisions, giving apt significance to the different time
periods before reaching any decision. Short-run refers to a
time period in which some factors are fixed while others are
variable. The production can be increased by increasing the
quantity of variable factors. While long-run is a time period in
which all factors of production can become variable. Entry and
exit of seller firms can take place easily. From consumers
point of view, short-run refers to a period in which they
respond to the changes in price, given the taste and
preferences of the consumers, while long-run is a time period
in which the consumers have enough time to respond to price
changes by varying their tastes and preferences.
Discounting Principle
 Discounting is both a concept as well as technique from
accountancy.
 According to this principle, if a decision affects costs and
revenues in long-run, all those costs and revenues must be
discounted to present values. This is essential because a
rupee worth of money at a future date is not worth a rupee
today. Money actually has time value. Discounting can be
defined as a process used to transform future Rupee into an
equivalent number of present Rupee. For instance, Rs1000
invested today at 10% interest is equivalent to Rs1100 next
year.
FV = PV*(1+r)t ; where,
FV is the future value (time at some future time),
PV is the present value (r is the discount (interest) rate, and
t is the time between the future value and present value.
Role of managerial Economists:
 A managerial economist can play a very important role by
assisting the Management in using the increasingly specialized
skills and sophisticated techniques which are required to solve
the difficult problems of successful decision-making and forward
planning. That is why, in business concerns, his importance is
being growingly recognized.
1- Pricing: Managerial economists assists businesses in determining
pricing strategies and appropriate pricing levels for their products
and services. Some common analysis methods are price
discrimination, value-based pricing and cost-plus pricing.
2- Elastic vs. Inelastic Goods: Economists can determine price
sensitivity of products through a price elasticity analysis. Some
products, such as milk, are consider a necessity rather than a
luxury and will purchase at most price points. This type of product
is considered inelastic. When a business knows they are selling
an inelastic good, they can make marketing and pricing decisions
easier.
Role of managerial Economists (Cont’d)
3- Operations and Production: Managerial economists uses
quantitative methods to analyze production and operational
efficiency through schedule optimization, economies of scale
and resource analyses. Additional analysis methods include
marginal cost, marginal revenue and operating leverage.
Through tweaking the operations and production of a
company, profits rise as costs decline.
4- Risk: Uncertainty exits in every business and managerial
economists can help reduce risk through uncertainty model
analysis and decision-theory analysis. Heavy use of statistical
probability theory helps provide potential scenarios for
businesses to use when making decisions.
Responsibilities:
1- To maximize profit: Since the most important objective of a
firm is to maximize profits on investment, the managerial
economist must also help in achieving this goal.
2- Accurate Forecast: The most important responsibility of a
managerial economist is to make as accurate forecasts as
possible.
3- To maintain Contacts: He should be capable enough to
establish and maintain contacts with individual & data Sources
4- To Inform Mgt: He helps management in informing about
economic trends.
5- Ability: A managerial economist caliber is generally judged by
his ability to obtain necessary information quickly by personal
contacts.
Demand Analysis & Forecasting
 Demand reflects the size and the pattern of market.
Business activity is always market-determined. The
manufacturers encouragement to invest in a given
line of production is limited by the size of market.
 Demand for output and input; the demand for the firm
and the industry; the demand by the consumer and
stockiest; and similar other demand concepts
become therefore, relevant for managerial decision
analysis. Even if the firm pursues objectives
alternative to profit-maximization, demand concepts
still remain relevant
Concept of Demand
 ‘Demand’ is a technical concept from Economics. Demand for
product is:
• Desires to acquire it,
• Willingness to pay for it, and
• Ability to pay for it.
 For example : A poor man’s desires to stay in a five-star hotel
room and his willingness to pay rent for that room is not
‘demand’, because he lacks the necessary purchasing power;
so it is his wishful thinking. Similarly, a miser’s desire for and
his ability to pay for a car is not ‘demand’, because he does
not have the necessary willingness to pay for a car.
 One may also come across a well-established person who
processes both the willingness and the ability to pay for higher
education.
Demand Function and Demand Curve
 Demand function is a comprehensive formulation which
specifies the factors that influence the demand for the product.
What can be those factors which affect the demand? For
example,
 Dx = D (Px, Py, Pz, B, W, A, E, T, U)
 Dx is demand for item x (say, a car)
 PX, its own price (of the car)
 Py, the price of its substitutes (other brands/models)
 Pz, the price of its complements (like petrol)
 B, the income (budget) of the purchaser (user/consumer)
 W, the wealth of the purchaser
 A, the advertisement for the product (car)
 E, the price expectation of the user
 T, taste or preferences of user
 U, all other factors.
Factors Influencing Demand Curve
1- Price of close substitute & complements: If the
price of a substitute falls, then consumer will shift
towards its substitute, creating a fall in the demand
for the concerned good. Ex. Tea & Coffee
In case of complementary items such as butter &
Bread. If the price of butter increases the demand
of butter as well as demand of bread decreases.
2- Change in taste & preferences: In this case
demand curve shift leftwards.
Factors…. (cont’d)
3- Income of the consumer: As the income of the
consumer rises, the buying potential tends to rise &
the consumer will buy more of the same good.
Demand curve shift upward.
4- Existing wealth of the consumer: If the existing
wealth of the consumer such as bonds, stocks, real
estate, gold etc. permits him to make a purchase
the demand curve may shift rightward.
5- Population: If pop’l of a town increases its demand
for housing will also increases.
6- Expectations regarding future price change:
If the consumer expects a price fall in the
near future he may curtail his present
purchase. Ex Gold Edible oil etc.
7- Special Influences: Ex Woolen garments,
Helmets.
Elasticity:
 Elasticity: The tendency to return to its original
shape after it is stretched or compressed.
 Elasticity of Demand: From the law of demand we
know that when the price of a good increases, the
quantity demanded falls, oter things remaining
same. It gives the direction of change in demand for
a given change in price. If we know the magnitude
of the change it will be helpful in our decision
making. It also helps us in forecasting market
trends for the future.
Price Elasticity of Demand:
 To know the response of the quantity demanded to
change in price, we measure the Price Elasticity
of Demand.
Def: It is defined as the percentage change in quantity
demanded resulting from one % change in the price
of the good, other things remaining constant.
ep= %age change in quantity demanded / %age change in price
If the quantity demanded decreases when the price
increases then the ratio is negative. Usually price
elasticity of demand is +ive.
Price Elasticity of Demand (cont’d)…
Denoting elasticity by e, we have
e= ΔQ /ΔP÷ Q/P
Where ΔQ is small change in quantity
ΔP is small change in price
Pis the Original Price &
Q is Original quantity of good
Ex: If the rail fare are increases by 6% & the
demand for rail travel decreases by 2%.
Price elasticity of demand for rail fare is -
2%/ 6%= 0.33
Elasticity
Price (Rs)
Quantity Demanded
D
10
5 20
Producer decides to reduce price to increase sales
7
% Δ in Price = - 30%
% Δ in Demand = + 300%
Ped = - 10 (Elastic)
Total Revenue rises
Good Move!
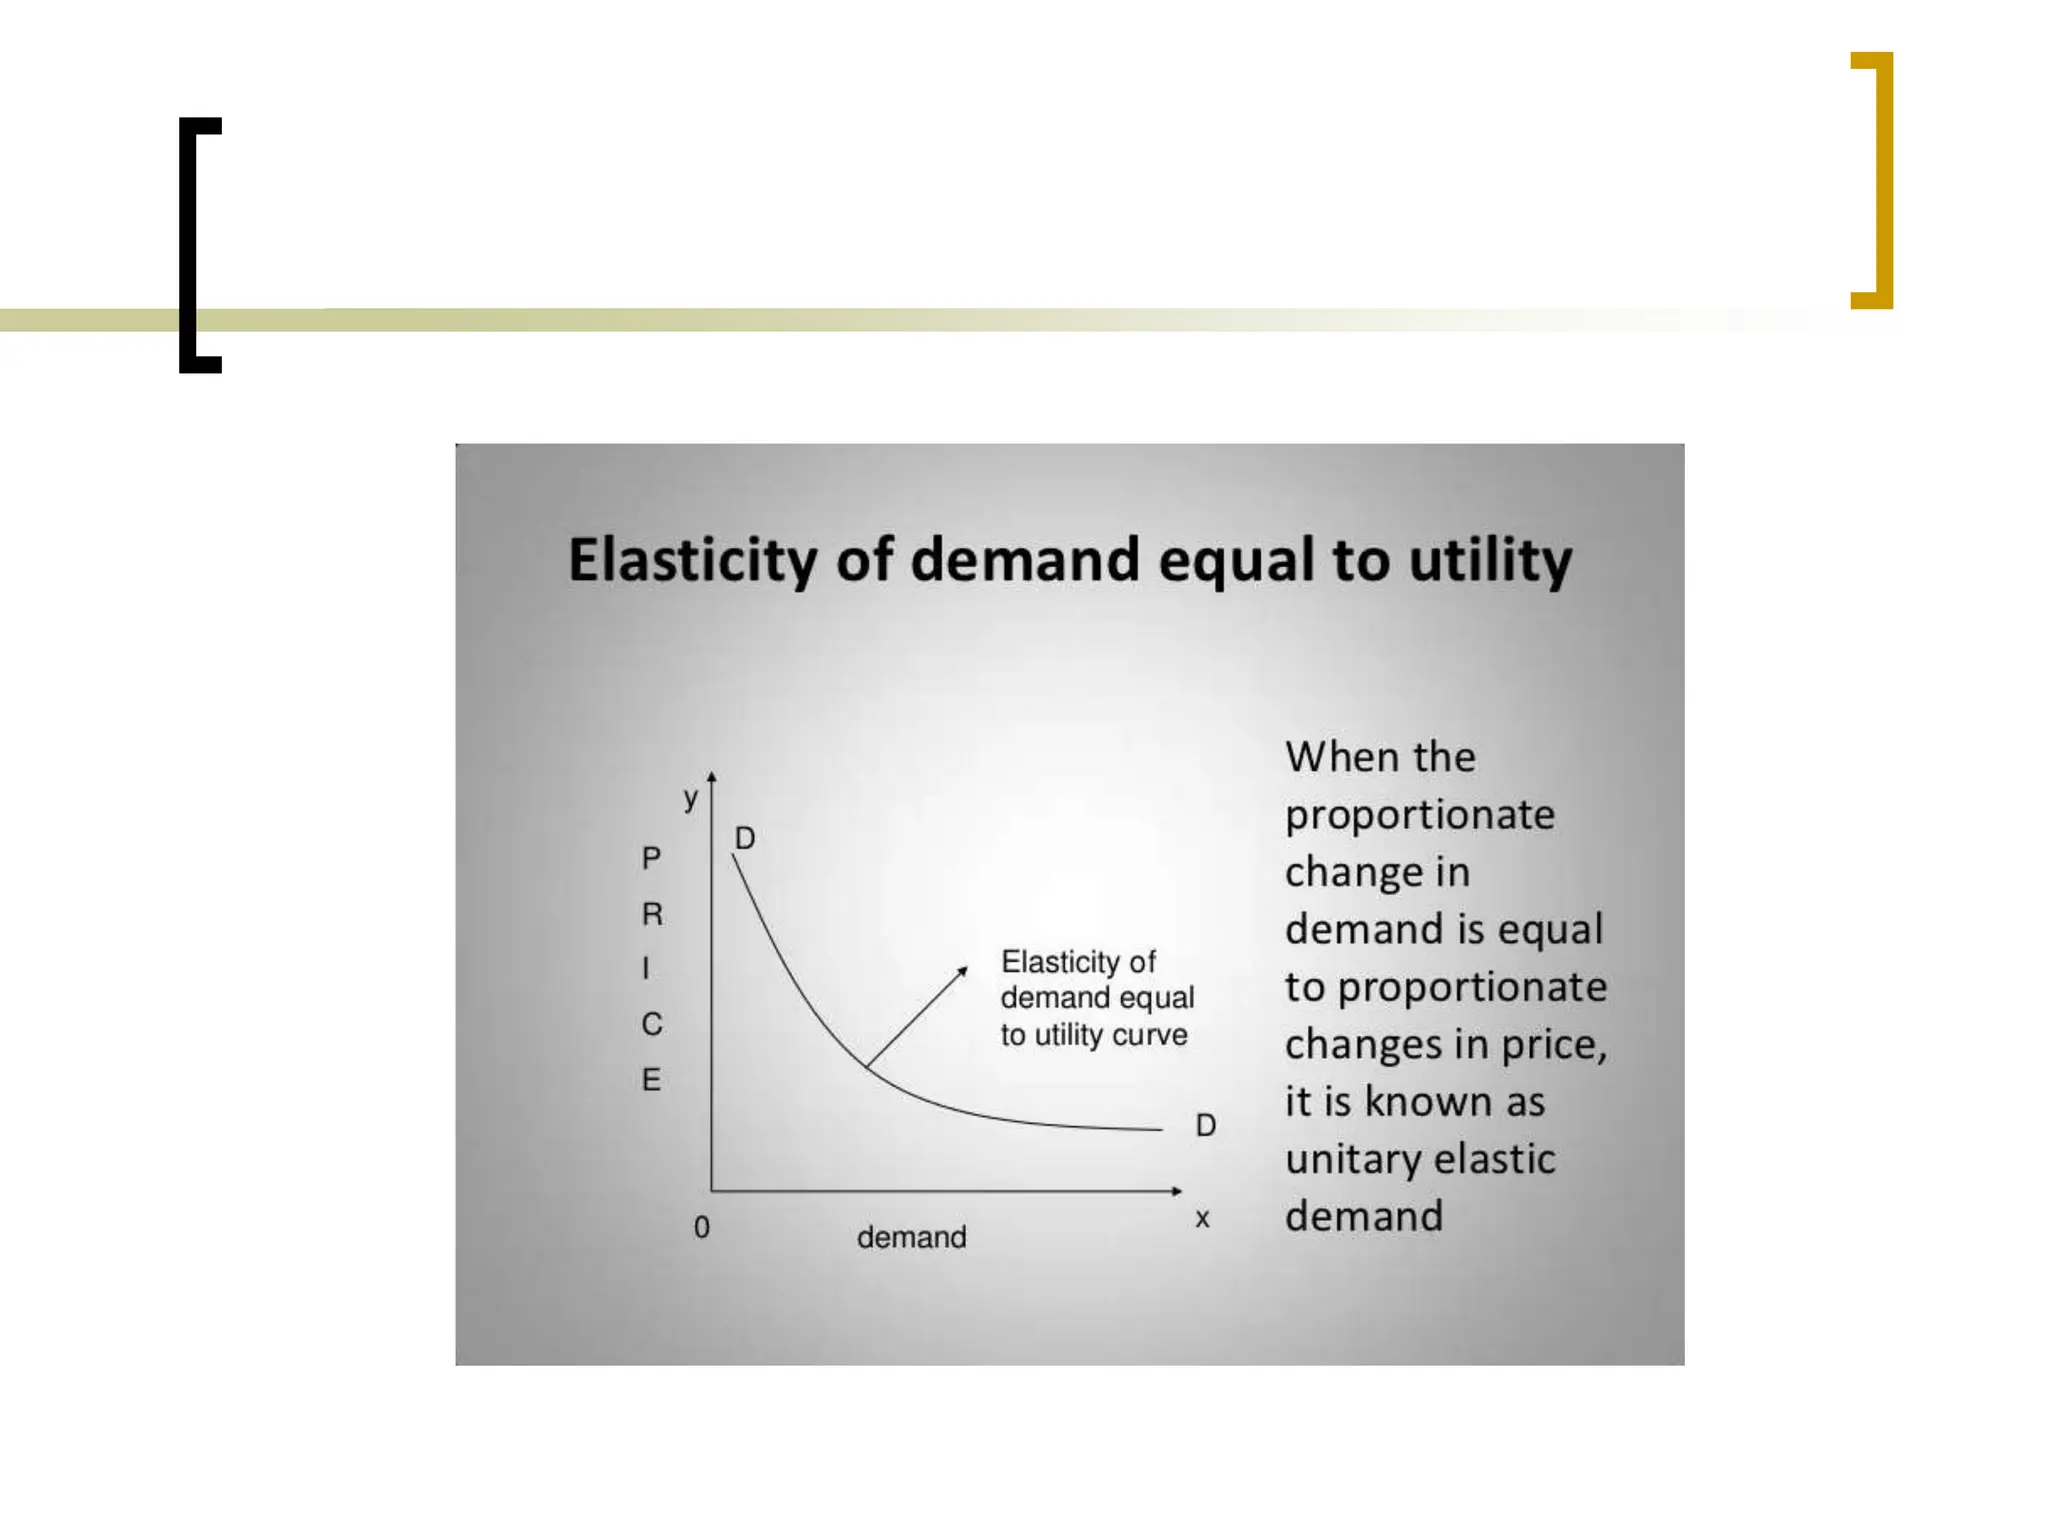
Kinds of Price Elasticity of demand
Income Elasticity of
Demand:
 The responsiveness of demand
to changes in incomes
 Normal Good – demand rises
as income rises and vice versa.
 Inferior Good – demand falls
as income rises and vice versa
Income Elasticity of
Demand:
 A positive sign denotes a normal good
 A negative sign denotes an inferior good
 For example:
 Yed = - 0.6: Good is an inferior good but inelastic – a rise in
income of 3% would lead to demand falling by 1.8%
 Yed = + 0.4: Good is a normal good but inelastic –
a rise in incomes of 3% would lead to demand rising by 1.2%
 Yed = + 1.6: Good is a normal good and elastic –
a rise in incomes of 3% would lead to demand rising by 4.8%
 Yed = - 2.1: Good is an inferior good and elastic –
a rise in incomes of 3% would lead to a fall in demand of 6.3%
Advertising Elasticity of Demand
Thank You
I may be reached at
drjayantdubey@gmail.com

More Related Content

Similar to Managerial Economics Unit -I ppt For MBA

Economics for entrepreneurs
Economics for entrepreneurs Economics for entrepreneurs
Economics for entrepreneurs
Dr. Trilok Kumar Jain
 
Mathematics for economics
Mathematics for economicsMathematics for economics
Mathematics for economics
8891743524
 
Introduction to me siom
Introduction to me siomIntroduction to me siom
Introduction to me siom
ishwarijoshi
 
Managerial Economics Lecture 1 07
Managerial Economics Lecture 1 07Managerial Economics Lecture 1 07
Managerial Economics Lecture 1 07
Asad Jilani
 
Lecture 1 07
Lecture 1 07Lecture 1 07
Lecture 1 07
Asad Jilani
 
Mb0042 managerial economics
Mb0042  managerial economicsMb0042  managerial economics
Mb0042 managerial economics
smumbahelp
 
Introduction to Managerial Economics-Yuvaraja SE
Introduction to Managerial Economics-Yuvaraja SEIntroduction to Managerial Economics-Yuvaraja SE
Introduction to Managerial Economics-Yuvaraja SE
Yuva Raja S E
 
3eb1565b-7400-45ad-9255-f1329e1b1c32.pptx
3eb1565b-7400-45ad-9255-f1329e1b1c32.pptx3eb1565b-7400-45ad-9255-f1329e1b1c32.pptx
3eb1565b-7400-45ad-9255-f1329e1b1c32.pptx
redminoteproplus795
 
Chapter 1.pptx
Chapter 1.pptxChapter 1.pptx
Chapter 1.pptx
Sanjay Joshi
 
Demand & Supply Analysis (1).pptx
Demand & Supply Analysis (1).pptxDemand & Supply Analysis (1).pptx
Demand & Supply Analysis (1).pptx
kalyanikamineni
 
Basic Economics.pdf
Basic Economics.pdfBasic Economics.pdf
Basic Economics.pdf
TariqulIslamTareq4
 
Basic Economics.pdf
Basic Economics.pdfBasic Economics.pdf
Basic Economics.pdf
TariqulIslamTareq4
 
Economics 1.216181522
Economics 1.216181522Economics 1.216181522
Economics 1.216181522
premrings
 
Mba 2
Mba 2Mba 2
Economics as a tool for decision making
Economics as a tool for decision makingEconomics as a tool for decision making
Economics as a tool for decision making
vivek Thota
 
1.introduction
1.introduction1.introduction
1.introduction
Regmi Milan
 
101
101101
101
101101
Economics bhawani nandanprasad
Economics   bhawani nandanprasadEconomics   bhawani nandanprasad
Economics bhawani nandanprasad
Bhawani N Prasad
 
Concepts in economics
Concepts in economicsConcepts in economics
Concepts in economics
Sandy Karkera
 

Similar to Managerial Economics Unit -I ppt For MBA (20)

Economics for entrepreneurs
Economics for entrepreneurs Economics for entrepreneurs
Economics for entrepreneurs
 
Mathematics for economics
Mathematics for economicsMathematics for economics
Mathematics for economics
 
Introduction to me siom
Introduction to me siomIntroduction to me siom
Introduction to me siom
 
Managerial Economics Lecture 1 07
Managerial Economics Lecture 1 07Managerial Economics Lecture 1 07
Managerial Economics Lecture 1 07
 
Lecture 1 07
Lecture 1 07Lecture 1 07
Lecture 1 07
 
Mb0042 managerial economics
Mb0042  managerial economicsMb0042  managerial economics
Mb0042 managerial economics
 
Introduction to Managerial Economics-Yuvaraja SE
Introduction to Managerial Economics-Yuvaraja SEIntroduction to Managerial Economics-Yuvaraja SE
Introduction to Managerial Economics-Yuvaraja SE
 
3eb1565b-7400-45ad-9255-f1329e1b1c32.pptx
3eb1565b-7400-45ad-9255-f1329e1b1c32.pptx3eb1565b-7400-45ad-9255-f1329e1b1c32.pptx
3eb1565b-7400-45ad-9255-f1329e1b1c32.pptx
 
Chapter 1.pptx
Chapter 1.pptxChapter 1.pptx
Chapter 1.pptx
 
Demand & Supply Analysis (1).pptx
Demand & Supply Analysis (1).pptxDemand & Supply Analysis (1).pptx
Demand & Supply Analysis (1).pptx
 
Basic Economics.pdf
Basic Economics.pdfBasic Economics.pdf
Basic Economics.pdf
 
Basic Economics.pdf
Basic Economics.pdfBasic Economics.pdf
Basic Economics.pdf
 
Economics 1.216181522
Economics 1.216181522Economics 1.216181522
Economics 1.216181522
 
Mba 2
Mba 2Mba 2
Mba 2
 
Economics as a tool for decision making
Economics as a tool for decision makingEconomics as a tool for decision making
Economics as a tool for decision making
 
1.introduction
1.introduction1.introduction
1.introduction
 
101
101101
101
 
101
101101
101
 
Economics bhawani nandanprasad
Economics   bhawani nandanprasadEconomics   bhawani nandanprasad
Economics bhawani nandanprasad
 
Concepts in economics
Concepts in economicsConcepts in economics
Concepts in economics
 

Recently uploaded

Smart-Money for SMC traders good time and ICT
Smart-Money for SMC traders good time and ICTSmart-Money for SMC traders good time and ICT
Smart-Money for SMC traders good time and ICT
simonomuemu
 
Cognitive Development Adolescence Psychology
Cognitive Development Adolescence PsychologyCognitive Development Adolescence Psychology
Cognitive Development Adolescence Psychology
paigestewart1632
 
C1 Rubenstein AP HuG xxxxxxxxxxxxxx.pptx
C1 Rubenstein AP HuG xxxxxxxxxxxxxx.pptxC1 Rubenstein AP HuG xxxxxxxxxxxxxx.pptx
C1 Rubenstein AP HuG xxxxxxxxxxxxxx.pptx
mulvey2
 
How to Setup Warehouse & Location in Odoo 17 Inventory
How to Setup Warehouse & Location in Odoo 17 InventoryHow to Setup Warehouse & Location in Odoo 17 Inventory
How to Setup Warehouse & Location in Odoo 17 Inventory
Celine George
 
PIMS Job Advertisement 2024.pdf Islamabad
PIMS Job Advertisement 2024.pdf IslamabadPIMS Job Advertisement 2024.pdf Islamabad
PIMS Job Advertisement 2024.pdf Islamabad
AyyanKhan40
 
Liberal Approach to the Study of Indian Politics.pdf
Liberal Approach to the Study of Indian Politics.pdfLiberal Approach to the Study of Indian Politics.pdf
Liberal Approach to the Study of Indian Politics.pdf
WaniBasim
 
Executive Directors Chat Leveraging AI for Diversity, Equity, and Inclusion
Executive Directors Chat  Leveraging AI for Diversity, Equity, and InclusionExecutive Directors Chat  Leveraging AI for Diversity, Equity, and Inclusion
Executive Directors Chat Leveraging AI for Diversity, Equity, and Inclusion
TechSoup
 
Hindi varnamala | hindi alphabet PPT.pdf
Hindi varnamala | hindi alphabet PPT.pdfHindi varnamala | hindi alphabet PPT.pdf
Hindi varnamala | hindi alphabet PPT.pdf
Dr. Mulla Adam Ali
 
How to Add Chatter in the odoo 17 ERP Module
How to Add Chatter in the odoo 17 ERP ModuleHow to Add Chatter in the odoo 17 ERP Module
How to Add Chatter in the odoo 17 ERP Module
Celine George
 
S1-Introduction-Biopesticides in ICM.pptx
S1-Introduction-Biopesticides in ICM.pptxS1-Introduction-Biopesticides in ICM.pptx
S1-Introduction-Biopesticides in ICM.pptx
tarandeep35
 
Natural birth techniques - Mrs.Akanksha Trivedi Rama University
Natural birth techniques - Mrs.Akanksha Trivedi Rama UniversityNatural birth techniques - Mrs.Akanksha Trivedi Rama University
Natural birth techniques - Mrs.Akanksha Trivedi Rama University
Akanksha trivedi rama nursing college kanpur.
 
ISO/IEC 27001, ISO/IEC 42001, and GDPR: Best Practices for Implementation and...
ISO/IEC 27001, ISO/IEC 42001, and GDPR: Best Practices for Implementation and...ISO/IEC 27001, ISO/IEC 42001, and GDPR: Best Practices for Implementation and...
ISO/IEC 27001, ISO/IEC 42001, and GDPR: Best Practices for Implementation and...
PECB
 
PCOS corelations and management through Ayurveda.
PCOS corelations and management through Ayurveda.PCOS corelations and management through Ayurveda.
PCOS corelations and management through Ayurveda.
Dr. Shivangi Singh Parihar
 
LAND USE LAND COVER AND NDVI OF MIRZAPUR DISTRICT, UP
LAND USE LAND COVER AND NDVI OF MIRZAPUR DISTRICT, UPLAND USE LAND COVER AND NDVI OF MIRZAPUR DISTRICT, UP
LAND USE LAND COVER AND NDVI OF MIRZAPUR DISTRICT, UP
RAHUL
 
The simplified electron and muon model, Oscillating Spacetime: The Foundation...
The simplified electron and muon model, Oscillating Spacetime: The Foundation...The simplified electron and muon model, Oscillating Spacetime: The Foundation...
The simplified electron and muon model, Oscillating Spacetime: The Foundation...
RitikBhardwaj56
 
Pollock and Snow "DEIA in the Scholarly Landscape, Session One: Setting Expec...
Pollock and Snow "DEIA in the Scholarly Landscape, Session One: Setting Expec...Pollock and Snow "DEIA in the Scholarly Landscape, Session One: Setting Expec...
Pollock and Snow "DEIA in the Scholarly Landscape, Session One: Setting Expec...
National Information Standards Organization (NISO)
 
Life upper-Intermediate B2 Workbook for student
Life upper-Intermediate B2 Workbook for studentLife upper-Intermediate B2 Workbook for student
Life upper-Intermediate B2 Workbook for student
NgcHiNguyn25
 
Digital Artifact 1 - 10VCD Environments Unit
Digital Artifact 1 - 10VCD Environments UnitDigital Artifact 1 - 10VCD Environments Unit
Digital Artifact 1 - 10VCD Environments Unit
chanes7
 
ANATOMY AND BIOMECHANICS OF HIP JOINT.pdf
ANATOMY AND BIOMECHANICS OF HIP JOINT.pdfANATOMY AND BIOMECHANICS OF HIP JOINT.pdf
ANATOMY AND BIOMECHANICS OF HIP JOINT.pdf
Priyankaranawat4
 
Digital Artefact 1 - Tiny Home Environmental Design
Digital Artefact 1 - Tiny Home Environmental DesignDigital Artefact 1 - Tiny Home Environmental Design
Digital Artefact 1 - Tiny Home Environmental Design
amberjdewit93
 

Recently uploaded (20)

Smart-Money for SMC traders good time and ICT
Smart-Money for SMC traders good time and ICTSmart-Money for SMC traders good time and ICT
Smart-Money for SMC traders good time and ICT
 
Cognitive Development Adolescence Psychology
Cognitive Development Adolescence PsychologyCognitive Development Adolescence Psychology
Cognitive Development Adolescence Psychology
 
C1 Rubenstein AP HuG xxxxxxxxxxxxxx.pptx
C1 Rubenstein AP HuG xxxxxxxxxxxxxx.pptxC1 Rubenstein AP HuG xxxxxxxxxxxxxx.pptx
C1 Rubenstein AP HuG xxxxxxxxxxxxxx.pptx
 
How to Setup Warehouse & Location in Odoo 17 Inventory
How to Setup Warehouse & Location in Odoo 17 InventoryHow to Setup Warehouse & Location in Odoo 17 Inventory
How to Setup Warehouse & Location in Odoo 17 Inventory
 
PIMS Job Advertisement 2024.pdf Islamabad
PIMS Job Advertisement 2024.pdf IslamabadPIMS Job Advertisement 2024.pdf Islamabad
PIMS Job Advertisement 2024.pdf Islamabad
 
Liberal Approach to the Study of Indian Politics.pdf
Liberal Approach to the Study of Indian Politics.pdfLiberal Approach to the Study of Indian Politics.pdf
Liberal Approach to the Study of Indian Politics.pdf
 
Executive Directors Chat Leveraging AI for Diversity, Equity, and Inclusion
Executive Directors Chat  Leveraging AI for Diversity, Equity, and InclusionExecutive Directors Chat  Leveraging AI for Diversity, Equity, and Inclusion
Executive Directors Chat Leveraging AI for Diversity, Equity, and Inclusion
 
Hindi varnamala | hindi alphabet PPT.pdf
Hindi varnamala | hindi alphabet PPT.pdfHindi varnamala | hindi alphabet PPT.pdf
Hindi varnamala | hindi alphabet PPT.pdf
 
How to Add Chatter in the odoo 17 ERP Module
How to Add Chatter in the odoo 17 ERP ModuleHow to Add Chatter in the odoo 17 ERP Module
How to Add Chatter in the odoo 17 ERP Module
 
S1-Introduction-Biopesticides in ICM.pptx
S1-Introduction-Biopesticides in ICM.pptxS1-Introduction-Biopesticides in ICM.pptx
S1-Introduction-Biopesticides in ICM.pptx
 
Natural birth techniques - Mrs.Akanksha Trivedi Rama University
Natural birth techniques - Mrs.Akanksha Trivedi Rama UniversityNatural birth techniques - Mrs.Akanksha Trivedi Rama University
Natural birth techniques - Mrs.Akanksha Trivedi Rama University
 
ISO/IEC 27001, ISO/IEC 42001, and GDPR: Best Practices for Implementation and...
ISO/IEC 27001, ISO/IEC 42001, and GDPR: Best Practices for Implementation and...ISO/IEC 27001, ISO/IEC 42001, and GDPR: Best Practices for Implementation and...
ISO/IEC 27001, ISO/IEC 42001, and GDPR: Best Practices for Implementation and...
 
PCOS corelations and management through Ayurveda.
PCOS corelations and management through Ayurveda.PCOS corelations and management through Ayurveda.
PCOS corelations and management through Ayurveda.
 
LAND USE LAND COVER AND NDVI OF MIRZAPUR DISTRICT, UP
LAND USE LAND COVER AND NDVI OF MIRZAPUR DISTRICT, UPLAND USE LAND COVER AND NDVI OF MIRZAPUR DISTRICT, UP
LAND USE LAND COVER AND NDVI OF MIRZAPUR DISTRICT, UP
 
The simplified electron and muon model, Oscillating Spacetime: The Foundation...
The simplified electron and muon model, Oscillating Spacetime: The Foundation...The simplified electron and muon model, Oscillating Spacetime: The Foundation...
The simplified electron and muon model, Oscillating Spacetime: The Foundation...
 
Pollock and Snow "DEIA in the Scholarly Landscape, Session One: Setting Expec...
Pollock and Snow "DEIA in the Scholarly Landscape, Session One: Setting Expec...Pollock and Snow "DEIA in the Scholarly Landscape, Session One: Setting Expec...
Pollock and Snow "DEIA in the Scholarly Landscape, Session One: Setting Expec...
 
Life upper-Intermediate B2 Workbook for student
Life upper-Intermediate B2 Workbook for studentLife upper-Intermediate B2 Workbook for student
Life upper-Intermediate B2 Workbook for student
 
Digital Artifact 1 - 10VCD Environments Unit
Digital Artifact 1 - 10VCD Environments UnitDigital Artifact 1 - 10VCD Environments Unit
Digital Artifact 1 - 10VCD Environments Unit
 
ANATOMY AND BIOMECHANICS OF HIP JOINT.pdf
ANATOMY AND BIOMECHANICS OF HIP JOINT.pdfANATOMY AND BIOMECHANICS OF HIP JOINT.pdf
ANATOMY AND BIOMECHANICS OF HIP JOINT.pdf
 
Digital Artefact 1 - Tiny Home Environmental Design
Digital Artefact 1 - Tiny Home Environmental DesignDigital Artefact 1 - Tiny Home Environmental Design
Digital Artefact 1 - Tiny Home Environmental Design
 

Managerial Economics Unit -I ppt For MBA

  • 1. MANAGERIAL ECONOMICS DR. JAYANT DUBEY Prof. & Head, Dept. of Business Studies, BTIRT, Sagar
  • 2. M E Syllabus  Nature & scope of managerial economics,  Basic Economic Tools, (Function,  Opportunity Cost Principle, Incremental Principles, Principle of Time Perspective, Discounting Principle.  Role & Responsibilities of Managerial Economist,  Demand Analysis and forecasting.  Price and Demand. Income and Demand.  Price of related goods and demand Advertising and Demand.  Demand forecasting: Methods, purpose and factors involved.
  • 3. Introduction  Upcoming of Managerial Economic is due to three factors;  Complexity in business decision-making  Use of economic concept, theories & tools of economic analysis  Increase in demand for trained managerial manpower.
  • 4. What Economic is?  It is a social science. It studies how people, individual, households, firms etc. maximizes its gains from limited resources. In Economics this maximizing factor is termed as “optimizing behavior”. Ex. Firm produces goods & services.  Economics is a study of the choice-making behavior of the people. In reality choice-making is not simple as it looks because world is very complex & decision is taken under risk and uncertainty.  Analytical tools & techniques, economic laws and theories combined to form the body of economics.
  • 5. Managerial Economics  ME can be defined as the study of economic theories, logic and tools of economic analysis that are used in the process of business decision-making.  Economic theories and techniques of economic analysis are applied to analyze business problems, evaluate business options and opportunities to arrive at an appropriate business decision.
  • 6. Managerial Decision Areas • Evaluation of investible funds • Selection of Business Area • Choice of product • Determining Optimum Output • Determining price of a product • Determining Input-combination & Technology Application of Economic Concepts and theories In Decision-Making Use of Quantitative Methods • Mathematical Tools • Statistical Tools • Econometrics Managerial Economics Application of Economic Concepts, Theories and Analytical Tools to find Optimum Solution to Business Problems
  • 7. Definitions :  ME is concerned with the application of economic concepts and economics to the problems of formulating rational decision making. “Mansfield”  It is the integration of economic theory with business practice for the purpose of facilitating decision making and forward planning by management. “Spencer and Seigelman”
  • 8. Nature of ME  Economics has two major branches:  Microeconomics: It is defined as that branch where the unit of study is an individual, firm or household.  It studies how individual make their choices about what to produce, how to produce, and for whom to produce, and what price to charge.  It is also known as the price theory and is the main source of concepts and analytical tools for managerial decision making.  Various micro-economic concepts such as demand, supply, elasticity of demand and supply, marginal cost, various market forms, etc. are of great significance to managerial economics.
  • 9.  The internal issues are;  What to produce  How much to produce  Choice of technology  Choice of price  How to promote sale  How to face price competition  How to decide on new investment  How to manage profit and capital  How to manage inventory Microeconomic theories deal with most of these Ques Microeconomics Applied to Operational or Internal Issues
  • 10. Nature of ME (Cont’d)  Macroeconomics: It’s not only individuals and firms that are faced with having to make choices.  Governments face many such problems.  For e.g. How much to spend on health?  How much to spend on services?  How much should go in to providing social security benefits? This is the same type of problem faced by all of us in our daily lives but in different scales. It studies the economics as a whole.  It is aggregative in character and takes the entire economy as a unit of study. Macro economics helps in the area of forecasting. It includes National Income, aggregate consumption, investments, employment etc.
  • 11. Scope of ME  Demand Analysis and Forecasting  Production Function  Cost analysis  Inventory Management  Advertising  Pricing system  Resource allocation
  • 12. Basic Economic Tools  The basic mathematical tools used in economic analysis are;  Functional Relationship  Concept of Slope & its application  Elementary differential Calculus  Optimization Techniques  Regression Analysis
  • 13. Functional Relationship bet’n Economic Variables:  Economic Variable: Any economic quantity, value or rate that varies on its own or due to change in its determinants is an economic variable. Eg. Demand for product, supply, cost, product price, sales per unit of time, revenue, profit, labor, money demand and supply, interest rate, wage rate, advertisement and all economic variable. Many of these economic variable are interrelated and interdependent. The interrelated and interdependent of economic variable implies that a change in one variable causes a change in the value of the other related variable. Eg. a) Advertisement- Expenditure and sales b) Income and consumer expenditure
  • 14. Dependent & Independent Variable:  A variable whose value depend on the value of other variable is called Dependent or Endogenous Variable. These are also called ‘controlled’ variable.  An independent variable is one whose value changes on its own or is assumed to change due to certain exogenous or external factors. Eg. Price of petrol depends on increase in import oil price. Domestic oil price is dependent & international oil price is independent variable. These are also known as ‘uncontrolled’ variable.
  • 15. Concept of Functions:  As we know that most of the economic var. are interrelated and interdependent. In most cases, economic var. have cause and effect relationship. The relationship between any two or more variable can be expressed in a tabular, a graphical and in a functional form.
  • 16. Eg. Relation between price and no. of Pizza sold: Pizza Price & its Demand Price of Pizza No. of Pizza sold 10 00 8 10 6 20 4 30 2 40 00 50 Demand for Pizza Pizza Price/ Unit
  • 17.  Table shows that there is a relationship between the price of pizza and its quantity demanded per week. It shows as price of pizza decreases demand increases. Figure shows the demand curve. This gives the law of demand. We can conclude that;  There is inverse relationship between the pizza price and demand for it &  For each fall in price of pizza by Rs. 2, quantity demanded increases by Rs.10.
  • 18. i- The Function  A mathematical technique of stating the relationship between two or more variable having cause and effect relationship. DP =f (PP) where DP=Demand for Pizza PP = Price of Pizza Suppose there are 2 variable X & Y and these variable are so related that value of Y depends systematically on the value of X. i.e. var Y & X are related in cause and effect manner. Then Y= f (X)
  • 19.  The above relationship shows that the variable are related to each other. But fails to reveal that: i- Nature of relationship. ii- Quantitative measure of relationship or the degree of relationship.
  • 20. ii- Concept of Slope and its uses  Def.: The rate of change in the dependent variable as a result of a change in the independent variable. The slope of a line or the curve shows how strongly or weekly are the two variable related. The steeper the curve or line, the weaker the relationship and the flatter the curve or line it shows stronger relationship.
  • 21. Concept of Slope and its uses (Contd)  With respect to demand curve, slope is the ratio of change in the dependent variable (D) to the change in the independent variable (P). The movement down the demand curve or the demand curve gives the decrease in price (-ΔP) & the consequent increase in demand (ΔD). The ratio (-ΔP/ ΔD) gives the slope of the demand curve.
  • 22. iii- Differential Calculus It is applied to analyze and to find the solution to the wide range of economic problems and to business decision-making, especially where an analyst or business decision- maker has to find an optimum solution to a problem. It provides a technique of measuring the marginal change in the dependent variable (Y) due to a change in the independent variable (X) when the change in X approaches zero. The measure of such a change is called derivatives. Mathematically X Y X Y Y      0 lim  
  • 23. iv- Optimization Techniques  It is the technique of finding the value of the independent variable that maximizes or minimizes the value of the dependent variable. Eg. Simplex method, transportation problem, assignment problem, replacement problem etc.
  • 24. v- Regression Technique  It is used to quantify the relationship between two or more economic variable. Regression is used to estimate the nature & extent of the relationship between two or more related variables. It is used to study the cause & effect relationship between the variables.
  • 25. Some Basic Principles:  Opportunity cost Principles,  Incremental Principles,  Principle of Time Perspective,  Discounting Principle
  • 26. Opportunity Cost Principle  Opportunity cost of a decision is the sacrifice of alternatives required by that decision. If there are no sacrifices, there is no cost.  According to Opportunity cost principle, a firm can hire a factor of production if and only if that factor earns a reward in that occupation/job equal or greater than it’s opportunity cost. Opportunity cost is the minimum price that would be necessary to retain a factor- service in it’s given use. It is also defined as the cost of sacrificed alternatives.  Decisions involving opportunity cost includes; Make or buy; Breakdown or preventive maintenance of machines; replacement or new investment decision; direct recruitment from outside or Departmental promotion.  For instance, a person chooses to forgo (give-up) his present profitable job which offers him Rs.50000 per month, and organizes his own business. The opportunity lost (earning Rs. 50,000) will be the opportunity cost of running his own business.
  • 27. Marginal and Incremental Principle  This principle states that a decision is said to be balanced and sound if the firm’s objective is of profit maximization, it leads to increase in profit, which is in either of two scenarios-  If total revenue increases more than total cost.  If total revenue declines less than total cost. Marginal generally refers to small changes. Marginal analysis implies judging the impact of a unit change in one variable on the other. Marginal revenue is the change in total revenue per unit change in output sold. Marginal cost refers to change in total costs per unit change in output produced (While incremental cost refers to change in total costs due to change in total output). The decision of a firm to change the price would depend upon the resulting impact/change in marginal revenue and marginal cost. If the marginal revenue is greater than the marginal cost, then the firm should bring about the change in price.
  • 28. Principle of Time Perspective  According to this principle, a manger/decision maker should give due emphasis, both to short-term and long-term impact of his decisions, giving apt significance to the different time periods before reaching any decision. Short-run refers to a time period in which some factors are fixed while others are variable. The production can be increased by increasing the quantity of variable factors. While long-run is a time period in which all factors of production can become variable. Entry and exit of seller firms can take place easily. From consumers point of view, short-run refers to a period in which they respond to the changes in price, given the taste and preferences of the consumers, while long-run is a time period in which the consumers have enough time to respond to price changes by varying their tastes and preferences.
  • 29. Discounting Principle  Discounting is both a concept as well as technique from accountancy.  According to this principle, if a decision affects costs and revenues in long-run, all those costs and revenues must be discounted to present values. This is essential because a rupee worth of money at a future date is not worth a rupee today. Money actually has time value. Discounting can be defined as a process used to transform future Rupee into an equivalent number of present Rupee. For instance, Rs1000 invested today at 10% interest is equivalent to Rs1100 next year. FV = PV*(1+r)t ; where, FV is the future value (time at some future time), PV is the present value (r is the discount (interest) rate, and t is the time between the future value and present value.
  • 30. Role of managerial Economists:  A managerial economist can play a very important role by assisting the Management in using the increasingly specialized skills and sophisticated techniques which are required to solve the difficult problems of successful decision-making and forward planning. That is why, in business concerns, his importance is being growingly recognized. 1- Pricing: Managerial economists assists businesses in determining pricing strategies and appropriate pricing levels for their products and services. Some common analysis methods are price discrimination, value-based pricing and cost-plus pricing. 2- Elastic vs. Inelastic Goods: Economists can determine price sensitivity of products through a price elasticity analysis. Some products, such as milk, are consider a necessity rather than a luxury and will purchase at most price points. This type of product is considered inelastic. When a business knows they are selling an inelastic good, they can make marketing and pricing decisions easier.
  • 31. Role of managerial Economists (Cont’d) 3- Operations and Production: Managerial economists uses quantitative methods to analyze production and operational efficiency through schedule optimization, economies of scale and resource analyses. Additional analysis methods include marginal cost, marginal revenue and operating leverage. Through tweaking the operations and production of a company, profits rise as costs decline. 4- Risk: Uncertainty exits in every business and managerial economists can help reduce risk through uncertainty model analysis and decision-theory analysis. Heavy use of statistical probability theory helps provide potential scenarios for businesses to use when making decisions.
  • 32. Responsibilities: 1- To maximize profit: Since the most important objective of a firm is to maximize profits on investment, the managerial economist must also help in achieving this goal. 2- Accurate Forecast: The most important responsibility of a managerial economist is to make as accurate forecasts as possible. 3- To maintain Contacts: He should be capable enough to establish and maintain contacts with individual & data Sources 4- To Inform Mgt: He helps management in informing about economic trends. 5- Ability: A managerial economist caliber is generally judged by his ability to obtain necessary information quickly by personal contacts.
  • 33. Demand Analysis & Forecasting  Demand reflects the size and the pattern of market. Business activity is always market-determined. The manufacturers encouragement to invest in a given line of production is limited by the size of market.  Demand for output and input; the demand for the firm and the industry; the demand by the consumer and stockiest; and similar other demand concepts become therefore, relevant for managerial decision analysis. Even if the firm pursues objectives alternative to profit-maximization, demand concepts still remain relevant
  • 34. Concept of Demand  ‘Demand’ is a technical concept from Economics. Demand for product is: • Desires to acquire it, • Willingness to pay for it, and • Ability to pay for it.  For example : A poor man’s desires to stay in a five-star hotel room and his willingness to pay rent for that room is not ‘demand’, because he lacks the necessary purchasing power; so it is his wishful thinking. Similarly, a miser’s desire for and his ability to pay for a car is not ‘demand’, because he does not have the necessary willingness to pay for a car.  One may also come across a well-established person who processes both the willingness and the ability to pay for higher education.
  • 35. Demand Function and Demand Curve  Demand function is a comprehensive formulation which specifies the factors that influence the demand for the product. What can be those factors which affect the demand? For example,  Dx = D (Px, Py, Pz, B, W, A, E, T, U)  Dx is demand for item x (say, a car)  PX, its own price (of the car)  Py, the price of its substitutes (other brands/models)  Pz, the price of its complements (like petrol)  B, the income (budget) of the purchaser (user/consumer)  W, the wealth of the purchaser  A, the advertisement for the product (car)  E, the price expectation of the user  T, taste or preferences of user  U, all other factors.
  • 36. Factors Influencing Demand Curve 1- Price of close substitute & complements: If the price of a substitute falls, then consumer will shift towards its substitute, creating a fall in the demand for the concerned good. Ex. Tea & Coffee In case of complementary items such as butter & Bread. If the price of butter increases the demand of butter as well as demand of bread decreases. 2- Change in taste & preferences: In this case demand curve shift leftwards.
  • 37. Factors…. (cont’d) 3- Income of the consumer: As the income of the consumer rises, the buying potential tends to rise & the consumer will buy more of the same good. Demand curve shift upward. 4- Existing wealth of the consumer: If the existing wealth of the consumer such as bonds, stocks, real estate, gold etc. permits him to make a purchase the demand curve may shift rightward. 5- Population: If pop’l of a town increases its demand for housing will also increases.
  • 38. 6- Expectations regarding future price change: If the consumer expects a price fall in the near future he may curtail his present purchase. Ex Gold Edible oil etc. 7- Special Influences: Ex Woolen garments, Helmets.
  • 39. Elasticity:  Elasticity: The tendency to return to its original shape after it is stretched or compressed.  Elasticity of Demand: From the law of demand we know that when the price of a good increases, the quantity demanded falls, oter things remaining same. It gives the direction of change in demand for a given change in price. If we know the magnitude of the change it will be helpful in our decision making. It also helps us in forecasting market trends for the future.
  • 40. Price Elasticity of Demand:  To know the response of the quantity demanded to change in price, we measure the Price Elasticity of Demand. Def: It is defined as the percentage change in quantity demanded resulting from one % change in the price of the good, other things remaining constant. ep= %age change in quantity demanded / %age change in price If the quantity demanded decreases when the price increases then the ratio is negative. Usually price elasticity of demand is +ive.
  • 41. Price Elasticity of Demand (cont’d)… Denoting elasticity by e, we have e= ΔQ /ΔP÷ Q/P Where ΔQ is small change in quantity ΔP is small change in price Pis the Original Price & Q is Original quantity of good Ex: If the rail fare are increases by 6% & the demand for rail travel decreases by 2%. Price elasticity of demand for rail fare is - 2%/ 6%= 0.33
  • 42. Elasticity Price (Rs) Quantity Demanded D 10 5 20 Producer decides to reduce price to increase sales 7 % Δ in Price = - 30% % Δ in Demand = + 300% Ped = - 10 (Elastic) Total Revenue rises Good Move!
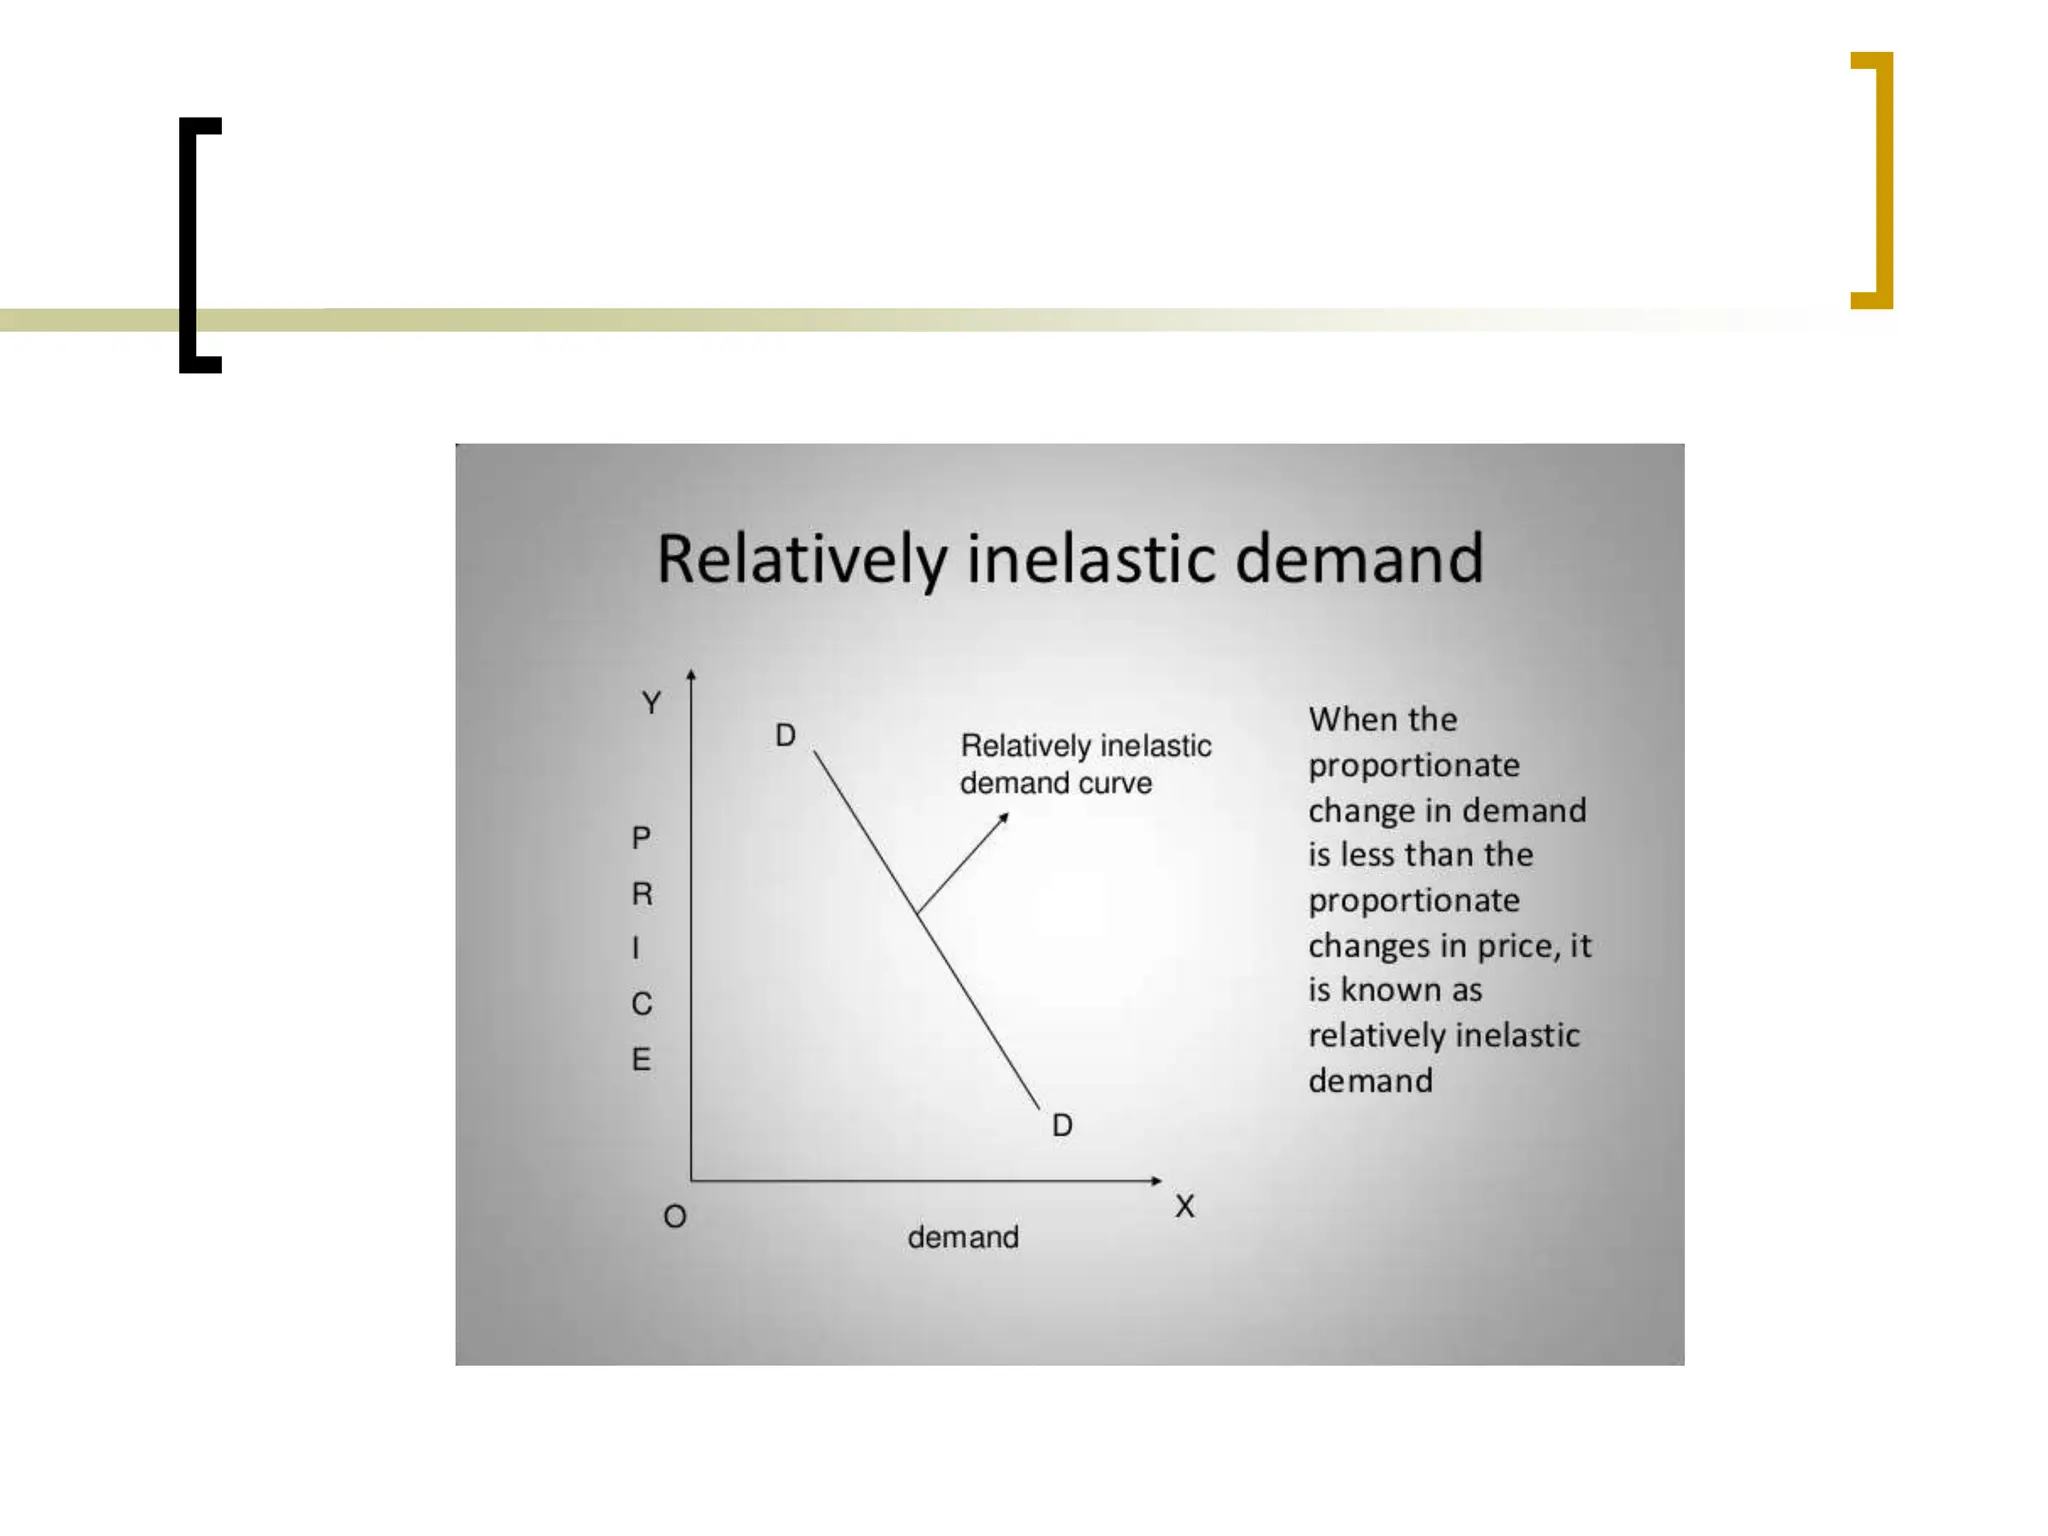
  • 43. Kinds of Price Elasticity of demand
  • 44.
  • 45.
  • 46.
  • 47.
  • 48.
  • 49.
  • 50. Income Elasticity of Demand:  The responsiveness of demand to changes in incomes  Normal Good – demand rises as income rises and vice versa.  Inferior Good – demand falls as income rises and vice versa
  • 51. Income Elasticity of Demand:  A positive sign denotes a normal good  A negative sign denotes an inferior good
  • 52.  For example:  Yed = - 0.6: Good is an inferior good but inelastic – a rise in income of 3% would lead to demand falling by 1.8%  Yed = + 0.4: Good is a normal good but inelastic – a rise in incomes of 3% would lead to demand rising by 1.2%  Yed = + 1.6: Good is a normal good and elastic – a rise in incomes of 3% would lead to demand rising by 4.8%  Yed = - 2.1: Good is an inferior good and elastic – a rise in incomes of 3% would lead to a fall in demand of 6.3%
  • 54.
  • 55.
  • 56.
  • 57.
  • 58.
  • 59. Thank You I may be reached at drjayantdubey@gmail.com