The document provides an overview of key concepts in economics including:
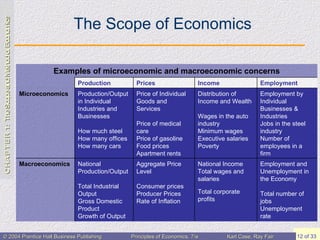
1) Microeconomics examines individual decision-making units like businesses and households, while macroeconomics examines economic aggregates on a national scale.
2) Positive economics objectively studies and describes economic behavior and outcomes, while normative economics makes judgments and may recommend policies.
3) Economic theories involve models to simplify reality, with variables and assumptions used to study relationships between factors.