This document provides definitions and explanations of key economic concepts. It begins by defining microeconomics and macroeconomics. Microeconomics examines individual economic decisions and interactions, while macroeconomics looks at aggregate economic performance and structure at a national or international level. The document then discusses various market structures like perfect competition, monopoly, oligopoly, and their characteristics. It also covers concepts like demand, supply, equilibrium, elasticity, costs of production, and opportunity cost. The final sections define additional economic terms and concepts related to welfare economics, labor economics, and measures like unemployment rate.

![the factors of production: labor, capital, land. Technology can be viewed either as a form of fixed
capital (e.g. plant) or circulating capital (e.g. intermediate goods).
Opportunity cost: The opportunity cost of any activity is the value of the next-best alternative thing you may
have done instead. Opportunity cost depends only on the value of the next-best alternative. It doesn‘t matter
whether you have 5 alternatives or 5,000.
Opportunity costs can tell you when not to do something as well as when to do something. For example, you
may like waffles, but you like chocolate even more. If someone offers you only waffles, you‘re going to take it.
But if you‘re offered waffles or chocolate, you‘re going to take the chocolate. The opportunity cost of eating
waffles is sacrificing the chance to eat chocolate.
Perfect competition is a situation in which numerous small firms producing identical products compete against
each other in a given industry. A good example would be that of digital marketplaces, such as eBay, on which
many different sellers sell similar products to many different buyers.
Imperfect competition: In economic theory, imperfect competition is a type of market structure showing
some but not all features of competitive markets.
Monopolistic competition is a situation in which many firms with slightly different products compete.
Production costs are above what may be achieved by perfectly competitive firms, but society benefits from the
product differentiation. Examples of industries with market structures similar to monopolistic competition
include restaurants, cereal, clothing, shoes, and service industries in large cities.
A monopoly is a market structure in which a market or industry is dominated by a single supplier of a particular
good or service. Because monopolies have no competition they tend to sell goods and services at a higher price
and produce below the socially optimal output level. Although not all monopolies are a bad thing, especially in
industries where multiple firms would result in more problems than benefits (i.e. natural monopolies).
Natural monopoly: A monopoly in an industry where one producer can produce output at a lower cost than
many small producers.
An oligopoly is a market structure in which a market or industry is dominated by a small number of firms
(oligopolists). Oligopolies can create the incentive for firms to engage in collusion and form cartels that reduce
competition leading to higher prices for consumers and less overall market output.[6]
Alternatively, oligopolies
can be fiercely competitive and engage in flamboyant advertising campaigns.
Duopoly: A special case of an oligopoly, with only two firms. Game theory can elucidate behavior in duopolies
and oligopolies.[7]
A monopsony is a market where there is only one buyer and many sellers.
An oligopsony is a market where there are a few buyers and many sellers.
Game theory is a major method used in mathematical economics and business for modeling competing
behaviors of interacting agents. The term "game" here implies the study of any strategic interaction between
people. Applications include a wide array of economic phenomena and approaches, such
as auctions, bargaining, acquisitions pricing, fair division, duopolies, oligopolies, social
network formation, agent-based computational economics, general equilibrium, mechanism design, and voting
systems, and across such broad areas as experimental economics, behavioral economics, information
economics, industrial organization, and political economy.](https://image.slidesharecdn.com/basiceconomics-230320164450-f2886f06/85/Basic-Economics-pdf-3-320.jpg)

![Jain proposes (attributed to George Stigler): "A partial equilibrium is one which is based on only a restricted
range of data, a standard example is price of a single product, the prices of all other products being held fixed
during the analysis
Price elasticity of supply: The price elasticity of supply measures how the amount of a good that a supplier
wishes to supply changes in response to a change in price.
Elasticities of scale: Elasticity of scale or output elasticity measures the percentage change in output induced by
a collective percent change in the usages of all inputs.
Price elasticity of demand: Price elasticity of demand is a measure used to show the responsiveness, or
elasticity, of the quantity demanded of a good or service to a change in its price. More precisely, it gives the
percentage change in quantity demanded in response to a one percent change in price (ceteris paribus, i.e.
holding constant all the other determinants of demand, such as income).
Cross-price elasticity of demand is a measure of the responsiveness of the demand for one product to changes
in the price of a different product. It is the ratio of percentage change in the former to the percentage change in
the latter. If it is positive, the goods are called substitutes because a rise in the price of the other good causes
consumers to substitute away from buying as much of the other good as before and into buying more of this
good. If it is negative, the goods are called complements
Explicit costs are opportunity costs that involve direct monetary payment by producers. The explicit
opportunity cost of the factors of production not already owned by a producer is the price that the producer has
to pay for them. For instance, if a firm spends $100 on electrical power consumed, its explicit opportunity cost is
$100.[5]
This cash expenditure represents a lost opportunity to purchase something else with the $100.
Implicit costs (also called implied, imputed or notional costs) are the opportunity costs that are not reflected in
cash outflow but implied by the failure of the firm to allocate its existing (owned) resources, or factors of
production to the best alternative use. For example: a manufacturer has previously purchased 1000 tons of steel
and the machinery to produce a widget. The implicit part of the opportunity cost of producing the widget is the
revenue lost by not selling the steel and not renting out the machinery instead of using it for production.
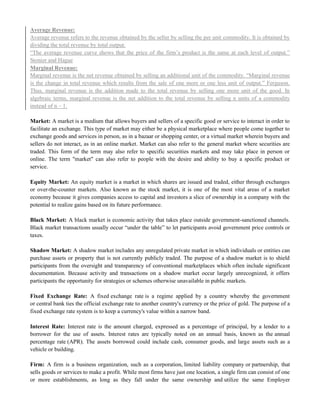
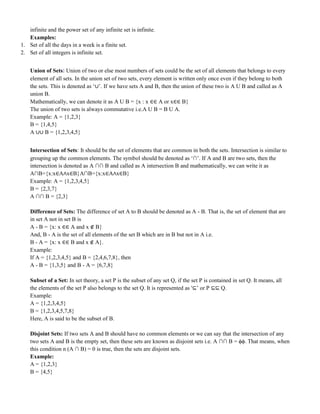
Quick Reference to Basic Market Structures
Market
Structure
Seller Entry
Barriers
Seller
Number
Buyer Entry
Barriers
Buyer
Number
Perfect
Competition
No Many No Many
Monopolistic
competition
No Many No Many
Monopoly Yes One No Many
Duopoly Yes Two No Many
Oligopoly Yes Few No Many
Monopsony No Many Yes One
Oligopsony No Many Yes Few](https://image.slidesharecdn.com/basiceconomics-230320164450-f2886f06/85/Basic-Economics-pdf-5-320.jpg)


![The rational numbers are those numbers which can be expressed as a ratio between two integers. For example,
the fractions 1313 and −11118−11118 are both rational numbers. All the integers are included in the rational
numbers, since any integer zz can be written as the ratio z1z1.
All decimals which terminate are rational numbers (since 8.278.27 can be written as 827100827100.) Decimals
which have a repeating pattern after some point are also rationals: for example,
0.0833333....=1120.0833333....=112.
The set of rational numbers is closed under all four basic operations, that is, given any two rational numbers,
their sum, difference, product, and quotient is also a rational number (as long as we don't divide by 00).
An irrational number is a number that cannot be written as a ratio (or fraction). In decimal form, it never ends
or repeats. The ancient Greeks discovered that not all numbers are rational; there are equations that cannot be
solved using ratios of integers.
The first such equation to be studied was 2=x22=x2. What number times itself equals 22?
2√2 is about 1.4141.414, because 1.4142=1.9993961.4142=1.999396, which is close to 22. But you'll never hit
exactly by squaring a fraction (or terminating decimal). The square root of 22 is an irrational number, meaning
its decimal equivalent goes on forever, with no repeating pattern:
2√=1.41421356237309...2=1.41421356237309...
The real numbers is the set of numbers containing all of the rational numbers and all of the irrational
numbers. The real numbers are ―all the numbers‖ on the number line. There are infinitely many real numbers
just as there are infinitely many numbers in each of the other sets of numbers. But, it can be proved that the
infinity of the real numbers is a bigger infinity.
The "smaller", or countable infinity of the integers and rationals is sometimes called ℵ 0ℵ 0(alef-naught), and
the uncountable infinity of the reals is called ℵ 1ℵ 1(alef-one).
There are even "bigger" infinities, but you should take a set theory class for that!
(Decimal)—Represent any number using 10 digits [0–9]
Base 2 (Binary)—Represent any number using 2 digits [0–1]
Base 8 (Octal)—Represent any number using 8 digits [0–7]
Base 16(Hexadecimal)—Represent any number using 10 digits and 6 characters [0–9, A, B, C, D, E, F]
Set theory is a branch of mathematical logic that studies sets, which informally are collections of objects.
Although any type of object can be collected into a set, set theory is applied most often to objects that are
relevant to mathematics. The language of set theory can be used in the definitions of nearly all mathematical
objects.
A set that has no element should be called as Empty set. Another name for Empty set could be Null set and Void
set. Number of element in set X is represented as n(X). The empty set is denoted as Φ. Thus, n(Φ) = 0. The
cardinality of an empty set is zero since it has no element.
Singleton Set: A set that has one and only one element should be called as Singleton set. Sometimes, it is
known as unit set. The cardinality of singleton is one. If A is a singleton, then we can express it as
A = {x : x = A}
Example: Set A = {5} is a singleton set.
Finite and Infinite Set: A set that has predetermined number of elements or finite number of elements are said
to be Finite set. Like {1 ,2, 3, 4, 5, 6} is a finite set whose cardinality is 6, since it has 6 elements.
Otherwise, it is called as infinite set. It may be uncountable or countable. The union of some infinite sets is](https://image.slidesharecdn.com/basiceconomics-230320164450-f2886f06/85/Basic-Economics-pdf-33-320.jpg)


![interquartile range is that it can be used as a measure of variability if the extreme values are not being recorded
exactly (as in case of open-ended class intervals in the frequency distribution).[2] Other advantageous feature is
that it is not affected by extreme values. The main disadvantage in using interquartile range as a measure of
dispersion is that it is not amenable to mathematical manipulation.
Standard deviation
Standard deviation (SD) is the most commonly used measure of dispersion. It is a measure of spread of data
about the mean. SD is the square root of sum of squared deviation from the mean divided by the number of
observations.
This formula is a definitional one and for calculations, an easier formula is used. The computational formula
also avoids the rounding errors during calculation.
In both these formulas n - 1 is used instead of n in the denominator, as this produces a more accurate estimate of
population SD.
The reason why SD is a very useful measure of dispersion is that, if the observations are from a normal
distribution, then 68% of observations lie between mean ± 1 SD 95% of observations lie between mean ± 2 SD
and 99.7% of observations lie between mean ± 3 SD
The other advantage of SD is that along with mean it can be used to detect skewness. The disadvantage of SD is
that it is an inappropriate measure of dispersion for skewed data.
The semi-interquartile range is a measure of spread or dispersion. It is computed as one half the difference
between the 75th percentile [often called (Q3)] and the 25th percentile (Q1). The formula for semi-interquartile
range is therefore: (Q3-Q1)/2.
What is 'Standard Deviation'
The standard deviation is a statistic that measures the dispersion of a dataset relative to its mean and is
calculated as the square root of the variance. It is calculated as the square root of variance by determining the
variation between each data point relative to the mean. If the data points are further from the mean, there is
higher deviation within the data set; thus, the more spread out the data, the higher the standard deviation.
In finance, standard deviation is a statistical measurement; when applied to the annual rate of return of an
investment, it sheds light on the historical volatility of that investment. The greater the standard deviation of a
security, the greater the variance between each price and the mean, which shows a larger price range. For
example, a volatile stock has a high standard deviation, while the deviation of a stable blue-chip stock is usually
rather low.
What is 'Variance'
Variance is a measurement of the spread between numbers in a data set. The variance measures how far each
number in the set is from the mean. Variance is calculated by taking the differences between each number in the
set and the mean, squaring the differences (to make them positive) and dividing the sum of the squares by the
number of values in the set.
What is 'Coefficient of Variation (CV)'
A coefficient of variation (CV) is a statistical measure of the dispersion of data points in a data series around the
mean. It is calculated as follows: (standard deviation) / (expected value). The coefficient of variation represents](https://image.slidesharecdn.com/basiceconomics-230320164450-f2886f06/85/Basic-Economics-pdf-44-320.jpg)


![6. Economic growth is a short-term process which takes into account yearly growth of the economy. But if we talk
about economic development it is a long term process.
7. Economic Growth applies to developed economies to gauge the quality of life, but as it is an essential condition
for the development, it applies to developing countries also. In contrast to, economic development applies to
developing countries to measure progress.
8. Economic Growth results in quantitative changes, but economic development brings both quantitative and
qualitative changes.
9. Economic growth can be measured in a particular period. As opposed to economic development is a continuous
process so that it can be seen in the long run.
A developed country, industrialized country, more developed country, or more economically developed
country (MEDC), is a sovereign state that has a developed economy and advanced technological infrastructure
relative to other less industrialized nations. Most commonly, the criteria for evaluating the degree of economic
development are gross domestic product (GDP), gross national product (GNP), the per capita income, level of
industrialization, amount of widespread infrastructure and general standard of living. Which criteria are to be
used and which countries can be classified as being developed are subjects of debate.
A developing country (or a low and middle income country (LMIC), less developed country, less economically
developed country (LEDC), underdeveloped country) is a country with a less developed industrial base and a
low Human Development Index (HDI) relative to other countries. However, this definition is not universally
agreed upon. There is also no clear agreement on which countries fit this category.[2]
A nation's GDP per
capitacompared with other nations can also be a reference point.
The Least Developed Countries (LDCs) is a list of developing countries that, according to the United Nations,
exhibit the lowest indicators of socioeconomic development, with the lowest Human Development Index ratings
of all countries in the world. The concept of LDCs originated in the late 1960s and the first group of LDCs was
listed by the UN in its resolution 2768 (XXVI) of 18 November 1971.
A country is classified among the Least Developed Countries if it meets three criteria:
Poverty – adjustable criterion based on GNI per capita averaged over three years. As of 2018 a country must
have GNI per capita less than US $1,025 to be included on the list, and over $1,230 to graduate from it.
Human resource weakness (based on indicators of nutrition, health, education and adult literacy).
Economic vulnerability (based on instability of agricultural production, instability of exports of goods and
services, economic importance of non-traditional activities, merchandise export concentration, handicap of
economic smallness, and the percentage of population displaced by natural disasters).
Below is an outline of Rostow's Five Stages of Growth:
Traditional Society
characterized by subsistence agriculture or hunting and gathering; almost wholly a "primary" sector economy
limited technology
Some advancements and improvements to processes, but limited ability for economic growth because of the
absence of modern technologies, lack of class or individual economic mobility, with stability prioritized and
change seen negatively
This is where society generally begins before progressing towards the next stages of growth
No centralized nations or political systems.
Pre-conditions to "take-off"
External demand for raw materials initiates economic change.](https://image.slidesharecdn.com/basiceconomics-230320164450-f2886f06/85/Basic-Economics-pdf-65-320.jpg)


![A public good is often (though not always) under-provided in a free market because its characteristics of non-
rivalry and non-excludability mean there is an incentive not to pay. In a free market, firms may not provide the
good as they have difficulty charging people for their use.
Quasi-Public Goods
These are goods which have an element of non-excludability and non-rivalry. Roads are a good example. Once
provided most people can use them, for example, those who have a driving licence. However, when you use a
road, the amount others can benefit is reduced to some extent, because there will be increased congestion.
Club Goods
Club goods are products that are excludable but non-rival. Thus, individuals can be prevented from consuming
them, but their consumption does not reduce their availability to other individuals (at least until a point of
overuse or congestion is reached). Club goods are sometimes also referred to as artificially scarce resources.
They are often provided by natural monopolies. Examples of club goods include: cable television, cinemas,
wireless internet, tollroads etc.
Government debt (also known as public interest, public debt, national debt and sovereign debt)[1][2]
is
the debt owed by a government. By contrast, the annual "government deficit" refers to the difference between
government receipts and spending in a single year.
Government debt can be categorized as internal debt (owed to lenders within the country) and external
debt (owed to foreign lenders). Another common division of government debt is by duration until repayment is
due. Short term debt is generally considered to be for one year or less, long term is for more than ten years.
Medium term debt falls between these two boundaries. A broader definition of government debt may consider
all government liabilities, including future pension payments and payments for goods and services which the
government has contracted but not yet paid.
Internal and External Debt:
Public loans floated within the country are called internal debt. Public borrowings from other countries are
referred as external debt. External debt represents a claim of foreigners against the real income (GNP) of the
country, when it borrows from other countries and has to repay at the time of maturity.
External public debt permits import of real resources. It enables the country to consume more than it produces.
Productive and Unproductive Debt:
Public debt is said to be productive or reproductive, when government loans are invested in productive assets or
enterprises such as railways, irrigation, multipurpose projects etc., which yield a sufficient income to the public
authority to pay out annual interest on the debt as well as help in repaying the principal in the long run.
As such, a productive public debt is self-liquidating in nature; so the community experiences no net burden of
such debt.
An unproductive debt, on the other hand, is one which does not add to the productive assets of a country. When
the government borrows for unproductive purposes like financing a war, or for lavish expenditure on public
administration, etc., such public loans are regarded as unproductive.
Compulsory and Voluntary Debt:
When government borrows from people by using coercive methods, loans so raised are referred to as
compulsory public debt. Under the Compulsory Deposit Scheme in India, tax-payers have to compulsorily
deposit a prescribed amount and defaulters are punished. This is a case of compulsory debt.
Usually, public borrowings are voluntary in nature. When the government floats a loan by issuing securities,
members of the public and institutions like commercial banks may subscribe to them.](https://image.slidesharecdn.com/basiceconomics-230320164450-f2886f06/85/Basic-Economics-pdf-73-320.jpg)
![Redeemable and Irredeemable Debts:
On the criterion of maturity, public debts may be classified as redeemable or irredeemable. Loans which the
government promises to pay off at some future date are called redeemable debts. For redeemable debts, the
government has to make some arrangement for their repayment. They are, therefore, terminable loans.
Whereas loans for which no promise is made by the government regarding the exact date of maturity, and all
that the government does is to agree to pay interest regularly for the bonds issued, are called irredeemable debts.
Short-term, Medium-term and Long-term loans:
According to their duration, redeemable loans may further be classified as short-term, medium-term or long-
term debts. Short-term debts mature within a short period say, of 3 to 9 months. For instance, Treasury Bills are
an instrument of credit extensively used as a means of short-term (usually 90 days) borrowing by the
government, generally, for covering temporary deficits in the budgets. Interest rates on such loans are generally
low.
Long-term debts, on the other hand, are those repayable after a long period of time, generally, ten years or more.
For development finance, such loans are usually raised by the government. Long-term loans usually bear a high
rate of interest.
Funded and Unfunded Debt:
Funded debt is, in fact, a long-term debt, exceeding the duration of at least a year. It comprises securities which
are marketable on the stock exchange. Funded debt in its proper sense is, however, an obligation to pay a fixed
sum of interest, subject to the option of the government to repay the principal. In such debts, the creditor bond-
holder has no right to anything but the interest.
Unfunded debts, on the other hand, are for a comparatively short duration. They are generally redeemable within
a year. Unfunded debts are, thus, incurred always in anticipation of public revenue, a temporary measure to meet
current needs.
A debt management plan (DMP) is a formal agreement between a debtor and a creditor that addresses the
terms of an outstanding debt.[1]
This commonly refers to a personal finance process of individuals addressing
high consumer debt. Debt management plans help reduce outstanding, unsecured debts over time to help the
debtor regain control of finances. The process can secure a lower overall interest rate, longer repayment terms,
or an overall reduction in the debt itself
Deficit financing is the budgetary situation where expenditure is higher than the revenue. It is a practice adopted
for financing the excess expenditure with outside resources. The expenditure revenue gap is financed by either
printing of currency or through borrowing.
Various indicators of deficit in the budget are:
1. Budget deficit = total expenditure – total receipts
2. Revenue deficit = revenue expenditure – revenue receipts
3. Fiscal Deficit = total expenditure – total receipts except borrowings
4. Primary Deficit = Fiscal deficit- interest payments
5. Effective revenue Deficit-= Revenue Deficit – grants for the creation of capital assets
6. Monetized Fiscal Deficit = that part of the fiscal deficit covered by borrowing from the RBI.
Public expenditure is spending made by the government of a country on collective needs and wants such
as pension, provision,infrastructure, etc.[1]
Until the 19th century, public expenditure was limited as laissez faire
philosophies believed that money left in private hands could bring better returns. In the 20th century, John](https://image.slidesharecdn.com/basiceconomics-230320164450-f2886f06/85/Basic-Economics-pdf-74-320.jpg)
![Maynard Keynes argued the role of public expenditure in determining levels of income and distribution in
the economy. Since then government expenditures has shown an increasing trend.
A "budget" is a plan for the accomplishment of programs related to objectives and goals within a
definite time period, including an estimate of resources required, together with an estimate of resources
available, usually compared with one or more past periods and showing future requirements.[4]
A local government is a form of public administration which, in a majority of contexts, exists as the lowest tier
of administration within a given state. The term is used to contrast with offices at state level, which are referred
to as the central government, national government, or (where appropriate) federal government and also
to supranational government which deals with governing institutions between states. Local governments
generally act within powers delegated to them by legislation or directives of the higher level of government.
In federal states, local government generally comprises the third (or sometimes fourth) tier of government,
whereas inunitary states, local government usually occupies the second or third tier of government, often with
greater powers than higher-level administrative divisions.
Agricultural economics is an applied field of economics concerned with the application of economic theory in
optimizing the production and distribution of food and fibre—a discipline known as agricultural economics.
Agricultural economics was a branch of economics that specifically dealt with land usage. It focused on
maximizing the crop yield while maintaining a good soil ecosystem.
What Is Returns to Scale?
The terms 'economies of scale' and 'returns to scale' are related, but they mean very different things in
economics. While economies of scale refers to the cost savings that are realized from an increase in the volume
of production, returns to scale is the variation or change in productivity that is the outcome from a
proportionate increase of all the input.
An increasing returns to scale occurs when the output increases by a larger proportion than the increase in
inputs during the production process. For example, if input is increased by 3 times, but output increases by 3.75
times, then the firm or economy has experienced an increasing returns to scale.
A decreasing returns to scale occurs when the proportion of output is less than the desired increased input
during the production process. For example, if input is increased by 3 times, but output is reduced 2 times, the
firm or economy has experienced decreasing returns to scale.
A constant returns to scale means that the proportionate increase in input is exactly equal to the increase in
output. In Barry's case the 25% increase in input would result in a 25% increase output. So, with the additional 2
barbers, production would increase from 250 to 313 clients. The level of efficiency is maintained.
In common law systems, land tenure is the legal regime in which land is owned by an individual, who is said to
"hold" the land. The French verb "tenir" means "to hold" and "tenant" is the present participle of "tenir". The
sovereign monarch, known as The Crown, held land in its own right. All private owners are either its tenants or
sub-tenants. Tenuresignifies the relationship between tenant and lord, not the relationship between tenant and
land.
Subsistence agriculture is a self-sufficiency farming system in which the farmers focus on growing enough
food to feed themselves and their entire families. The output is mostly for local requirements with little or no
surplus trade. The typical subsistence farm has a range of crops and animals needed by the family to feed and
clothe themselves during the year. Planting decisions are made principally with an eye toward what the family
will need during the coming year, and secondarily toward market prices](https://image.slidesharecdn.com/basiceconomics-230320164450-f2886f06/85/Basic-Economics-pdf-75-320.jpg)


![What are 'Excess Reserves'
Excess reserves are capital reserves held by a bank or financial institution in excess of what is required by
regulators, creditors or internal controls. For commercial banks, excess reserves are measured against standard
reserve requirement amounts set by central banking authorities. These required reserve ratios set the minimum
liquid deposits (such as cash) that must be in reserve at a bank; more is considered excess.
In monetary economics, a money multiplier is one of various closely related ratios of commercial bank
money to central bank money under a fractional-reserve bankingsystem.[1]
Most often, it measures an estimate of
the maximum amount of commercial bank money that can be created, given a certain amount of central bank
money. That is, in afractional-reserve banking system, the total amount of loans that commercial banks are
allowed to extend (the commercial bank money that they can legally create) is equal to an amount which is a
multiple of the amount of reserves. This multiple is the reciprocal of the reserve ratio, and it is an economic
multiplier.
What is 'Human Capital'
Human capital is a quantification of the economic value of a worker's skill set. This measure builds on the basic
production input of labor measure where all labor is thought to be equal. The concept of human capital
recognizes that not all labor is equal and that the quality of employees can be improved by investing in them; the
education, experience and abilities of employees have economic value for employers and for the economy as a
whole.
Definition of balanced growth: Balanced growth refers to a specific type of economic growth that is sustainable
in the long term. It is sustainable in terms of low inflation, the environment and balanced between different
sectors of the economy such as exports and retail spending. Balanced growth is the opposite of volatile boom
and bust economic cycles.
―Unbalanced growth is a better development strategy to concentrate available resources on types of investment,
which help to make the economic system more elastic, more capable of expansion under the stimulus of
expanded market and expanding demand‖-H.W.Singer.
Urban economics is broadly the economic study of urban areas; as such, it involves using the tools of
economics to analyze urban issues such as crime, education, public transit, housing, and local government
finance. More narrowly, it is a branch ofmicroeconomics that studies urban spatial structure and the location of
households and firms (Quigley 2008).
International economics is concerned with the effects upon economic activity from international differences in
productive resources and consumer preferences and the international institutions that affect them. It seeks to
explain the patterns and consequences of transactions and interactions between the inhabitants of different
countries, including trade, investment and migration.
International trade studies goods-and-services flows across international boundaries from supply-and-
demand factors,economic integration, international factor movements, and policy variables such as tariff rates
and trade quotas.
International finance studies the flow of capital across international financial markets, and the effects of these
movements onexchange rates.
International monetary economics and international macroeconomics study flows of money across countries
and the resulting effects on their economies as a whole.](https://image.slidesharecdn.com/basiceconomics-230320164450-f2886f06/85/Basic-Economics-pdf-79-320.jpg)


![new and in its early stages of development, and not yet capable of competing against established industry
competitors.
In economics, an infant industry is a new industry,[1]
which in its early stages experiences relative difficulty or
is absolutely incapable in competing with established competitorsabroad.
Infant Industries - Start-up industries in a country may not be able to effectively compete against foreign
producers because of their small size. An argument can be made that these industries should be protected until
suitable economies of scale can be achieved. If the economies of scale are such that the domestic industry
achieves a comparative advantage over foreign companies, the temporary protection will help to achieve better
economic efficiency
Trade creation is an economic term related to international economics in which trade flows are redirected due
to the formation of afree trade area or a customs union. The issue was firstly brought into discussion by Jacob
Viner (1950), together with the trade diversion effect.
Trade diversion is an economic term related to international economics in which trade is diverted from a more
efficient exporter towards a less efficient one by the formation of a free trade agreement or a customs union.
Total cost of good becomes cheaper when trading within the agreement because of the low tariff. This is as
compared to trading with countries outside the agreement with lower cost goods but higher tariff. The related
term Trade creation is when the formation of a trade agreement between countries decreases of price of the
goods for more consumers, and therefore increases overall trade. In this case the more efficient producer with
the agreement increases trade
A customs union was defined by the General Agreement on Tariffs and Trade as a type of trade bloc which is
composed of a free trade area with a common external tariff.[1]
The participant countries set up common external trade policy, but in some cases they use different import
quotas. Commoncompetition policy is also helpful to avoid competition deficiency.[2]
Purposes for establishing a customs union normally include increasing economic efficiency and establishing
closer political and cultural ties between the member countries.
A common market is a free trade area with relatively free movement of capital and services.
An economic union is a type of trade bloc which is composed of a common market with a customs union. The
participant countries have both common policies on product regulation, freedom of
movement of goods, services and the factors of production (capital and labour) and a common external
trade policy. When an economic union involves unifying currency it becomes an economic and monetary union.
Purposes for establishing an economic union normally include increasing economic efficiency and establishing
closer political and cultural ties between the member countries.
Industrial Economics is the study of firms, industries, and markets. It looks at firms of all sizes – from local
corner shops to multinational giants such as WalMart or Tesco. And it considers a whole range of industries,
such as electricity generation, car production, and restaurants.
What is an 'Industry'
An industry is a group of companies that are related based on their primary business activities. In modern
economies, there are dozens of industry classifications, which are typically grouped into larger categories called
sectors. Individual companies are generally classified into an industry based on their largest sources of revenue.
For example, while an automobile manufacturer might have a financing division that contributes 10% to the](https://image.slidesharecdn.com/basiceconomics-230320164450-f2886f06/85/Basic-Economics-pdf-85-320.jpg)


![What is a 'Portfolio'
A portfolio is a grouping of financial assets such as stocks, bonds, commodities, currencies and cash
equivalents, as well as their fund counterparts, including mutual, exchange-traded and closed funds. A portfolio
can also consist of non publicly tradable securities, like real estate, art, and private investments. Portfolios are
held directly by investors and/or managed by financial professionals and money managers. Investors should
construct an investment portfolio in accordance with their risk tolerance and their investing objectives. Investors
can also have multiple portfolios for various purposes. It all depends on one's objectives as an investor.
Definition of 'Risk Management'
In the financial world, risk management is the process of identification, analysis and acceptance or mitigation of
uncertainty in investment decisions. Essentially, risk management occurs when an investor or fund manager
analyzes and attempts to quantify the potential for losses in an investment and then takes the appropriate action
(or inaction) given his investment objectives and risk tolerance.
In international economics, international factor movements are movements of labor, capital, and other factors
of production between countries. International factor movements occur in three ways: immigration/emigration,
capital transfers through international borrowing and lending, and foreign direct investment.[1]
International
factor movements also raise political and social issues not present in trade in goods and services. Nations
frequently restrict immigration, capital flows, and foreign direct investment.
Public policy is the principled guide to action taken by the administrative executive branches of the state with
regard to a class of issues, in a manner consistent with law and institutional customs.
What is 'Input-Output Analysis'
Input-output analysis ("I-O") is a form of macroeconomic analysis based on the interdependencies between
economic sectors or industries. This method is commonly used for estimating the impacts of positive or negative
economic shocks and analyzing the ripple effects throughout an economy. This type of economic analysis was
originally developed by Wassily Leontief (1905–1999), who later won the Nobel Memorial Prize in Economic
Sciences for his work in this area.
Innovation can be defined simply as a "new idea, device or method". However, innovation is often also viewed
as the application of better solutions that meet new requirements, unarticulated needs, or existing market needs.
The technological innovation system is a concept developed within the scientific field of innovation studies
which serves to explain the nature and rate of technological change.[1]
A Technological Innovation System can
be defined as ‗a dynamic network of agents interacting in a specific economic/industrial area under a particular
institutional infrastructure and involved in the generation, diffusion, and utilization of technology‘
What is 'Efficiency'?
Efficiency signifies a level of performance that describes using the least amount of input to achieve the highest
amount of output. Efficiency refers to the use of all inputs in producing any given output, including personal
time and energy. It is a measurable concept that can be determined using the ratio of useful output to total input.
It minimizes the waste of resources such as physical materials, energy and time while accomplishing the desired
output.
What is 'Economic Efficiency'
Economic efficiency implies an economic state in which every resource is optimally allocated to serve each
individual or entity in the best way while minimizing waste and inefficiency. When an economy is economically](https://image.slidesharecdn.com/basiceconomics-230320164450-f2886f06/85/Basic-Economics-pdf-89-320.jpg)
![efficient, any changes made to assist one entity would harm another. In terms of production, goods are produced
at their lowest possible cost, as are the variable inputs of production.
What is 'Production Efficiency'
Production efficiency is an economic level at which the economy can no longer produce additional amounts of a
good without lowering the production level of another product. This happens when an economy is operating
along its production possibility frontier. Efficient production is achieved when a product is created at its lowest
average total cost; production efficiency measures whether the economy is producing as much as possible
without wasting precious resources
What is 'Market Efficiency'
Market efficiency refers to the degree to which market prices reflect all available, relevant information. If
markets are efficient, than all information is already incorporated into prices, and so there is no way to "beat" the
market because there are no under- or overvalued securities available. Market efficiency was developed in 1970
by economist Eugene Fama, whose theory of efficient market hypothesis (EMH) stated it is not possible for an
investor to outperform the market, and that market anomalies should not exist because they will immediately
be arbitraged away. Fama later won the Nobel Prize for his efforts. Investors who agree with this theory tend to
buy index funds that track overall market performance and are proponents of passive portfolio management.
Breaking down 'Operational Efficiency'
Operational efficiency in the investment markets is typically centered around transaction costs associated with
investments. Operational efficiency in the investment markets can be compared to general business practices for
operational efficiency in production. Operationally efficient transactions are those that are exchanged with the
highest margin, meaning an investor seeks to pay the lowest fee to earn the highest profit. Similarly, companies
seek to earn the highest gross margin profit from their products by manufacturing goods at the lowest cost. In
nearly all cases, operational efficiency can be improved by economies of scale. In the investment markets this
can translate to buying more shares of an investment at a fixed trading cost to reduce the fee per share.
Sustainable development is the organizing principle for meeting human development goals while at the same
time sustaining the ability of natural systems to provide the natural resources and ecosystem services upon
which the economy and society depend. The desired result is a state of society where living conditions and
resource use continue to meet human needs without undermining the integrity and stability of the natural
system. Sustainable development can be classified as development that meet the needs of the present without
compromising the ability of future generations.
Livestock are domesticated animals raised in an agricultural setting to produce labor and commodities such
as meat, eggs, milk, fur,leather, and wool. The term is sometimes used to refer solely to those that are bred for
consumption, while other times it refers only to farmed ruminants, such as cattle and goats.
In the various fields of healthcare, a population study is a study of a group of individuals taken from the
general population who share a common characteristic, such as age,sex, or health condition. This group may be
studied for different reasons, such as their response to a drug or risk of getting a disease.
Demography (from prefix demo- from Ancient Greek δῆμος dēmos meaning "the people", and -graphy from
γράφω graphō, implies "writing, description or measurement"[1]
) is the statistical study of populations,
especially human beings. As a very general science, it can analyze any kind of dynamic living population, i.e.,
one that changes over time or space (see population dynamics). Demography encompasses the study of the size,
structure, and distribution of these populations, and spatial or temporal changes in them in response](https://image.slidesharecdn.com/basiceconomics-230320164450-f2886f06/85/Basic-Economics-pdf-90-320.jpg)
![to birth, migration, aging, and death. Based on the demographic research of the earth, earth's population up to
the year 2050 and 2100 can be estimated by demographers. Demographics are quantifiable characteristics of a
given population.
Stillbirth is typically defined as fetal death at or after 20 to 28 weeks of pregnancy.[1][2]
It results in a baby born
without signs of life.[2]
A stillbirth can result in the feeling of guilt in the mother.[7]
The term is in contrast
to miscarriage which is an early pregnancy loss and live birth where the baby is born alive, even if it dies shortly
after.
In human reproduction, a live birth occurs when a fetus, whatever its gestational age, exits the maternal body
and subsequently shows any sign of life, such as voluntary movement, heartbeat, or pulsation of the umbilical
cord, for however brief a time and regardless of whether the umbilical cord or placenta are intact
Sterility is the physiological inability to effect sexual reproduction in a living thing, members of whose kind
have been produced sexually. Sterility has a wide range of causes. It may be an inherited trait, as in the mule; or
it may be acquired from the environment, for example through physical injury or disease, or by exposure
to radiation.
Birth control, also known as contraception and fertility control, is a method or device used to
prevent pregnancy.[1]
Birth control has been used since ancient times, but effective and safe methods of birth
control only became available in the 20th century.[2]
Planning, making available, and using birth control is
called family planning.[3][4]
Some cultures limit or discourage access to birth control because they consider it to
be morally, religiously, or politically undesirable.
In human demography and population biology, fecundity is the potential for reproduction of
an organism or population, measured by the number of gametes (eggs), seed set, or asexual propagules.
Fecundity is similar to fertility,[1][2]
the natural capability to produce offspring. A lack of fertility
is infertility while a lack of fecundity would be called sterility.
Fertility is the natural capability to produce offspring. As a measure, fertility rate is the number of offspring
born per mating pair, individual or population. Fertility differs fromfecundity, which is defined as
the potential for reproduction (influenced by gamete production, fertilization and carrying a pregnancy to
term)[citation needed]
. A lack of fertility isinfertility while a lack of fecundity would be called sterility.
Mortality is the state of being mortal, or susceptible to death; the opposite of immortality.
In mathematics, a ratio is a relationship between two numbers indicating how many times the first number
contains the second.[1]
For example, if a bowl of fruit contains eight oranges and six lemons, then the ratio of
oranges to lemons is eight to six (that is, 8:6, which is equivalent to the ratio 4:3). Similarly, the ratio of lemons
to oranges is 6:8 (or 3:4) and the ratio of oranges to the total amount of fruit is 8:14 (or 4:7).
A population pyramid, also called an "age-sex pyramid", is a graphical illustration that shows the distribution
of various age groups in a population (typically that of a country or region of the world), which forms the shape
of a pyramid when the population is growing.[1]
This tool can be used to visualize and age of a particular
population.[2]
It is also used in ecology to determine the overall age distribution of a population; an indication of
the reproductive capabilities and likelihood of the continuation of a species.](https://image.slidesharecdn.com/basiceconomics-230320164450-f2886f06/85/Basic-Economics-pdf-91-320.jpg)


![Urban Poverty: It occurs in the metropolitan areas with population over 50,000. These are some major
challenges faced by the Urban Poor:
• Limited access to health and education.
• Inadequate housing and services.
• Violent and unhealthy environment because of overcrowding.
• Little or no social protection mechanism.
Absolute Poverty:
Absolute poverty refers to a situation which individuals are unable to attendant necessities of life such as food,
cloth, shelter, safe drinking water, health facilities, primary education etc.
In other word, it is a situation in which the level of income of the people is so low that they cannot afford must
of their basic needs.
2. Relative poverty:
Relative poverty is the situation in which a person has enough income to sustain the life but the income and
living standard is lower compared to rest of the community. It is also the condition of less income in a country
compare to the worldwide income average income.
Structural transformation is defined as the transition of an economy from low productivity and labour
intensive economic activities to higher productivity and skill intensive activities. The driving force behind
structural transformation is the change of productivity in the modern sector, which is dominated by
manufacturing and services.
In sociology and economics, Social dualism is a theory developed by economist Julius Herman Boeke which
characterizes a society in the economic sense by the social spirit, the organisational forms and the technique
dominating it.[1]
According to Boeke, "These three aspects are interdependent and in this connection typify a
society, in this way that a prevailing social spirit and the prevailing forms of organisation and of technique give
the society its style, its appearance, so that in their interrelation they may be called the social system, the social
style or the social atmosphere of that society
Types of dualism:
I. Social dualism: Social dualism is a dualism found in society. It is developed by Booke(1954). He has
expressed the dualism in the sense of eastern developing countries and it exists in the form of:
• Traditional society system Vs Modern social system.
• Traditional society Vs Modern society.
• Traditional institutions Vs Modern social institutions.
II. Economic dualism: Economic dualism means existence of two types of economies in the national economic
system; for example
• Rural Vs Urban
• Traditional technology Vs Modern technology.
• Privatization Vs Nationalization.
III. Environmental dualism: This kind of dualism is common in developing countries like Nepal. This is found
as the following perspectives:
• Rural Vs Urban area.
• Ecological Vs Diversity.
• Regional Vs Diversity.
• Bio-climatic Vs Diversity.](https://image.slidesharecdn.com/basiceconomics-230320164450-f2886f06/85/Basic-Economics-pdf-94-320.jpg)


![The product mix is a subset of the marketing mix and is an important part of thebusiness model of a company.
The product mix has the following dimensions
Width
The width of the mix refers to the number of product lines the company has to offer.
For e.g., If a company produce only soft drinks and juices, this means its mix is two products wide. Coca-Cola
deals in juices, soft drinks, and mineral water and hence the product mix of Coca-Cola is three products wide.
Length
Length of the product mix refers to the total number of products in the mix. That is if a company has 5 product
lines and 10 products each under those product lines, the length of the mix will be 50 [5 x 10].
Depth
The depth of the product mix refers to the total number of products within a product line. There can be
variations in the products of the same product line. For e.g. Colgate has different variants under the same
product line like Colgate advanced, Colgate active salt, etc.
Consistency
Product mix consistency refers to how closely products are linked to each other. Less the variation among
products more is the consistency. For example, a company dealing in just dairy products has more consistency
than a company dealing in all types of electronics.
Marketing Mix Definition
Marketing mix is the set of tactics a business use to promote and sell its products in the market. These tactics
range from developing the product, deciding its price and places where it will be sold, to deciding its
communication and promotional strategies.
The tactics are further divided into 4Ps – Product, Price, Place, and Promotion. However, nowadays, the
marketing mix constitutes several other Pslike Process, People and physical evidence as vital mix elements.
Product mix
Product is an item produced or procured by the business to satisfy the needs of the customer. It is the actual item
which is held for sale in the market. The product can be tangible or intangible (it can be a good or a service). It
is not necessary that the business produce the product. It can also procure it from somewhere else.
What is a 'Product Line'
A product line is a group of related products under a single brand sold by the same company. Companies sell
multiple product lines under their various brands. Companies often expand their offerings by adding to existing
product lines, because consumers are more likely to purchase products from brands with which they are already
familiar.
What is a 'Brand'
A brand is an identifying symbol, mark, logo, name, word and/or sentence that companies use to distinguish
their product from others. A combination of one or more of those elements can be utilized to create a brand
identity. Legal protection given to a brand name is called a trademark.
What is a 'Brand Extension'
Brand extension, also known as brand stretching, leverages the reputation and popularity of the well-known
brand to increase demand for new products. Brand extension is the use of a well-established brand name for a
new product or new product category.
Packaging is the science, art and technology of enclosing or protecting products for distribution, storage, sale,
and use. Packaging also refers to the process of designing, evaluating, and producing packages. Packaging can](https://image.slidesharecdn.com/basiceconomics-230320164450-f2886f06/85/Basic-Economics-pdf-97-320.jpg)
![be described as a coordinated system of preparing goods for transport, warehousing, logistics, sale, and end use.
Packaging contains, protects, preserves, transports, informs, and sells.[1]
In many countries it is fully integrated
into government, business, institutional, industrial, and personal use.
Package labeling (American English) or labelling (British English) is any written, electronic, or graphic
communication on the package or on a separate but associated label.
Distribution (or place) is one of the four elements of the marketing mix. Distribution is the process of making a
product or service available for the consumer or business user that needs it. This can be done directly by the
producer or service provider, or using indirect channels with distributors or intermediaries. The other three
elements of the marketing mix are product, pricing, andpromotion.
Typical intermediaries involved in distribution include:
Wholesaler: A merchant intermediary who sells chiefly to retailers, other merchants, or industrial, institutional,
and commercial users mainly for resale or business use. Wholesalers typically sell in large quantities.
(Wholesalers, by definition, do not deal directly with the public).[9]
Retailer: A merchant intermediary who sells direct to the public. There are many different types of retail outlet
- from hypermarts and supermarkets to small, independent stores.
Agent: An intermediary who is authorised to act for a principal in order to facilitate exchange. Unlike merchant
wholesalers and retailers, agents do not take title to goods, but simply put buyers and sellers together. Agents are
typically paid via commissions by the principal. For example, travel agents are paid a commission of around
15% for each booking made with an airline or hotel operator.
Jobber: A jobber is a special type of wholesaler, typically one who operates on a small scale and sells only to
retailers or institutions. For example, rack jobbers are small independent wholesalers who operate from a truck,
supplying convenience stores with snack foods and drinks on a regular basis
In marketing, promotion refers to any type of marketing communication used to inform or persuade target
audiences of the relative merits of a product, service, brand or issue. The aim of promotion is to increase
awareness, create interest, generate sales or createbrand loyalty. It is one of the basic elements of the market
mix, which includes the four P's: price, product, promotion, and place.
A vision statement is a declaration of an organization's objectives, intended to guide its internal decision-
making.[1]
A vision statement is not limited to business organizations and may also be used by non-profit or
governmental entities
A mission statement is a short statement of an organization's purpose, identifying the goal of its operations:
what kind of product or service it provides, its primary customers ormarket, and its geographical region of
operation.[1][2]
It may include a short statement of such fundamental matters as the organization's values or
philosophies, a business's main competitive advantages, or a desired future state—the "vision".
Pricing is the process whereby a business sets the price at which it will sell its products and services, and may
be part of the business's marketing plan. In setting prices, the business will take into account the price at which it
could acquire the goods, themanufacturing cost, the market place, competition, market condition, brand, and
quality of product.
What is a 'Distribution Channel'
A distribution channel is a chain of businesses or intermediaries through which a good or service passes until it
reaches the end consumer. It can include wholesalers, retailers, distributors and even the internet. Channels are](https://image.slidesharecdn.com/basiceconomics-230320164450-f2886f06/85/Basic-Economics-pdf-98-320.jpg)
![broken into direct and indirect forms: A direct channel allows the consumer to buy the good from the
manufacturer, and an indirect channel allows the consumer to buy the good from a wholesaler or retailer.
Physical distribution is the group of activities associated with the supply of finished product from the
production line to the consumers. The physical distribution considers many sales distribution channels, such as
wholesale and retail, and includes critical decision areas like customer service, inventory, materials, packaging,
order processing, and transportation and logistics. You often will hear these processes be referred to
as distribution, which is used to describe the marketing and movement of products.
In marketing, the promotional mix describes a blend of promotional variables chosen by marketers to help a
firm reach its goals. It has been identified as a subset of the marketing mix.[1]
It is believed that there is an
optimal way of allocating budgets for the different elements within the promotional mix to achieve best
marketing results, and the challenge for marketers is to find the right mix of them.
Definition of 'Promotional Budget'
A promotional budget is a specified amount of money set aside to promote the products or beliefs of a business
or organization. Promotional budgets are created to anticipate the essential costs associated with growing a
business or maintaining a brand name. The budget is often set according to a percentage of sales or profits in
order to maintain an expected growth rate.
Cooperative Marketing
Cooperative marketing can be defined as an agreement between two companies to promote or sell each other‘s
product while selling their own. The products can either be complementary or might have different seasonal
cycles.
To explain in simpler terms, if you and your neighbour sell different products from a common premise it will be
called as cooperative marketing. The arrangements in cooperative marketing are usually free from any legal
bindings and are informal.
Applied Economics
Applied economics is a field that applies of economic theories and principles to real-world situations with the
desired aim of predicting potential outcomes. The use of applied economics is designed to analytically review
potential outcomes without the "noise" associated with explanations that are not backed by numbers. Applied
economics can involve the use of econometrics and case studies.
Social Security
Social Security is an important part of the Old-Age, Survivors, and Disability Insurance program and run by the
Social Security Administration. This is a social welfare and insurance plan managed by the U.S. federal
government that pays benefits to retirees, workers who become disabled and survivors of deceased workers.
Social Security's benefits include retirement income, disability income, Medicare and Medicaid, and death and
survivorship benefits. Social Security is one of the largest government programs in the world, paying out
hundreds of billions of dollars per year.
Retirement benefits may begin as early as age 62 at a discounted rate, and the amount you receive in retirement
increases from the 62 through 70. You do not have to take benefits at 70 years old, but there is no
monetary benefit to waiting beyond that age Social Security bases the amount of income one receives on
" average indexed monthly earnings" during the 35 years in which you earned the most. Spouses are also
eligible to receive Social Security benefits, even if they have limited or non-existent work histories. A divorced
spouse can also receive spousal benefits, if the marriage lasted 10 years or longer.](https://image.slidesharecdn.com/basiceconomics-230320164450-f2886f06/85/Basic-Economics-pdf-99-320.jpg)


![In economics, a price mechanism is the manner in which the prices of goods or services affect the supply and
demand of goods and services, principally by the price elasticity of demand. A price mechanism affects both
buyers and sellers who negotiate prices.[1]
A price mechanism, part of a market mechanism, comprises various
ways to match up buyers and sellers. Price mechanism is a mechanism where price plays a key role in directing
the activities of producers, consumers, resource suppliers. An example of a price mechanism uses announced bid
and ask prices. Generally speaking, when two parties wish to engage in trade, the purchaser will announce a
price he is willing to pay (the bid price) and seller will announce a price he is willing to accept (the ask price).
What is the 'Circular Flow Of Income'
The circular flow of income is a neoclassical economic model depicting how money flows through the
economy. In its simplest version, the economy is modeled as consisting only of households and firms. Money
flows to workers in the form of wages, and money flows back to firms in exchange for products. This simplistic
model suggests the old economic adage that supply creates its own demand.
Environmental damage or degradation is the deterioration of the environment through depletion of resources
such as air, water and soil; the destruction of ecosystems and the extinction of wildlife. It is defined as any
change or disturbance to the environment perceived to be deleterious or undesirable.
Environmental pollution is definitely a serious threat for the entire world in this age of development and
industrialization. The pollution levels in developed cities are rising at an alarming pace. Environmental
protection is the need of the hour, and countries across the world are working on developing technologies, and
imposing certain restrictions to reduce or control this grave problem. There have been many summits at the
international level between executives and ministers of different nations, to discuss and plan strategies for
reducing of all kinds of pollution.
Air Pollution
The disturbances caused to the composition of the air due to contamination of the atmosphere by human
activities is known as air pollution. Release of poisonous gases in the atmosphere because of vehicles,
construction activities, volcanic eruptions, smoke from industries, etc., are major causes of air pollution. It can
cause serious health problems, and hence, it is becomes important to have strict rules and regulations to control
the contamination of air. Mass education about the ill effects of air pollution can help to reduce it.
Water Pollution
The degradation and contamination of water by harmful chemicals and waste matter is termed as water
pollution. Chemical factories and manufacturing plants have caused excessive dumping of chemical waste into
water bodies, rendering the water useless for human needs. Consumption of such water can be harmful for the
public health. Though there are laws regarding water pollution, much needs to be done in this regard, to
maintain environmental balance and beauty.
Noise pollution
Any kind of undesirable and loud noise, which can be disturbing for human beings, as well as for other animals,
and causes health hazards, is known as noise pollution. This problem is caused mainly due to the noise of
airplanes, automobiles, machinery, construction activities, crowds, etc. This can be especially dangerous for
patients in critical conditions. Declaring silence zones at appropriate places, and proper implementation of the
rules can help to lower the adverse effects of noise pollution greatly.
Soil Pollution
Contamination of the soil or land because of improper or incorrect agricultural techniques, dumping of chemical](https://image.slidesharecdn.com/basiceconomics-230320164450-f2886f06/85/Basic-Economics-pdf-104-320.jpg)
![wastes by factories and industries, etc., are some of the sources of soil pollution. Deforestation in huge amounts
is also equally responsible for soil pollution. Certain mining activities are also believed to cause this problem.
More Types of Pollution
Radioactive Pollution:It is mainly caused by the improper handling of nuclear waste, accidents in nuclear
power plants and uranium mining.
Marine Pollution:It results due to contamination of the marine water bodies, and causes a drastic and long-term
impact on the marine flora and fauna, as well as on humans. Main sources of this problem are due to excessive
use of pesticides for agricultural purposes, crude oil leakage, factory sewage, etc.
Thermal Pollution:It is characterized by excessive heat, and is mainly the result of deforestation and power
plants.
Personal Pollution:This means the harmful effects of a bad and improper lifestyle on the human body, which
can lead to diseases and disorders. Smoking, drinking, and irregular eating habits are the main causes of
personal pollution.
To safeguard our environment, we must begin at a smaller and fundamental level for curbing pollution. Only
then will it make a difference to our planet, resulting in a significant reduction of environmental pollution.
What is a 'Pigovian Tax'
A Pigovian (Pigouvian) tax is a liquid waste, or effluent, fee which is assessed against private individuals or
businesses for engaging in activities that create adverse side effects. Adverse side effects are those costs which
are not included as a part of the product's market price.
Pigovian taxes were named after English economist Arthur C. Pigou, a significant contributor to early
externality theory in the Cambridge tradition.
What is 'Coase Theorem '
Coase theorem is a legal and economic theory that affirms that where there are complete competitive markets
with no transactions costs, an efficient set of inputs and outputs to and from production-optimal distribution are
selected, regardless of how property rights are divided. Further, the Coase theorem asserts that when property
rights are involved, parties naturally gravitate toward the most efficient and mutually beneficial outcome.
What are 'Property Rights'
Property rights refer to the theoretical and legal ownership of specific property by individuals and the ability to
determine how such property is used. In many countries, including the United States, individuals generally
exercise private property rights – the rights of private persons to accumulate, hold, delegate, rent or sell their
property. In economics, property rights form the basis for all market exchange, and the allocation of property
rights in a society affects the efficiency of resource use.
Islamic economics is a term used to refer to Islamic commercial jurisprudence.
Economic inequality is the difference found in various measures of economic well-being among individuals in
a group, among groups in a population, or among countries. Economic inequality sometimes refers to income
inequality, wealth inequality, or the wealth gap. Economists generally focus on economic disparity in three
metrics: wealth,income, and consumption.[1]
The issue of economic inequality is relevant to notions
of equity, equality of outcome, and equality of opportunity.
FIqh (religious law) has developed several traditional concepts having to do with economics. These included:
Zakat—the "charitable taxing of certain assets, such as currency, gold, or harvest, with an eye to allocating these
taxes to eight expenditures that are also explicitly defined in the Quran, such as aid to those in need."](https://image.slidesharecdn.com/basiceconomics-230320164450-f2886f06/85/Basic-Economics-pdf-105-320.jpg)
![ Gharar—"uncertainty". The presence of any element of excessive uncertainty, in a contract is prohibited.
Riba—"referred to as usury (modern Islamic economists reached consensus that Riba is any kind of interest,
rather than just usury)"
Another source lists "general rules" include prohibition of Riba, Gharar, and also
Qimar (gambling) and
the encouragement of Taa‘won (mutual cooperation)
"the overriding doctrine of fairness in commercial dealings is established."
These concepts, like others in Islamic law, came from study of the Quran and ahadith—or as one observer put it,
were
constructed on the basis of isolated prescriptions, anecdotes, examples, words of the Prophet, all gathered
together and systematized by commentators according to an inductive, casuistic method.
Islamic taxes are taxes sanctioned by Islamic law. They are based on both "the legal status of taxable land" and
on "the communal or religious status of the taxpayer".
Islamic taxes include
zakat - one of the five pillars of Islam. Only imposed on Muslims, it is generally described as a 2.5% tax on
savings to be donated to the Muslim poor and needy.[1][2]
It was a tax collected by the Islamic state.
jizya - a per capita yearly tax historically levied by Islamic states on certain non-Muslim subjects—dhimmis—
permanently residing in Muslim lands under Islamic law, the tax excluded the poor, women, children and the
elderly.[1][3][4][5]
(see below)
kharaj - a land tax at first imposed only on non-Muslims but which was later imposed on Muslims as well.[1]
ushr - a 10% tax on the harvests of irrigated land and 10% tax on harvest from rain-watered land and 5% on
Land dependent on well water.[2]
The term has also been used for a 10% tax on merchandise imported from
states that taxed the Muslims on their products.[6]
Caliph `Umar ibn Al-Khattāb was the first Muslim ruler to
levy ushr
Project planning is part of project management, which relates to the use of schedules such as Gantt charts to
plan and subsequently report progress within the project environment.
In project management, a schedule is a listing of a project's milestones, activities, and deliverables, usually with
intended start and finish dates. Those items are often estimatedby other information included in the project
schedule of resource allocation, budget, task duration, and linkages of dependencies and scheduled events. A
schedule is commonly used in the project planning and project portfolio management parts of project
management. Elements on a schedule may be closely related to the work breakdown structure(WBS) terminal
elements, the Statement of work, or a Contract Data Requirements List.
Definition of 'Risk Management'
In the financial world, risk management is the process of identification, analysis and acceptance or mitigation of
uncertainty in investment decisions. Essentially, risk management occurs when an investor or fund manager
analyzes and attempts to quantify the potential for losses in an investment and then takes the appropriate action
(or inaction) given his investment objectives and risk tolerance.
Broadly speaking, a risk assessment is the combination effort of 1. identifying and analyzing potential (future)
events that may negatively impact individuals, assets, and/or the environment (i.e., risk analysis); and 2. making
judgements "on the tolerability of the risk on the basis of a risk analysis" while considering influencing factors
(i.e., risk evaluation).[1][2]
Put in simpler terms, a risk assessment analyzes what can go wrong, how likely it is to
happen, what the potential consequences are, and how tolerable the identified risk is.[1]
As part of this process,
the resulting determination of risk may be expressed in a quantitative or qualitative fashion. The risk assessment](https://image.slidesharecdn.com/basiceconomics-230320164450-f2886f06/85/Basic-Economics-pdf-106-320.jpg)


