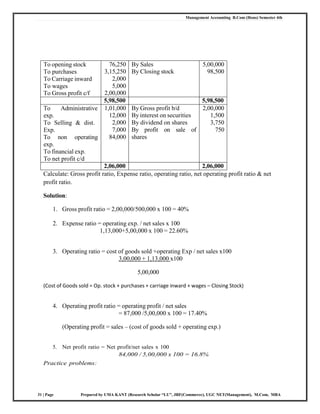
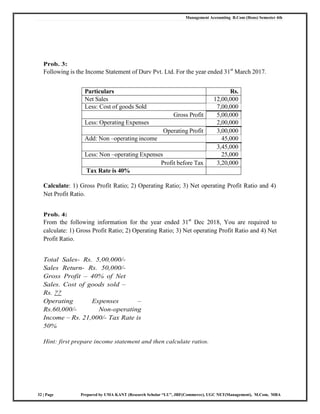
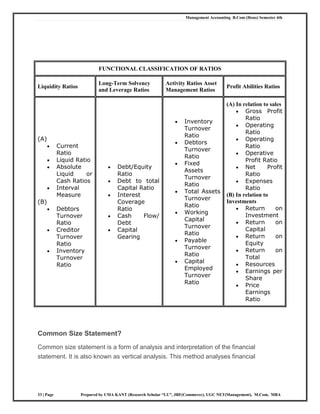
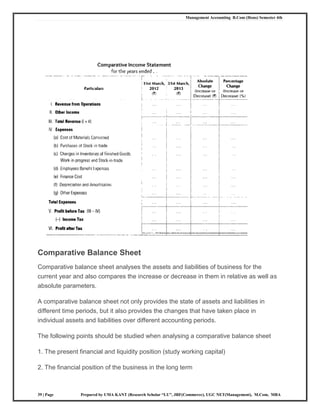
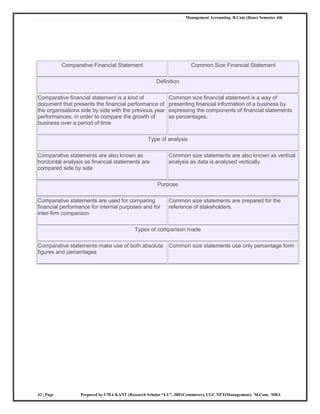
SlideShare a Scribd company logo
1 of 42
Download to read offline
Management Accounting B.Com (Hons) Semester 4th
1 | Page Prepared by UMA KANT (Research Scholar “LU”, JRF(Commerce), UGC NET(Management), M.Com, MBA
Management Accounting
B.Com (Hons) Semester - 4th
Unit -4
University of Lucknow,
Lucknow
Financial Statement Analysis:
The term ‗financial analysis‘, also known as analysis and interpretation of
financial statements‘, refers to the process of determining financial strengths
and weaknesses of the firm by establishing strategicrelationship between the
items of the balance sheet, profit and loss account and other operative data.
―Analyzing financial statements,‖ according to Metcalf and Titard, ―is a
process of evaluating therelationship between component parts of a financial
statement to obtain a better understanding of a firm‘s position and
performance.‖
In the words of Myers, ―Financial statement analysis is largely a study of
relationship among the various financial factors in a business as disclosed by
a single set-of statements and a study of the trend of these factors as shown
in a series of statements.‖
Management Accounting B.Com (Hons) Semester 4th
2 | Page Prepared by UMA KANT (Research Scholar “LU”, JRF(Commerce), UGC NET(Management), M.Com, MBA
Objectives and Importance of Financial Statement Analysis:
The primary objective of financial statement analysis is to understand and
diagnose the information contained in financial statement with a view to
judge the profitability and financial soundness of the firm, and to make
forecast about future prospects of the firm. The purpose of analysis depends
upon the person interested in such analysis and his object.
However, the following purposes or objectives of financial
statements analysis may be stated to bring out the significance
of such analysis:
1) To assess the earning capacity or profitability of the firm.
2) To assess the operational efficiency and managerial effectiveness.
3) To assess the short term as well as long term solvency position of the
firm.
4) To identify the reasons for change in profitability and financial
position of the firm.
5) To make inter-firm comparison.
6) To make forecasts about future prospects of the firm.
7) To assess the progress of the firm over a period of time.
8) To help in decision making and control.
9) To guide or determine the dividend action.
10) To provide important information for granting credit.
Management Accounting B.Com (Hons) Semester 4th
3 | Page Prepared by UMA KANT (Research Scholar “LU”, JRF(Commerce), UGC NET(Management), M.Com, MBA
Parties Interested in Financial Analysis:
The following parties are interested in the analysis of financial
statements:
1) Investors or potential investors.
2) Management.
3) Creditors or suppliers.
4) Bankers and financial institutions.
5) Employees.
6) Government.
7) Trade associations.
8) Stock exchanges.
9) Economists and researchers.
10) Taxation authorities
Limitations of Financial Statement Analysis:
Some of the important limitations of financial analysis are, however,
summed up as below:
1) It is only a study of interim reports
2) Financial analysis is based upon only monetary information and
non-monetary factors areignored.
3) It does not consider changes in price levels.
4) As the financial statements are prepared on the basis of a going
concern, it does not give exact position. Thus accounting concepts
and conventions cause a serious limitation to financial analysis.
Management Accounting B.Com (Hons) Semester 4th
4 | Page Prepared by UMA KANT (Research Scholar “LU”, JRF(Commerce), UGC NET(Management), M.Com, MBA
5) Changes in accounting procedure by a firm may often make financial
analysis misleading.
6) Analysis is only a means and not an end in itself. The analyst has to
make interpretation and draw his own conclusions. Different people
may interpret the same analysis in different ways.
Tools or Techniques of Financial Statement Analysis
1) Comparative Statement or Comparative Financial and Operating
Statements.
2) Common Size Statements.
3) Trend Ratios or Trend Analysis.
4) Average Analysis.
5) Statement of Changes in Working Capital.
6) Fund Flow Analysis.
7) Cash Flow Analysis.
8) Ratio Analysis.
9) Cost Volume Profit Analysis
A brief explanation of the tools or techniques of financial statement analysis
presented below.
1) Comparative Statements
Comparative statements deal with the comparison of different items of the
Profit and Loss Account and Balance Sheets of two or more periods.
Separate comparative statements are prepared for Profit and Loss Account as
Comparative Income Statement and for Balance Sheets.
As a rule, any financial statement can be presented in the form of
Management Accounting B.Com (Hons) Semester 4th
5 | Page Prepared by UMA KANT (Research Scholar “LU”, JRF(Commerce), UGC NET(Management), M.Com, MBA
comparative statement such as comparative balance sheet, comparative profit
and loss account, comparative cost of production statement, comparative
statement of working capital and the like.
2) Comparative Income Statement
Three important information are obtained from the Comparative Income
Statement. They are Gross Profit, Operating Profit and Net Profit. The
changes or the improvement in the profitabilityof the business concern is find
out over a period of time. If the changes or improvement is not satisfactory,
the management can find out the reasons for it and some corrective action can
betaken.
3) Comparative Balance Sheet
The financial condition of the business concern can be find out by preparing
comparative balance sheet. The various items of Balance sheet for two
different periods are used. The assets are classified as current assets and
fixed assets for comparison. Likewise, the liabilitiesare classified as current
liabilities, long term liabilities and shareholders‘ net worth. The term
shareholders‘ net worth includes Equity Share Capital, Preference Share
Capital, Reserves and Surplus and the like.
4) Common Size Statements
A vertical presentation of financial information is followed for preparing
common-size statements. Besides, the rupee value of financial statement
contents are not taken into consideration. But, only percentage is considered
for preparing common size statement.
The total assets or total liabilities or sales is taken as 100 and the balance
Management Accounting B.Com (Hons) Semester 4th
6 | Page Prepared by UMA KANT (Research Scholar “LU”, JRF(Commerce), UGC NET(Management), M.Com, MBA
items are compared to the total assets, total liabilities or sales in terms of
percentage. Thus, a common size statement shows the relation of each
component to the whole. Separate common size statement is prepared for
profit and loss account as Common Size Income Statement and for balance
sheet as Common Size Balance Sheet.
5) Trend Analysis
The ratios of different items for various periods are find out and then
compared under this analysis. The analysis of the ratios over a period of years
gives an idea of whether the businessconcern is trending upward or downward.
This analysis is otherwise called as Pyramid Method.
6) Statement of Changes in Working Capital
The extent of increase or decrease of working capital is identified by
preparing the statement of changes in working capital. The amount of net
working capital is calculated by subtracting the sum of current liabilities
from the sum of current assets. It does not detail the reasons for changes in
working capital.
7) Fund Flow Analysis
Fund flow analysis deals with detailed sources and application of funds of the
business concern for a specific period. It indicates where funds come from
and how they are used during the period under review. It highlights the
changes in the financial structure of the company.
8) Cash Flow Analysis
Cash flow analysis is based on the movement of cash and bank balances. In
other words, the movement of cash instead of movement of working capital
Management Accounting B.Com (Hons) Semester 4th
7 | Page Prepared by UMA KANT (Research Scholar “LU”, JRF(Commerce), UGC NET(Management), M.Com, MBA
would be considered in the cash flow analysis. There are two types of cash
flows. They are actual cash flows and notional cashflows.
9) Ratio Analysis
Ratio analysis is an attempt of developing meaningful relationship between
individual items (or group of items) in the balance sheet or profit and loss
account. Ratio analysis is not only useful to internal parties of business
concern but also useful to external parties. Ratio analysis
highlights the liquidity, solvency, profitability and capital gearing.
Funds Flow Statement:
Funds flow statement is a statement which discloses the analytical
information about the different sources of a fund and the application of the
same in an accounting cycle. It deals with the transactions which change
either the amount of current assets and current liabilities (in the form of
decrease or increase in working capital) or fixed assets, long-term loans
including ownership fund.
It gives a clear picture about the movement of funds between the opening
and closing dates of the Balance Sheet. It is also called the Statement of
Sources and Applications of Funds, Movement of Funds Statement; Where
Got—Where Gone Statement: Inflow and Outflow of Fund Statement, etc.
No doubt, Funds Flow Statement is an important indicator of financial
analysis and control. It is valuable and also helps to determine how the funds
are financed. The financial analyst can evaluate the future flows of a firm on
Management Accounting B.Com (Hons) Semester 4th
8 | Page Prepared by UMA KANT (Research Scholar “LU”, JRF(Commerce), UGC NET(Management), M.Com, MBA
the basis of past data.
This statement supplies an efficient method for the financial manager in
order to assess the:
a. Growth of the firm,
b. Its resulting financial needs, and
c. To determine the best way to finance those needs.
Objective of preparing a Funds Flow Statement is multifaceted:
a. Revealing Sources and Applications of Funds: It clarifies the important
items related to the sources and uses of funds for fixed assets, long-term
loans, and capital, indicating whether assets derived from business activities
are being utilized properly.
b. Detailing Fund Acquisition and Utilization: It shows how funds are
acquired, whether through asset disposal, issuing shares or debentures, loans,
or normal business activities, and how these funds are utilized, such as for
acquiring fixed assets, repaying loans, or paying taxes and dividends.
c. Informing Management for Budgeting and Policy Formulation: It assists
management in preparing budgets and formulating future operational
policies based on insights into fund utilization and acquisition.
The significance of Funds Flow Statements can be summarized as follows:
a. Analysis of Financial Statement: It provides a dynamic view of financial
activities, explaining the causes and effects of changes in a firm's financial
position, addressing questions like changes in working capital, asset sales,
Management Accounting B.Com (Hons) Semester 4th
9 | Page Prepared by UMA KANT (Research Scholar “LU”, JRF(Commerce), UGC NET(Management), M.Com, MBA
dividend payments, utilization of profits, debt repayment, and sources of
increased working capital.
b. Guiding Dividend Policy: It helps firms make sound dividend decisions,
even in the presence of sufficient profits but a lack of liquid resources.
c. Allocation of Resources: It aids management in making informed decisions
about resource allocation by projecting future fund flows.
d. Future Planning: It acts as a guide for future financial provision, enabling
firms to anticipate and avoid potential financial problems.
e. Working Capital Appraisal: It helps assess the efficient use of working
capital and suggests improvements based on present challenges.
Basis for
comparison
Cash flow Fund flow
Meaning A cash flow statement is a
statement showing the inflows and
outflows of cash and cash
equivalents over a period.
A fund flow statement is a
statement showing the changes
in the financial position of
the entity in different
accounting years.
Purpose
o
fPreparation
To show the reasons for
movements in the cash at the
beginning and at the end of the
accounting period.
To show the reasons for the
changes in the financial
position, with respect to
previous year and current
accounting year.
Management Accounting B.Com (Hons) Semester 4th
10 | Page Prepared by UMA KANT (Research Scholar “LU”, JRF(Commerce), UGC NET(Management), M.Com, MBA
Basis Cash Basis of Accounting. Accrual Basis of Accounting.
Analysis Short Term Analysis of cash
planning.
Long Term Analysis of
financialplanning
Discloses Inflows and Outflows of Cash Sources and applications of
funds
Opening
an
d closing
balance
Contains opening and closing
balance of cash and cash
equivalents.
Does not contains opening
balance of cash and cash
equivalents.
Part of
Financial
Statement
Yes No
Cash Flow Statement
A cash flow statement provides information about the changes in cash and
cash equivalents of a business by classifying cash flows into operating,
investing and financing activities. It is a key report to be prepared for each
accounting period for which financial statements are presented by an
enterprise.
Monitoring the cash situation of any business is the key. The income
statement would reflect the profits but does not give any indication of the
cash components. The important information of what the business has been
Management Accounting B.Com (Hons) Semester 4th
11 | Page Prepared by UMA KANT (Research Scholar “LU”, JRF(Commerce), UGC NET(Management), M.Com, MBA
doing with the cash is provided by the cash flow statement. Like the other
financial statements, the cash flow statement is also usually drawn up
annually, but can be drawn up more often. It is noteworthy that cash flow
statement covers the flows of cash over a period of time (unlike the balance
sheet that provides a snapshot of the business at a particular date). Also, the
cashflow statement can be drawn up in a budget form and later compared to
actual figures.
Objectives of preparing Cash Flow Statement
1) Cash flow statement shows inflow and outflow of cash and cash
equivalents from various activities of a company during a specific
period under the main heads i.e., operating activities, investing
activities and financing activities.
2) Information through the Cash Flow statement is useful in assessing the
ability of any enterprise to generate cash and cash equivalents and the
needs of the enterprise to utilize those cash flows.
3) Taking economic decisions requires an evaluation of the ability of an
enterprise to generate cash and cash equivalents, which is provided by
the cash flow statement
Cash and cash equivalents generally consist of the following:
o Cash in hand
o Cash at bank
o Short term investments that are highly liquid
o Bank overdrafts comprise an integral element of the organization‘s treasury
management
Management Accounting B.Com (Hons) Semester 4th
12 | Page Prepared by UMA KANT (Research Scholar “LU”, JRF(Commerce), UGC NET(Management), M.Com, MBA
Classification of activities:
Cash flow activities are to be classified into three categories :This
is done to show separately the cash flows generated / used by these activities,
thereby helping to assess the impact of these activities on the financial
position and cash and cashequivalents of an enterprise.
1) Operating activities
2) Investing activities
3) Financing activities
Cash from Operating Activities:
Operating activities are the activities that comprise of the primary /
main activities of an enterprise during an accounting period. For
example, for a garment manufacturing company, operating activities
include procurement of raw material, sale of garments, incurrence of
manufacturing expenses, etc. These are the principal revenue
generating activities of the enterprise.
Profit before tax as presented in the income statement could be used
as a starting point to calculate the cash flows from operating activities.
Cash Inflows from operating activities:
o Cash receipts from sale of goods and rendering services.
o Cash receipts from fees, royalties, commissions and other revenues.
Management Accounting B.Com (Hons) Semester 4th
13 | Page Prepared by UMA KANT (Research Scholar “LU”, JRF(Commerce), UGC NET(Management), M.Com, MBA
Cash Outflows from operating activities:
o Cash payments to suppliers for goods and services.
o Cash payments of income taxes unless they can be specifically
identified with financing and investing activities.
Following adjustments are required to be made to the profit
before tax to arriveat the cash flow from operations:
o Elimination of non cash expenses (e.g. depreciation,
amortization, impairment losses, bad debts written off, etc)
o Removal of expenses to be classified elsewhere in the cash
flow statement (e.g. interest expense should be classified under
financing activities)
o Removal of income to be presented elsewhere in the cash
flow statement (e.g. dividend income and interest income should
be classified under investing activities unless in case of forexample an
investment bank)
o Elimination of non cash income (e.g. gain on revaluation of
investments)
o The amount of cash from operations indicates the internal
solvency level of the company. It is
a key indicator of the extent to which the operations of the
enterprise have generated sufficient cash flows to maintain its
operating potential.
Management Accounting B.Com (Hons) Semester 4th
14 | Page Prepared by UMA KANT (Research Scholar “LU”, JRF(Commerce), UGC NET(Management), M.Com, MBA
Cash from Investing Activities:
Cash flow from investing activities includes the movement in cash flows
owing to the purchase and sale of assets. It relates to purchase and sale of
long-term assets or fixed assets such as machinery, furniture, land and
building, etc.
a) Cash Outflows from investing activities
b) Cash payments to acquire fixed assets including intangibles and capitalized
R&D.
c) Cash advances and loans made to third party (other than advances and
loans made by a financial enterprise wherein it is operating activities).
d) Cash payments to acquire shares, warrants or debt instruments of
other enterprises other than the instruments those held for trading
purposes.
Cash Inflows from investing activities
a) Cash receipt from disposal of fixed assets including intangibles.
b) Cash receipt from the repayment of advances or loans made to third
parties (except in case offinancial enterprise).
c) Dividend received from investments in other enterprises.
d) Cash receipt from disposal of shares, warrants or debt instruments of
other enterprises exceptthose held for trading purposes.
Cash from Financing Activities:
It includes financing activities related to long-term funds or capital of an
enterprise. Financing activitiesare activities that result in changes in the size
and composition of the owners‘ capital and borrowings of the enterprise.
Management Accounting B.Com (Hons) Semester 4th
15 | Page Prepared by UMA KANT (Research Scholar “LU”, JRF(Commerce), UGC NET(Management), M.Com, MBA
e.g., cash proceeds from issue of equity shares, debentures, raising long-term
loans, repayment of bank loans, etc.
Cash Inflows from financing activities
o Cash proceeds from issuing shares (equity / preference).
o Cash proceeds from issuing debentures, loans, bonds and other short/
long-term borrowings.
Cash Outflows from financing activities:
o Cash repayments of amounts borrowed.
o Interest paid on debentures and long-term loans and advances.
o Dividends paid on equity and preference capital.
Main heads of Cash Flow statement:
Cash Flow Statement (Main heads only)
(A)Cash flows from operating activities xxx
(B)Cash flows from investing activities xxx
(C)Cash flows from financing activities xxx
Net increase (decrease) in cash and cash xxx equivalents (A + B + C)
+ Cash and cash equivalents at the beginning xxx = Cash and cash
equivalents at the end xxxx
Methods of preparing the Cash Flow Statements
Operating activities are the main source of revenues and expenditures,
thereby cash flow from thesame needs to be ascertained. The cash flow can
Management Accounting B.Com (Hons) Semester 4th
16 | Page Prepared by UMA KANT (Research Scholar “LU”, JRF(Commerce), UGC NET(Management), M.Com, MBA
be reported through two ways:
Direct method that discloses the major classes of gross cash receipts and
cash payments and Indirect method that has the net profit or loss
adjusted for effects of
1) transactions of a non-cash nature,
2) any deferrals or accruals of past/future operating cash receipts and
3) items of income or expenses associated with investing or financing
cash flows.
Direct method:
In the direct method, the major heads of cash inflows and outflows (such as cash
received from trade receivables, employee benefits, expenses paid, etc.) are to be
considered.
As the different line items are recorded on accrual basis in statement of profit
and loss, certainadjustments are to be made to convert them into cash basis such
as the following:
1) Cash receipts from customers = Revenue from operations + Trade
receivables in the beginning
– Trade receivables in the end.
2)
Cash payments to suppliers = Purchases + Trade Payables in the
beginning – Trade Payables inthe end.
Management Accounting B.Com (Hons) Semester 4th
17 | Page Prepared by UMA KANT (Research Scholar “LU”, JRF(Commerce), UGC NET(Management), M.Com, MBA
3) Purchases = Cost of Revenue from Operations – Opening Inventory +
Closing Inventory.
4) Cash expenses = Expenses on accrual basis + Prepaid expenses
in the beginning and Outstanding expenses in the end – Prepaid
expenses in the end and Outstanding expenses in the beginning.
Purpose & Importance of Cash Flow Statements
1) Statement of cash flows provides important insights about the
liquidity and solvency of a company which are vital for survival and
growth of any organization.
2) It enables analysts to use the information about historic cash flows
for projections of future cash flows of an entity on which to base
their economic decisions.
3) By summarizing key changes in financial position during a period,
cash flow statement serves to highlight priorities of management.
4) Comparison of cash flows of different entities helps reveal the
relative quality of their earnings since cash flow information is more
objective as opposed to the financial performance reflected in
income statement.
Advantages of Cash Flow Statement
1) Cash Flow Statements help in knowing the liquidity / actual cash
position of the company which funds flow and P&L are unable to
specify.
Management Accounting B.Com (Hons) Semester 4th
18 | Page Prepared by UMA KANT (Research Scholar “LU”, JRF(Commerce), UGC NET(Management), M.Com, MBA
2) As the liquidity position is known, any shortfalls can be arranged for
or excess can be used forthe growth of the business
3) Any discrepancy in the financial reporting can be gauged through the
cash flow statement bycomparing the cash position of both.
4) Cash is the basis of all financial operations. Therefore, a projected
cash flow statement will enable the management to plan and control
the financial operations properly.
5) Cash Flow analysis together with the ratio analysis helps measure the
profitability and financialposition of business.
6) Cash flow statement helps in internal financial management as it is
useful in formulation offinancial plans.
Disadvantages of Cash Flow Statement
1) Through the cash flow statement alone, it is not possible to arrive at
actual P&L of the company as it shows only the cash position. It has
limited usage and in isolation it is of no use and requires BL, P&L for
its projections. Cash flow statement does not disclose net income from
operations. Therefore, it cannot be a substitute for income statement
2) The cash balance as shown by the cash flow statement may not
represent the real liquidity position of the business because it can be
easily influenced by postponing the purchases and other payments
3) Cash flow statement cannot replace the funds flow statement. Each of
the two has a separate function to perform.
Management Accounting B.Com (Hons) Semester 4th
19 | Page Prepared by UMA KANT (Research Scholar “LU”, JRF(Commerce), UGC NET(Management), M.Com, MBA
Ratio Analysis
Meaning:
A ratio is a mathematical number calculated as a reference to
relationship of two or more numbers and can be expressed as a
fraction, proportion, percentage and a number of times. When the
number is calculated by referring to two accounting numbers derived
from the financial statements, it is termed as accounting ratio.
It needs to be observed that accounting ratios exhibit relationship, if
any, between accounting numbers extracted from financial statements.
Ratios are essentially derived numbers and their efficacy depends a
great deal upon the basic numbers from which they are calculated.
Further, a ratio must be calculated using numbers which are
meaningfully correlated.
Objectives of Ratio Analysis:
Ratio analysis is indispensable part of interpretation of results
revealed by the financial statements. It provides users with crucial
financial information and points out the areas which require
investigation. Ratio analysis is a technique which involves
regrouping of data by application of arithmetical relationships,
though its interpretation is a complex matter. It requires a fine
understanding of the way and the rules used for preparing financial
Management Accounting B.Com (Hons) Semester 4th
20 | Page Prepared by UMA KANT (Research Scholar “LU”, JRF(Commerce), UGC NET(Management), M.Com, MBA
statements. Once done effectively, it provides a lot of information
which helps the analyst:
1. To know the areas of the business which need more attention;
2. To know about the potential areas which can be improved with
the effort in the desired direction;
3. To provide a deeper analysis of the profitability, liquidity,
solvency and efficiency levels in the business;
4. To provide information for making cross-sectional analysis
by comparing the performance with the best industry standards;
and
5. To provide information derived from financial statements
useful for making projections and estimates for the future.
Importance (or Advantages) of Ratio Analysis:
1. Helps to understand efficacy of decisions: The ratio analysis
helps you to understand whether the business firm has taken the
right kind of operating, investing and financing decisions. It
indicates how far they have helped in improving the performance.
2. Simplify complex figures and establish relationships:
Ratios help in simplifying the complex accounting figures and
bring out their relationships. They help summarise the financial
information effectively and assess the managerial efficiency, firm‘s
credit worthiness, earning capacity, etc.
3. Helpful in comparative analysis: The ratios are not be
Management Accounting B.Com (Hons) Semester 4th
21 | Page Prepared by UMA KANT (Research Scholar “LU”, JRF(Commerce), UGC NET(Management), M.Com, MBA
calculated for one year only. When many year figures are kept
side by side, they help a great deal in exploring the trends visible in
the business. The knowledge of trend helps in making projections
about the business which is a very useful feature.
4. Identification of problem areas: Ratios help business in
identifying the problem areas as well as the bright areas of the
business. Problem areas would need more attention and bright
areas will need polishing to have still better results.
5. Enables SWOT analysis: Ratios help a great deal in
explaining the changes occurring in the business. The information
of change helps the management a great deal in understanding the
current threats and opportunities and allows business to do its own
SWOT (Strength-Weakness-Opportunity-Threat) analysis.
6. Various comparisons: Ratios help comparisons with certain
bench marks to assess as to whether firm‘s performance is better
or otherwise. For this purpose, the profitability, liquidity, solvency,
etc. of a business, may be compared: (i) over a number of
accounting periods with itself (Intra-firm Comparison/Time Series
Analysis), (ii) with other business enterprises (Inter-firm
Comparison/Cross- sectional Analysis) and (iii) with standards set
for that firm/industry (comparison with standard (or industry
expectations).
Limitations of Ratio Analysis:
Management Accounting B.Com (Hons) Semester 4th
22 | Page Prepared by UMA KANT (Research Scholar “LU”, JRF(Commerce), UGC NET(Management), M.Com, MBA
1. Lack of Precision and Finality: Accounting data may appear precise, but they are
influenced by recorded facts, conventions, and personal judgments, leading to
potential inaccuracies. Profit figures, for example, are subjective and dependent on
the competence and integrity of those involved, which can obscure the true state of
affairs in a business.
2. Ignoring Price-level Changes: Financial accounting typically assumes stable
money values, disregarding the impact of inflation or deflation. In reality, changes
in the price level render comparisons across different accounting periods
meaningless.
3. Neglecting Qualitative Aspects: While accounting focuses on quantitative
aspects, qualitative factors such as character, honesty, and managerial ability can
significantly affect business outcomes. Ratios derived from purely quantitative
analysis may fail to capture these qualitative dimensions.
4. Variations in Accounting Practices: Differing accounting policies among
businesses, such as inventory valuation methods and depreciation calculation,
hinder cross-sectional analysis and make valid comparisons challenging.
5. Limited Forecasting Ability: Historical analysis alone is insufficient for accurate
future forecasting. Predictions require consideration of non-financial factors, and
reliance solely on past financial data may lead to unreliable forecasts.
6. Inability to Provide Solutions: Accounting data serve primarily as indicators and
whistleblowers, highlighting issues rather than offering solutions to problems.
They lack the capacity to resolve underlying issues within a business.
Balance Sheet Ratios:
Management Accounting B.Com (Hons) Semester 4th
23 | Page Prepared by UMA KANT (Research Scholar “LU”, JRF(Commerce), UGC NET(Management), M.Com, MBA
1. Current Ratio = Current Assets
Current Liabilities
2. Liquid Ratio = Quick (Liquid) Assets
Quick (Liquid) Liabilities
 Liquid assets are those which are readily converted into cash and
will include cash/ bank balances, bills receivable, sundry debtors and
short term investments. Inventories and Prepaid Expenses are not
included in liquid assets.
 Liquid Liabilities includes all items of current liabilities except Bank
Overdraft.
3. Proprietary Ratio = Proprietors funds
Total Assets
 Proprietor fund = Share capital(Equity & Pref.) + Retained earnings (less
loss if any) -Fictitious assets
 Total Assets = Fixed Assets + Current Assets-Fictitious assets
4. Stock Working capital Ratio = Closing Stock
Working Capital
 Working Capital = Current assets – Current liabilities
5. Capital Gearing Ratio = Fixed Interest & Dividend Bearing Funds
Equity Share holders fund
 Equity Share holders fund= Equity Sh. Capital + Retained earnings
(less loss if any) -Fictitious assets
6. Debt Equity Ratio = Long Term Debt
Proprietors Fund
Prob1:
Management Accounting B.Com (Hons) Semester 4th
24 | Page Prepared by UMA KANT (Research Scholar “LU”, JRF(Commerce), UGC NET(Management), M.Com, MBA
Liabilities Rs. Assets Rs.
Equity Share Capital 5,00,000 Land & Building 1,00,000
Preference share capital 2,00,000 Machinery 4,00,000
General Reserve 1,00,000 Furniture 50,000
Secured Loan 3,00,000 Inventory 3,00,000
Sundry Creditors 1,00,000 Sundry Debtors
Cash/Bank Balance
3,00,000
50,000
12,00,00
0
12,00,00
0
Calculate Following Ratios from the above balance sheet:
1. Current Ratio
2. Liquid Ratio
3. Proprietary Ratio
4. Stock Working capital Ratio
5. Capital Gearing Ratio
6. Debt Equity Ratio
Solution:
1.
Current
ratio = Current assets/current liabilities
Current assets = inventory
(3,00,000)+ s.debtors(3,00,000) + cash
balance(50,000) = 6,50,000
Current liabilities = S.Creditors = 1,00,000
= 6,50,000/1,00,000
= 6.5:1
2. Liquid ratio = liquid assets/liquid liabilities
liquid assets = s.debtors(3,00,000) + cash
balance(50,000)
= 3,50,000
liquid liabilities = S.Creditors = 1,00,000
= 3,50,000/1,00,000
= 3.5:1
3. Proprietary Ratio Proprietors fund / total assets
Proprietor fund = Share capital(Equity & Pref.) +
Retained
earnings (less loss if any) -Fictitious assets
= 5,00,000 + 2,00,000 + 100,000 = 8,00,000
Management Accounting B.Com (Hons) Semester 4th
25 | Page Prepared by UMA KANT (Research Scholar “LU”, JRF(Commerce), UGC NET(Management), M.Com, MBA
Total Assets = Fixed Assets + Current Assets-
Fictitious
assets
= 12,00,000
= 800,000/12,00,000
= 0.66 : 1
4. Stock
Workin
g
= closing stock / working capital
capital Ratio = 300,000 / 5,50,000
= 0.55:1
Working capital (CA-CL= 6,50,000 – 1,00,000 =
5,50,000)
5.
Capital
Gearin
g
= Fixed Interest & Dividend Bearing Funds
Ratio Equity Share holders fund
Fixed Interest & Dividend Bearing Funds = pref
sh.
(2,00,000) + secured loan (3,00,000) = 500,000
Equity Share holders fund = Eq. Shares (5,00,000) +
GR
(100,000) = 600,000
= 500,000 / 600,000
= 0.83 : 1
6. Debt Equity =Long Term Debt
Ratio Proprietors Fund
Long term debt = secured loan (300,000)
= 3,00,000/8,00,000
= 0.38 : 1
Prob 2:
Liabilities Rs. Assets Rs.
Equity Share Capital 2,00,000 Machinery 5,92,000
12% Preference share capital 3,60,000 Investment 2,24,000
General Reserve 1,40,000 Stock 2,02,000
16% debentures 2,40,000 Bills Receivable 40,000
Trade payable 2,44,000 S. Debtors 98,000
Bank overdraft 40,000 Cash and Bank 76,000
Provision for Income Tax 36,000 Profit & Loss A/c 28,000
12,60,00
0
12,60,00
0
Calculate Following Ratios from the above balance sheet:
1. Current Ratio
Management Accounting B.Com (Hons) Semester 4th
26 | Page Prepared by UMA KANT (Research Scholar “LU”, JRF(Commerce), UGC NET(Management), M.Com, MBA
2. Liquid Ratio
3. Proprietary Ratio
4. Capital Gearing Ratio
5. Debt Equity Ratio
Solution:
1. Current ratio = Current assets/current liabilities
Current assets = stock (2,02,000)+ BR
(40,000)+ s.debtors(98000) + cash
balance(76,000) = 4,16,000
Current liabilities = trade payable (2,44,000) +
Bank o/d(40,000) + provision for income tax (36,000) =
320,000
= 4,16,000/3,20,000
= 1.3:1
2. Liquid ratio = liquid assets/liquid liabilities
liquid assets = BR (40,000)+ s.debtors(98000) +
cash balance(76,000) = 2,14,000
liquid liabilities = trade payable (2,44,000) provision
for income tax (36,000) = 2,80,000
= 2,14,000/2,80,000
= 0.76:1
3. Proprietary Ratio Proprietors fund / total assets
Proprietor fund = Share capital(Equity & Pref.) +
Retained
earnings (less loss if any) -Fictitious assets
= 2,00,000 + 3,60,000 + 140,000-28,000 = 6,72,000
Total Assets = Fixed Assets + Current Assets-
Fictitious
assets
= 12,60,000 – 28,000 = 12,32,000
= 6,72,000/12,32,000
= 0.55 : 1
Management Accounting B.Com (Hons) Semester 4th
27 | Page Prepared by UMA KANT (Research Scholar “LU”, JRF(Commerce), UGC NET(Management), M.Com, MBA
4. Capital
Gearin
g Ratio
= Fixed Interest & Dividend Bearing Funds
Equity Share holders fund
Fixed Interest & Dividend Bearing Funds = pref
sh. (3,60,000) + debentures (2,40,000) = 6,00,000
Equity Share holders fund = Eq. Shares (2,00,000) +
GR
(1,40,000) – profit & loss (28000) = 3,12,000
= 600,000 / 3,12,000
= 1.92 : 1
5. Debt
Equit
y Ratio
=Long Term Debt
Proprietors Fund
Long term debt = debentures (2,40,000)
= 2,40,000/6,70,000
= 0.36 : 1
Practice problems:
Prob 3:
Liabilities Rs. Assets Rs.
Equity Share Capital 1,00,000 Furniture 2,96,000
10% Preference share capital 1,80,000 Trademarks 1,12,000
General Reserve 70,000 Stock 1,01,000
15% debentures 1,20,000 Bills Receivable 20,000
Trade payable 1,22,000 Trade Receivables 49,000
Bank overdraft 20,000 Cash and Bank 38,000
Provision for Tax 18,000 Profit & Loss A/c 14,000
6,30,000 6,30,000
Calculate Following Ratios from the above balance sheet:
1. Current Ratio
2. Liquid Ratio
3. Proprietary Ratio
4. Capital Gearing Ratio
5. Debt Equity Ratio
Prob 4:
The Balance Sheet of Trident Limited as on 31‐12‐2017 was as follow:
Liabilities Rs. Assets Rs.
Equity Share Capital 40,000 Plant & Machinery 24,000
Capital Reserve 8,000 Land & Building 40,000
Profit & Loss A/c 12,000 Furniture & Fixtures 16,000
Management Accounting B.Com (Hons) Semester 4th
28 | Page Prepared by UMA KANT (Research Scholar “LU”, JRF(Commerce), UGC NET(Management), M.Com, MBA
7% Mortgage Loan 32,000 Stock 12,000
Creditors 16,000 Debtors 12,000
Bank overdraft 4,000 Investment (Short-term) 4,000
Provision for Income Tax 8,000 Cash at bank 12,000
1,20,000 1,20,000
You are required to Calculate Following Ratios:
1. Current Ratio (1.43:1)
2. Liquid Ratio (1.17:1)
3. Proprietary Ratio (0.5: 1) or 50%)
4. Capital Gearing Ratio (0.53: 1)
5. Debt Equity Ratio (0.53: 1) or 53%)
Prob 5:
The Balance Sheet of omega Limited as on 31‐12‐2018 was as follow:
Liabilities Rs. Assets Rs.
Equity Share Capital 20,00,000 Machinery 35,00,000
8% Pref. Share Capital 15,00,000 Patents & Trademarks 20,00,000
Reserves & Surplus 11,00,000 Stock 1,75,000
10% Debenture 10,00,000 Debtors 3,50,000
9% Secured Loan 5,00,000 Bills Receivables 50,000
Creditors 1,00,000 Cash at bank 2,25,000
Bank overdraft 1,50,000 Fictitious Assets 1,00,000
Bills Payable 45,000
Outstanding Expenses 5,000
64,00,000 64,00,000
You are required to Calculate Following Ratios:
1. Current Ratio (2.67:1)
2. Liquid Ratio (4.17:1)
3. Proprietary Ratio (0.71: 1) or 71%)
4. Capital Gearing Ratio (1: 1)
5. Debt Equity Ratio (0.33: 1) or 33%)
Prob 6:
Following is the summarised Balance Sheet of Borkar tiles Ltd. as on 31‐3‐19.
Liabilities Rs. Assets Rs.
Equity Shares of Rs. 10 Each 10,00,000 Fixed Assets 20,00,000
10% Pref. Shares of Rs. 100 4,00,000 Investments 2,00,000
each Closing Stock 2,00,000
Reserves and surplus 7,00,000 S. Debtors 4,60,000
15% Debentures 5,00,000 Bills Receivables 60,000
Sundry Creditors 2,40,000 Cash Balance 60,000
Management Accounting B.Com (Hons) Semester 4th
29 | Page Prepared by UMA KANT (Research Scholar “LU”, JRF(Commerce), UGC NET(Management), M.Com, MBA
Bank Overdraft 1,60,000 Preliminary Expenses 20,000
30,00,000 30,00,000
You are required to Calculate Following Ratios:
1. Current Ratio (1.95:1)
2. Liquid Ratio (2.42:1)
3. Proprietary Ratio (0.70: 1) or 70%)
4. Capital Gearing Ratio (0.54: 1)
5. Debt Equity Ratio (0.24: 1) or 24%)
INCOME STATEMENT RATIOS:
1. Gross Profit Ratio = Gross Profit X100
Net Sales
Purpose: Indicates the efficiency of production and trading operations
.
2. Operating Ratio = Cost of Goods Sold + Operating Expenses X100
Net Sales
Purpose: index of managerial ability to control operating expenses.
3. Expenses Ratio= Operating Expenses X100
Net Sales
(Expenditure may be cost of production or Cost of sales, administrative or Selling or
distribution expenses or any other Element of Group)
Purpose: Indicates the direction in which economies ought to be effected.
4. Net Operating Profit Ratio = Operating Profit X100
Net Sales
Purpose: Index of Operating Efficiency.
5. Net Profit Ratio = Net Profit After Tax X100
Net Sales
Purpose: Indicates Net Margin on
Management Accounting B.Com (Hons) Semester 4th
30 | Page Prepared by UMA KANT (Research Scholar “LU”, JRF(Commerce), UGC NET(Management), M.Com, MBA
sales.
Prob. 1:
Following is the Income Statement of Urja Auto. Ltd. For the year ended 31st
Dec 2019.
You are required to calculate: 1) Gross Profit Ratio; 2) Operating Ratio; 3) Net operating
Profit Ratio and 4) Net Profit Ratio.
Particulars Rs.
Sales 20,00,000
Less: Cost of goods Sold 12,00,000
Gross Profit 8,00,000
Less: Operating Expenses 4,80,000
Operating Profit 3,20,000
Add: Non –operating income 48,000
3,68,000
Less: Non –operating Expenses 16,000
Profit before Tax 3,52,000
Less: Tax @ 30% 1,05,600
Net Profit After Tax 2,46,400
Solution: (Hint: only needs to replace available figures with respective formula to arrive at
answer)
1. Gross Profit Ratio = 800000/20,00,000 x 100 = 40%
2. Operating ratio = 12,00,000 + 4,80,000 X100 = 84%
20,00,000
3. Net operating profit Ratio = 3,20,000/20,00,000 x 100 = 16%
4. Net profit ratio = 2,46,400/20,00,000 x 100 = 12.3%
Prob. 2:
The following Trading and Profit and Loss Account of Tiptop Ltd. for the year 31‐3‐2019 is given
below:
Particulars Rs. Particulars Rs.
Management Accounting B.Com (Hons) Semester 4th
31 | Page Prepared by UMA KANT (Research Scholar “LU”, JRF(Commerce), UGC NET(Management), M.Com, MBA
To opening stock
To purchases
To Carriage inward
To wages
To Gross profit c/f
76,250
3,15,250
2,000
5,000
2,00,000
By Sales
By Closing stock
5,00,000
98,500
5,98,500 5,98,500
To Administrative
exp.
To Selling & dist.
Exp.
To non operating
exp.
To financial exp.
To net profit c/d
1,01,000
12,000
2,000
7,000
84,000
By Gross profit b/d
By interest on securities
By dividend on shares
By profit on sale of
shares
2,00,000
1,500
3,750
750
2,06,000 2,06,000
Calculate: Gross profit ratio, Expense ratio, operating ratio, net operating profit ratio & net
profit ratio.
Solution:
1. Gross profit ratio = 2,00,000/500,000 x 100 = 40%
2. Expense ratio = operating exp. / net sales x 100
1,13,000+5,00,000 x 100 = 22.60%
3. Operating ratio = cost of goods sold +operating Exp / net sales x100
3,00,000 + 1,13,000 x100
5,00,000
(Cost of Goods sold = Op. stock + purchases + carriage inward + wages – Closing Stock)
4. Operating profit ratio = operating profit / net sales
= 87,000 /5,00,000 x 100 = 17.40%
(Operating profit = sales – (cost of goods sold + operating exp.)
5. Net profit ratio = Net profit/net sales x 100
84,000 / 5,00,000 x 100 = 16.8%
Practice problems:
Management Accounting B.Com (Hons) Semester 4th
32 | Page Prepared by UMA KANT (Research Scholar “LU”, JRF(Commerce), UGC NET(Management), M.Com, MBA
Prob. 3:
Following is the Income Statement of Durv Pvt. Ltd. For the year ended 31st
March 2017.
Particulars Rs.
Net Sales 12,00,000
Less: Cost of goods Sold 7,00,000
Gross Profit 5,00,000
Less: Operating Expenses 2,00,000
Operating Profit 3,00,000
Add: Non –operating income 45,000
3,45,000
Less: Non –operating Expenses 25,000
Profit before Tax 3,20,000
Tax Rate is 40%
Calculate: 1) Gross Profit Ratio; 2) Operating Ratio; 3) Net operating Profit Ratio and 4)
Net Profit Ratio.
Prob. 4:
From the following information for the year ended 31st
Dec 2018, You are required to
calculate: 1) Gross Profit Ratio; 2) Operating Ratio; 3) Net operating Profit Ratio and 4) Net
Profit Ratio.
Total Sales- Rs. 5,00,000/-
Sales Return- Rs. 50,000/-
Gross Profit – 40% of Net
Sales. Cost of goods sold –
Rs. ??
Operating Expenses –
Rs.60,000/- Non-operating
Income – Rs. 21,000/- Tax Rate is
50%
Hint: first prepare income statement and then calculate ratios.
Management Accounting B.Com (Hons) Semester 4th
33 | Page Prepared by UMA KANT (Research Scholar “LU”, JRF(Commerce), UGC NET(Management), M.Com, MBA
FUNCTIONAL CLASSIFICATION OF RATIOS
Liquidity Ratios
Long-Term Solvency
and Leverage Ratios
Activity Ratios Asset
Management Ratios
Profit Abilities Ratios
(A)
 Current
Ratio
 Liquid Ratio
 Absolute
Liquid or
Cash Ratios
 Interval
Measure
(B)
 Debtors
Turnover
Ratio
 Creditor
Turnover
Ratio
 Inventory
Turnover
Ratio
 Debt/Equity
Ratio
 Debt to total
Capital Ratio
 Interest
Coverage
Ratio
 Cash Flow/
Debt
 Capital
Gearing
 Inventory
Turnover
Ratio
 Debtors
Turnover
Ratio
 Fixed
Assets
Turnover
Ratio
 Total Assets
Turnover
Ratio
 Working
Capital
Turnover
Ratio
 Payable
Turnover
Ratio
 Capital
Employed
Turnover
Ratio
(A) In relation to sales
 Gross Profit
Ratio
 Operating
Ratio
 Operating
Ratio
 Operative
Profit Ratio
 Net Profit
Ratio
 Expenses
Ratio
(B) In relation to
Investments
 Return on
Investment
 Return on
Capital
 Return on
Equity
 Return on
Total
 Resources
 Earnings per
Share
 Price
Earnings
Ratio
Common Size Statement?
Common size statement is a form of analysis and interpretation of the financial
statement. It is also known as vertical analysis. This method analyses financial
Management Accounting B.Com (Hons) Semester 4th
34 | Page Prepared by UMA KANT (Research Scholar “LU”, JRF(Commerce), UGC NET(Management), M.Com, MBA
statements by taking into consideration each of the line items as a percentage of the
base amount for that particular accounting period.
Common size statements are not any kind of financial ratios but are a rather easy way
to express financial statements, which makes it easier to analyse those statements.
Common size statements are always expressed in the form of percentages. Therefore,
such statements are also called 100 per cent statements or component percentage
statements as all the individual items are taken as a percentage of 100.
Types of Common Size Statements
There are two types of common size statements:
1. Common size income statement
2. Common size balance sheet
1. Common Size Income Statement
This is one type of common size statement where the sales is taken as the base for all
calculations. Therefore, the calculation of each line item will take into account the sales
as a base, and each item will be expressed as a percentage of the sales.
Use of Common Size Income Statement
It helps the business owner in understanding the following points
1. Whether profits are showing an increase or decrease in relation to the sales obtained.
2. Percentage change in cost of goods that were sold during the accounting period.
3. Variation that might have occurred in expense.
4. If the increase in retained earnings is in proportion to the increase in profit of the business.
5. Helps to compare income statements of two or more periods.
6. Recognises the changes happening in the financial statements of the organisation, which will
help investors in making decisions about investing in the business.
2. Common Size Balance Sheet:
Management Accounting B.Com (Hons) Semester 4th
35 | Page Prepared by UMA KANT (Research Scholar “LU”, JRF(Commerce), UGC NET(Management), M.Com, MBA
A common size balance sheet is a statement in which balance sheet items are being
calculated as the ratio of each asset in relation to the total assets. For the liabilities,
each liability is being calculated as a ratio of the total liabilities.
Common size balance sheets can be used for comparing companies that differ in size.
The comparison of such figures for the different periods is not found to be that useful
because the total figures seem to be affected by a number of factors.
Standard values for various assets cannot be established by this method as the trends
of the figures cannot be studied and may not give proper results.
Common Size Income Statement Format
The common size income statement format is as follows:
Management Accounting B.Com (Hons) Semester 4th
36 | Page Prepared by UMA KANT (Research Scholar “LU”, JRF(Commerce), UGC NET(Management), M.Com, MBA
Preparing Common Size Balance Sheet
(1) Take the total of assets or liabilities as 100.
(2) Each individual asset is expressed as a percentage of the total assets, i.e., 100 and
different liabilities are also calculated as per total liabilities. For example, suppose total
assets are around Rs. 4 lakhs, and inventory value is Rs. 1 lakh. In that case, it will be
counted as 25% of the total assets.
Limitations of Common Size Statement
Following are the limitations discussed
Management Accounting B.Com (Hons) Semester 4th
37 | Page Prepared by UMA KANT (Research Scholar “LU”, JRF(Commerce), UGC NET(Management), M.Com, MBA
1. It is not helpful in the decision-making process as it does not have any approved benchmark.
2. For a business that is impacted by fluctuations due to seasonality, it can be misleading.
Comparative Statements?
Comparative statements or comparative financial statements are statements of financial
position of a business at different periods. These statements help in determining the
profitability of the business by comparing financial data from two or more accounting
periods.
The data from two or more periods are updated side by side, which is why it is also
known as Horizontal Analysis. The advantage of such an analysis is that it helps
investors to identify the trends of business, check a company’s progress and also
compare it with that of its competitors.
The financial data will be considered to be comparative only when the same set
of accounting principles are being used for preparing the statements.
Types of Comparative Statements
There are two types of comparative statements which are as follows
1. Comparative income statement
2. Comparative balance sheet
Comparative Income Statement
Income statements provide the details about the results of the operations of the
business, and comparative income statements provide the progress made by the
business over a period of a few years. This statement also helps in ascertaining the
changes that occur in each line item of the income statement over different periods.
The comparative income statement not only shows the operational efficiency of the
business but also helps in comparing the results with the competitors, over different
Management Accounting B.Com (Hons) Semester 4th
38 | Page Prepared by UMA KANT (Research Scholar “LU”, JRF(Commerce), UGC NET(Management), M.Com, MBA
time periods. This is possible by comparing the operational data spanning multiple
periods of accounting.
The following points should be studied when analysing a comparative income statement
1. Compare the increase or decrease in sales with a relative increase in the cost of
goods sold
2. Studying the operational profits of the business
3. Overall profitability of the business can be analysed by an increase or decrease in the
net profit
Steps in preparing a comparative income statement
The below steps are followed
1. Specify absolute figures of all the items related to the accounting period under
consideration.
2. Determine the absolute change that has occurred in the items of the income
statement. It can be achieved by finding the difference between previous year values
with the current year values.
3. Calculate the percentage change in the items present in the current statement with
respect to previous year statements.
The format of a comparative income statement is as follows:
Management Accounting B.Com (Hons) Semester 4th
39 | Page Prepared by UMA KANT (Research Scholar “LU”, JRF(Commerce), UGC NET(Management), M.Com, MBA
Comparative Balance Sheet
Comparative balance sheet analyses the assets and liabilities of business for the
current year and also compares the increase or decrease in them in relative as well as
absolute parameters.
A comparative balance sheet not only provides the state of assets and liabilities in
different time periods, but it also provides the changes that have taken place in
individual assets and liabilities over different accounting periods.
The following points should be studied when analysing a comparative balance sheet
1. The present financial and liquidity position (study working capital)
2. The financial position of the business in the long term
Management Accounting B.Com (Hons) Semester 4th
40 | Page Prepared by UMA KANT (Research Scholar “LU”, JRF(Commerce), UGC NET(Management), M.Com, MBA
3. The profitability of the business
Steps in preparing a comparative balance sheet
The below steps can be followed
1. Determine the absolute value of assets and liabilities related to the accounting
periods.
2. Determine absolute changes in the items of the balance sheet relative to the
accounting periods in question.
3. Calculate the percentage change in assets and liabilities by comparing current year
values with values of previous accounting periods.
The format of a comparative balance sheet is as follows:
Management Accounting B.Com (Hons) Semester 4th
41 | Page Prepared by UMA KANT (Research Scholar “LU”, JRF(Commerce), UGC NET(Management), M.Com, MBA
difference between the comparative and common size financial statements.
Management Accounting B.Com (Hons) Semester 4th
42 | Page Prepared by UMA KANT (Research Scholar “LU”, JRF(Commerce), UGC NET(Management), M.Com, MBA
Comparative Financial Statement Common Size Financial Statement
Definition
Comparative financial statement is a kind of
document that presents the financial performance of
the organisations side by side with the previous year
performances, in order to compare the growth of
business over a period of time
Common size financial statement is a way of
presenting financial information of a business by
expressing the components of financial statements
as percentages.
Type of analysis
Comparative statements are also known as
horizontal analysis as financial statements are
compared side by side
Common size statements are also known as vertical
analysis as data is analysed vertically
Purpose
Comparative statements are used for comparing
financial performance for internal purposes and for
inter-firm comparison
Common size statements are prepared for the
reference of stakeholders.
Types of comparison made
Comparative statements make use of both absolute
figures and percentages
Common size statements use only percentage form

More Related Content

Similar to Management Accounting Unit - 4. B.Com(Hons)/B.Com/BBA/MBApdf

FINANCIAL PERFORMANCE ANALYSIS OF BHARTI AIRTEL LIMITED
FINANCIAL PERFORMANCE ANALYSIS OF BHARTI AIRTEL LIMITEDFINANCIAL PERFORMANCE ANALYSIS OF BHARTI AIRTEL LIMITED
FINANCIAL PERFORMANCE ANALYSIS OF BHARTI AIRTEL LIMITEDyashmin khatun
 
Financial statements analysis
Financial statements analysisFinancial statements analysis
Financial statements analysisoonyu
 
Financial statements analysis
Financial statements analysis Financial statements analysis
Financial statements analysis Raman Dhiman
 
financial statement analysis. trishit
financial statement analysis. trishitfinancial statement analysis. trishit
financial statement analysis. trishitTrishit Dutta
 
Financial statements analysis an introduction
Financial statements analysis an introductionFinancial statements analysis an introduction
Financial statements analysis an introductionSachin Bhurase
 
Financial statements
Financial statementsFinancial statements
Financial statementsPankaj Modi
 
Describe financial statement analysis
Describe financial statement analysisDescribe financial statement analysis
Describe financial statement analysisminakshi1987
 
A Study on Ratio Analysis at Accord Puducherry
A Study on Ratio Analysis at Accord PuducherryA Study on Ratio Analysis at Accord Puducherry
A Study on Ratio Analysis at Accord Puducherryijtsrd
 
Synopsis on financial statement analysis
Synopsis on financial statement analysisSynopsis on financial statement analysis
Synopsis on financial statement analysissaurabh surve
 
A study on financial performance analysis at cee vee
A study on financial performance analysis at cee veeA study on financial performance analysis at cee vee
A study on financial performance analysis at cee veeAKHILHARIDAS
 
financial statement bharath bag works nizamabad
 financial statement bharath bag works nizamabad financial statement bharath bag works nizamabad
financial statement bharath bag works nizamabadsaikrishnabachuwar
 
Ratio analysis - Introduction
Ratio analysis - IntroductionRatio analysis - Introduction
Ratio analysis - Introductionuma reur
 
Financial statements analysis
Financial statements analysisFinancial statements analysis
Financial statements analysisShivaji Shinde
 
Cs ratio analysis
Cs ratio analysisCs ratio analysis
Cs ratio analysisAjit Gupta
 

Similar to Management Accounting Unit - 4. B.Com(Hons)/B.Com/BBA/MBApdf (20)

FINANCIAL PERFORMANCE ANALYSIS OF BHARTI AIRTEL LIMITED
FINANCIAL PERFORMANCE ANALYSIS OF BHARTI AIRTEL LIMITEDFINANCIAL PERFORMANCE ANALYSIS OF BHARTI AIRTEL LIMITED
FINANCIAL PERFORMANCE ANALYSIS OF BHARTI AIRTEL LIMITED
 
Financial statements analysis
Financial statements analysisFinancial statements analysis
Financial statements analysis
 
Ijetr042103
Ijetr042103Ijetr042103
Ijetr042103
 
Financial statements analysis
Financial statements analysis Financial statements analysis
Financial statements analysis
 
financial statement analysis. trishit
financial statement analysis. trishitfinancial statement analysis. trishit
financial statement analysis. trishit
 
Financial statements analysis an introduction
Financial statements analysis an introductionFinancial statements analysis an introduction
Financial statements analysis an introduction
 
Financial statements
Financial statementsFinancial statements
Financial statements
 
Describe financial statement analysis
Describe financial statement analysisDescribe financial statement analysis
Describe financial statement analysis
 
Ratios Analysis
Ratios Analysis Ratios Analysis
Ratios Analysis
 
Raju plastic container
   Raju plastic container   Raju plastic container
Raju plastic container
 
A Study on Ratio Analysis at Accord Puducherry
A Study on Ratio Analysis at Accord PuducherryA Study on Ratio Analysis at Accord Puducherry
A Study on Ratio Analysis at Accord Puducherry
 
Synopsis on financial statement analysis
Synopsis on financial statement analysisSynopsis on financial statement analysis
Synopsis on financial statement analysis
 
A study on financial performance analysis at cee vee
A study on financial performance analysis at cee veeA study on financial performance analysis at cee vee
A study on financial performance analysis at cee vee
 
Financial analysis
Financial analysisFinancial analysis
Financial analysis
 
financial statement bharath bag works nizamabad
 financial statement bharath bag works nizamabad financial statement bharath bag works nizamabad
financial statement bharath bag works nizamabad
 
Ratio analysis - Introduction
Ratio analysis - IntroductionRatio analysis - Introduction
Ratio analysis - Introduction
 
Analytical Investigation of Financial Planning and Control Practices: A Case ...
Analytical Investigation of Financial Planning and Control Practices: A Case ...Analytical Investigation of Financial Planning and Control Practices: A Case ...
Analytical Investigation of Financial Planning and Control Practices: A Case ...
 
Analytical Investigation of Financial Planning and Control Practices: A Case ...
Analytical Investigation of Financial Planning and Control Practices: A Case ...Analytical Investigation of Financial Planning and Control Practices: A Case ...
Analytical Investigation of Financial Planning and Control Practices: A Case ...
 
Financial statements analysis
Financial statements analysisFinancial statements analysis
Financial statements analysis
 
Cs ratio analysis
Cs ratio analysisCs ratio analysis
Cs ratio analysis
 

More from UmakantAnnand

Concept of Vouching. B.Com(Hons) /B.Compdf
Concept of Vouching. B.Com(Hons) /B.CompdfConcept of Vouching. B.Com(Hons) /B.Compdf
Concept of Vouching. B.Com(Hons) /B.CompdfUmakantAnnand
 
Concept of Auditing B.Com(Hons)/B.Com .pdf
Concept of Auditing B.Com(Hons)/B.Com .pdfConcept of Auditing B.Com(Hons)/B.Com .pdf
Concept of Auditing B.Com(Hons)/B.Com .pdfUmakantAnnand
 
Management Accounting Unit -3. B.Com(Hons) /B.Com/BBA/MBApdf
Management Accounting Unit -3. B.Com(Hons) /B.Com/BBA/MBApdfManagement Accounting Unit -3. B.Com(Hons) /B.Com/BBA/MBApdf
Management Accounting Unit -3. B.Com(Hons) /B.Com/BBA/MBApdfUmakantAnnand
 
Management Accounting Unit - 2. B.Com(Hons)/B.Com/BBA/MBApdf
Management Accounting Unit - 2. B.Com(Hons)/B.Com/BBA/MBApdfManagement Accounting Unit - 2. B.Com(Hons)/B.Com/BBA/MBApdf
Management Accounting Unit - 2. B.Com(Hons)/B.Com/BBA/MBApdfUmakantAnnand
 
Management Accounting Unit 1 for B.Com(Hons)/BCom/BBA.pdf
Management Accounting Unit 1 for B.Com(Hons)/BCom/BBA.pdfManagement Accounting Unit 1 for B.Com(Hons)/BCom/BBA.pdf
Management Accounting Unit 1 for B.Com(Hons)/BCom/BBA.pdfUmakantAnnand
 
Business Environment Unit -2 for B.Com(Hons) Semester 2 Lucknow University
Business Environment Unit -2 for B.Com(Hons) Semester 2 Lucknow UniversityBusiness Environment Unit -2 for B.Com(Hons) Semester 2 Lucknow University
Business Environment Unit -2 for B.Com(Hons) Semester 2 Lucknow UniversityUmakantAnnand
 
Essentail of Management Unit 1.pdf
Essentail of Management Unit 1.pdfEssentail of Management Unit 1.pdf
Essentail of Management Unit 1.pdfUmakantAnnand
 
MCQs on Issue of Shares.pdf
MCQs on Issue of Shares.pdfMCQs on Issue of Shares.pdf
MCQs on Issue of Shares.pdfUmakantAnnand
 
Business Regulatory Framework MCQs Slide share.pdf
Business Regulatory Framework MCQs Slide share.pdfBusiness Regulatory Framework MCQs Slide share.pdf
Business Regulatory Framework MCQs Slide share.pdfUmakantAnnand
 
Vocational_Course_Entrepreneurship_BCom_4.pdf
Vocational_Course_Entrepreneurship_BCom_4.pdfVocational_Course_Entrepreneurship_BCom_4.pdf
Vocational_Course_Entrepreneurship_BCom_4.pdfUmakantAnnand
 
Leadership and Personality Development (Co-Curricular Course) BCom 1st Sem NE...
Leadership and Personality Development (Co-Curricular Course) BCom 1st Sem NE...Leadership and Personality Development (Co-Curricular Course) BCom 1st Sem NE...
Leadership and Personality Development (Co-Curricular Course) BCom 1st Sem NE...UmakantAnnand
 
Accounting and Auditing(UGC NET Commerce)
Accounting and Auditing(UGC NET Commerce)Accounting and Auditing(UGC NET Commerce)
Accounting and Auditing(UGC NET Commerce)UmakantAnnand
 
Income tax UGC NET Commerce
Income tax UGC NET CommerceIncome tax UGC NET Commerce
Income tax UGC NET CommerceUmakantAnnand
 
Concept of management (UGC NET Commerce & Management)
Concept of management (UGC NET Commerce & Management)Concept of management (UGC NET Commerce & Management)
Concept of management (UGC NET Commerce & Management)UmakantAnnand
 
Human Resource Management (UGC NET Commerce & Management
Human Resource Management (UGC NET Commerce & ManagementHuman Resource Management (UGC NET Commerce & Management
Human Resource Management (UGC NET Commerce & ManagementUmakantAnnand
 
Business law (UGC NET Commerce)
Business law (UGC NET Commerce)Business law (UGC NET Commerce)
Business law (UGC NET Commerce)UmakantAnnand
 

More from UmakantAnnand (17)

Concept of Vouching. B.Com(Hons) /B.Compdf
Concept of Vouching. B.Com(Hons) /B.CompdfConcept of Vouching. B.Com(Hons) /B.Compdf
Concept of Vouching. B.Com(Hons) /B.Compdf
 
Concept of Auditing B.Com(Hons)/B.Com .pdf
Concept of Auditing B.Com(Hons)/B.Com .pdfConcept of Auditing B.Com(Hons)/B.Com .pdf
Concept of Auditing B.Com(Hons)/B.Com .pdf
 
Management Accounting Unit -3. B.Com(Hons) /B.Com/BBA/MBApdf
Management Accounting Unit -3. B.Com(Hons) /B.Com/BBA/MBApdfManagement Accounting Unit -3. B.Com(Hons) /B.Com/BBA/MBApdf
Management Accounting Unit -3. B.Com(Hons) /B.Com/BBA/MBApdf
 
Management Accounting Unit - 2. B.Com(Hons)/B.Com/BBA/MBApdf
Management Accounting Unit - 2. B.Com(Hons)/B.Com/BBA/MBApdfManagement Accounting Unit - 2. B.Com(Hons)/B.Com/BBA/MBApdf
Management Accounting Unit - 2. B.Com(Hons)/B.Com/BBA/MBApdf
 
Management Accounting Unit 1 for B.Com(Hons)/BCom/BBA.pdf
Management Accounting Unit 1 for B.Com(Hons)/BCom/BBA.pdfManagement Accounting Unit 1 for B.Com(Hons)/BCom/BBA.pdf
Management Accounting Unit 1 for B.Com(Hons)/BCom/BBA.pdf
 
Business Environment Unit -2 for B.Com(Hons) Semester 2 Lucknow University
Business Environment Unit -2 for B.Com(Hons) Semester 2 Lucknow UniversityBusiness Environment Unit -2 for B.Com(Hons) Semester 2 Lucknow University
Business Environment Unit -2 for B.Com(Hons) Semester 2 Lucknow University
 
Essentail of Management Unit 1.pdf
Essentail of Management Unit 1.pdfEssentail of Management Unit 1.pdf
Essentail of Management Unit 1.pdf
 
MCQs on Issue of Shares.pdf
MCQs on Issue of Shares.pdfMCQs on Issue of Shares.pdf
MCQs on Issue of Shares.pdf
 
Business Regulatory Framework MCQs Slide share.pdf
Business Regulatory Framework MCQs Slide share.pdfBusiness Regulatory Framework MCQs Slide share.pdf
Business Regulatory Framework MCQs Slide share.pdf
 
Vocational_Course_Entrepreneurship_BCom_4.pdf
Vocational_Course_Entrepreneurship_BCom_4.pdfVocational_Course_Entrepreneurship_BCom_4.pdf
Vocational_Course_Entrepreneurship_BCom_4.pdf
 
Micro Economics
Micro EconomicsMicro Economics
Micro Economics
 
Leadership and Personality Development (Co-Curricular Course) BCom 1st Sem NE...
Leadership and Personality Development (Co-Curricular Course) BCom 1st Sem NE...Leadership and Personality Development (Co-Curricular Course) BCom 1st Sem NE...
Leadership and Personality Development (Co-Curricular Course) BCom 1st Sem NE...
 
Accounting and Auditing(UGC NET Commerce)
Accounting and Auditing(UGC NET Commerce)Accounting and Auditing(UGC NET Commerce)
Accounting and Auditing(UGC NET Commerce)
 
Income tax UGC NET Commerce
Income tax UGC NET CommerceIncome tax UGC NET Commerce
Income tax UGC NET Commerce
 
Concept of management (UGC NET Commerce & Management)
Concept of management (UGC NET Commerce & Management)Concept of management (UGC NET Commerce & Management)
Concept of management (UGC NET Commerce & Management)
 
Human Resource Management (UGC NET Commerce & Management
Human Resource Management (UGC NET Commerce & ManagementHuman Resource Management (UGC NET Commerce & Management
Human Resource Management (UGC NET Commerce & Management
 
Business law (UGC NET Commerce)
Business law (UGC NET Commerce)Business law (UGC NET Commerce)
Business law (UGC NET Commerce)
 

Recently uploaded

microwave assisted reaction. General introduction
microwave assisted reaction. General introductionmicrowave assisted reaction. General introduction
microwave assisted reaction. General introductionMaksud Ahmed
 
URLs and Routing in the Odoo 17 Website App
URLs and Routing in the Odoo 17 Website AppURLs and Routing in the Odoo 17 Website App
URLs and Routing in the Odoo 17 Website AppCeline George
 
Privatization and Disinvestment - Meaning, Objectives, Advantages and Disadva...
Privatization and Disinvestment - Meaning, Objectives, Advantages and Disadva...Privatization and Disinvestment - Meaning, Objectives, Advantages and Disadva...
Privatization and Disinvestment - Meaning, Objectives, Advantages and Disadva...RKavithamani
 
Interactive Powerpoint_How to Master effective communication
Interactive Powerpoint_How to Master effective communicationInteractive Powerpoint_How to Master effective communication
Interactive Powerpoint_How to Master effective communicationnomboosow
 
Software Engineering Methodologies (overview)
Software Engineering Methodologies (overview)Software Engineering Methodologies (overview)
Software Engineering Methodologies (overview)eniolaolutunde
 
The basics of sentences session 2pptx copy.pptx
The basics of sentences session 2pptx copy.pptxThe basics of sentences session 2pptx copy.pptx
The basics of sentences session 2pptx copy.pptxheathfieldcps1
 
Arihant handbook biology for class 11 .pdf
Arihant handbook biology for class 11 .pdfArihant handbook biology for class 11 .pdf
Arihant handbook biology for class 11 .pdfchloefrazer622
 
POINT- BIOCHEMISTRY SEM 2 ENZYMES UNIT 5.pptx
POINT- BIOCHEMISTRY SEM 2 ENZYMES UNIT 5.pptxPOINT- BIOCHEMISTRY SEM 2 ENZYMES UNIT 5.pptx
POINT- BIOCHEMISTRY SEM 2 ENZYMES UNIT 5.pptxSayali Powar
 
“Oh GOSH! Reflecting on Hackteria's Collaborative Practices in a Global Do-It...
“Oh GOSH! Reflecting on Hackteria's Collaborative Practices in a Global Do-It...“Oh GOSH! Reflecting on Hackteria's Collaborative Practices in a Global Do-It...
“Oh GOSH! Reflecting on Hackteria's Collaborative Practices in a Global Do-It...Marc Dusseiller Dusjagr
 
Employee wellbeing at the workplace.pptx
Employee wellbeing at the workplace.pptxEmployee wellbeing at the workplace.pptx
Employee wellbeing at the workplace.pptxNirmalaLoungPoorunde1
 
Grant Readiness 101 TechSoup and Remy Consulting
Grant Readiness 101 TechSoup and Remy ConsultingGrant Readiness 101 TechSoup and Remy Consulting
Grant Readiness 101 TechSoup and Remy ConsultingTechSoup
 
18-04-UA_REPORT_MEDIALITERAСY_INDEX-DM_23-1-final-eng.pdf
18-04-UA_REPORT_MEDIALITERAСY_INDEX-DM_23-1-final-eng.pdf18-04-UA_REPORT_MEDIALITERAСY_INDEX-DM_23-1-final-eng.pdf
18-04-UA_REPORT_MEDIALITERAСY_INDEX-DM_23-1-final-eng.pdfssuser54595a
 
Introduction to AI in Higher Education_draft.pptx
Introduction to AI in Higher Education_draft.pptxIntroduction to AI in Higher Education_draft.pptx
Introduction to AI in Higher Education_draft.pptxpboyjonauth
 
Activity 01 - Artificial Culture (1).pdf
Activity 01 - Artificial Culture (1).pdfActivity 01 - Artificial Culture (1).pdf
Activity 01 - Artificial Culture (1).pdfciinovamais
 
Introduction to ArtificiaI Intelligence in Higher Education
Introduction to ArtificiaI Intelligence in Higher EducationIntroduction to ArtificiaI Intelligence in Higher Education
Introduction to ArtificiaI Intelligence in Higher Educationpboyjonauth
 
Call Girls in Dwarka Mor Delhi Contact Us 9654467111
Call Girls in Dwarka Mor Delhi Contact Us 9654467111Call Girls in Dwarka Mor Delhi Contact Us 9654467111
Call Girls in Dwarka Mor Delhi Contact Us 9654467111Sapana Sha
 
CARE OF CHILD IN INCUBATOR..........pptx
CARE OF CHILD IN INCUBATOR..........pptxCARE OF CHILD IN INCUBATOR..........pptx
CARE OF CHILD IN INCUBATOR..........pptxGaneshChakor2
 
Beyond the EU: DORA and NIS 2 Directive's Global Impact
Beyond the EU: DORA and NIS 2 Directive's Global ImpactBeyond the EU: DORA and NIS 2 Directive's Global Impact
Beyond the EU: DORA and NIS 2 Directive's Global ImpactPECB
 
Sanyam Choudhary Chemistry practical.pdf
Sanyam Choudhary Chemistry practical.pdfSanyam Choudhary Chemistry practical.pdf
Sanyam Choudhary Chemistry practical.pdfsanyamsingh5019
 

Recently uploaded (20)

microwave assisted reaction. General introduction
microwave assisted reaction. General introductionmicrowave assisted reaction. General introduction
microwave assisted reaction. General introduction
 
Código Creativo y Arte de Software | Unidad 1
Código Creativo y Arte de Software | Unidad 1Código Creativo y Arte de Software | Unidad 1
Código Creativo y Arte de Software | Unidad 1
 
URLs and Routing in the Odoo 17 Website App
URLs and Routing in the Odoo 17 Website AppURLs and Routing in the Odoo 17 Website App
URLs and Routing in the Odoo 17 Website App
 
Privatization and Disinvestment - Meaning, Objectives, Advantages and Disadva...
Privatization and Disinvestment - Meaning, Objectives, Advantages and Disadva...Privatization and Disinvestment - Meaning, Objectives, Advantages and Disadva...
Privatization and Disinvestment - Meaning, Objectives, Advantages and Disadva...
 
Interactive Powerpoint_How to Master effective communication
Interactive Powerpoint_How to Master effective communicationInteractive Powerpoint_How to Master effective communication
Interactive Powerpoint_How to Master effective communication
 
Software Engineering Methodologies (overview)
Software Engineering Methodologies (overview)Software Engineering Methodologies (overview)
Software Engineering Methodologies (overview)
 
The basics of sentences session 2pptx copy.pptx
The basics of sentences session 2pptx copy.pptxThe basics of sentences session 2pptx copy.pptx
The basics of sentences session 2pptx copy.pptx
 
Arihant handbook biology for class 11 .pdf
Arihant handbook biology for class 11 .pdfArihant handbook biology for class 11 .pdf
Arihant handbook biology for class 11 .pdf
 
POINT- BIOCHEMISTRY SEM 2 ENZYMES UNIT 5.pptx
POINT- BIOCHEMISTRY SEM 2 ENZYMES UNIT 5.pptxPOINT- BIOCHEMISTRY SEM 2 ENZYMES UNIT 5.pptx
POINT- BIOCHEMISTRY SEM 2 ENZYMES UNIT 5.pptx
 
“Oh GOSH! Reflecting on Hackteria's Collaborative Practices in a Global Do-It...
“Oh GOSH! Reflecting on Hackteria's Collaborative Practices in a Global Do-It...“Oh GOSH! Reflecting on Hackteria's Collaborative Practices in a Global Do-It...
“Oh GOSH! Reflecting on Hackteria's Collaborative Practices in a Global Do-It...
 
Employee wellbeing at the workplace.pptx
Employee wellbeing at the workplace.pptxEmployee wellbeing at the workplace.pptx
Employee wellbeing at the workplace.pptx
 
Grant Readiness 101 TechSoup and Remy Consulting
Grant Readiness 101 TechSoup and Remy ConsultingGrant Readiness 101 TechSoup and Remy Consulting
Grant Readiness 101 TechSoup and Remy Consulting
 
18-04-UA_REPORT_MEDIALITERAСY_INDEX-DM_23-1-final-eng.pdf
18-04-UA_REPORT_MEDIALITERAСY_INDEX-DM_23-1-final-eng.pdf18-04-UA_REPORT_MEDIALITERAСY_INDEX-DM_23-1-final-eng.pdf
18-04-UA_REPORT_MEDIALITERAСY_INDEX-DM_23-1-final-eng.pdf
 
Introduction to AI in Higher Education_draft.pptx
Introduction to AI in Higher Education_draft.pptxIntroduction to AI in Higher Education_draft.pptx
Introduction to AI in Higher Education_draft.pptx
 
Activity 01 - Artificial Culture (1).pdf
Activity 01 - Artificial Culture (1).pdfActivity 01 - Artificial Culture (1).pdf
Activity 01 - Artificial Culture (1).pdf
 
Introduction to ArtificiaI Intelligence in Higher Education
Introduction to ArtificiaI Intelligence in Higher EducationIntroduction to ArtificiaI Intelligence in Higher Education
Introduction to ArtificiaI Intelligence in Higher Education
 
Call Girls in Dwarka Mor Delhi Contact Us 9654467111
Call Girls in Dwarka Mor Delhi Contact Us 9654467111Call Girls in Dwarka Mor Delhi Contact Us 9654467111
Call Girls in Dwarka Mor Delhi Contact Us 9654467111
 
CARE OF CHILD IN INCUBATOR..........pptx
CARE OF CHILD IN INCUBATOR..........pptxCARE OF CHILD IN INCUBATOR..........pptx
CARE OF CHILD IN INCUBATOR..........pptx
 
Beyond the EU: DORA and NIS 2 Directive's Global Impact
Beyond the EU: DORA and NIS 2 Directive's Global ImpactBeyond the EU: DORA and NIS 2 Directive's Global Impact
Beyond the EU: DORA and NIS 2 Directive's Global Impact
 
Sanyam Choudhary Chemistry practical.pdf
Sanyam Choudhary Chemistry practical.pdfSanyam Choudhary Chemistry practical.pdf
Sanyam Choudhary Chemistry practical.pdf
 

Management Accounting Unit - 4. B.Com(Hons)/B.Com/BBA/MBApdf

  • 1. Management Accounting B.Com (Hons) Semester 4th 1 | Page Prepared by UMA KANT (Research Scholar “LU”, JRF(Commerce), UGC NET(Management), M.Com, MBA Management Accounting B.Com (Hons) Semester - 4th Unit -4 University of Lucknow, Lucknow Financial Statement Analysis: The term ‗financial analysis‘, also known as analysis and interpretation of financial statements‘, refers to the process of determining financial strengths and weaknesses of the firm by establishing strategicrelationship between the items of the balance sheet, profit and loss account and other operative data. ―Analyzing financial statements,‖ according to Metcalf and Titard, ―is a process of evaluating therelationship between component parts of a financial statement to obtain a better understanding of a firm‘s position and performance.‖ In the words of Myers, ―Financial statement analysis is largely a study of relationship among the various financial factors in a business as disclosed by a single set-of statements and a study of the trend of these factors as shown in a series of statements.‖
  • 2. Management Accounting B.Com (Hons) Semester 4th 2 | Page Prepared by UMA KANT (Research Scholar “LU”, JRF(Commerce), UGC NET(Management), M.Com, MBA Objectives and Importance of Financial Statement Analysis: The primary objective of financial statement analysis is to understand and diagnose the information contained in financial statement with a view to judge the profitability and financial soundness of the firm, and to make forecast about future prospects of the firm. The purpose of analysis depends upon the person interested in such analysis and his object. However, the following purposes or objectives of financial statements analysis may be stated to bring out the significance of such analysis: 1) To assess the earning capacity or profitability of the firm. 2) To assess the operational efficiency and managerial effectiveness. 3) To assess the short term as well as long term solvency position of the firm. 4) To identify the reasons for change in profitability and financial position of the firm. 5) To make inter-firm comparison. 6) To make forecasts about future prospects of the firm. 7) To assess the progress of the firm over a period of time. 8) To help in decision making and control. 9) To guide or determine the dividend action. 10) To provide important information for granting credit.
  • 3. Management Accounting B.Com (Hons) Semester 4th 3 | Page Prepared by UMA KANT (Research Scholar “LU”, JRF(Commerce), UGC NET(Management), M.Com, MBA Parties Interested in Financial Analysis: The following parties are interested in the analysis of financial statements: 1) Investors or potential investors. 2) Management. 3) Creditors or suppliers. 4) Bankers and financial institutions. 5) Employees. 6) Government. 7) Trade associations. 8) Stock exchanges. 9) Economists and researchers. 10) Taxation authorities Limitations of Financial Statement Analysis: Some of the important limitations of financial analysis are, however, summed up as below: 1) It is only a study of interim reports 2) Financial analysis is based upon only monetary information and non-monetary factors areignored. 3) It does not consider changes in price levels. 4) As the financial statements are prepared on the basis of a going concern, it does not give exact position. Thus accounting concepts and conventions cause a serious limitation to financial analysis.
  • 4. Management Accounting B.Com (Hons) Semester 4th 4 | Page Prepared by UMA KANT (Research Scholar “LU”, JRF(Commerce), UGC NET(Management), M.Com, MBA 5) Changes in accounting procedure by a firm may often make financial analysis misleading. 6) Analysis is only a means and not an end in itself. The analyst has to make interpretation and draw his own conclusions. Different people may interpret the same analysis in different ways. Tools or Techniques of Financial Statement Analysis 1) Comparative Statement or Comparative Financial and Operating Statements. 2) Common Size Statements. 3) Trend Ratios or Trend Analysis. 4) Average Analysis. 5) Statement of Changes in Working Capital. 6) Fund Flow Analysis. 7) Cash Flow Analysis. 8) Ratio Analysis. 9) Cost Volume Profit Analysis A brief explanation of the tools or techniques of financial statement analysis presented below. 1) Comparative Statements Comparative statements deal with the comparison of different items of the Profit and Loss Account and Balance Sheets of two or more periods. Separate comparative statements are prepared for Profit and Loss Account as Comparative Income Statement and for Balance Sheets. As a rule, any financial statement can be presented in the form of
  • 5. Management Accounting B.Com (Hons) Semester 4th 5 | Page Prepared by UMA KANT (Research Scholar “LU”, JRF(Commerce), UGC NET(Management), M.Com, MBA comparative statement such as comparative balance sheet, comparative profit and loss account, comparative cost of production statement, comparative statement of working capital and the like. 2) Comparative Income Statement Three important information are obtained from the Comparative Income Statement. They are Gross Profit, Operating Profit and Net Profit. The changes or the improvement in the profitabilityof the business concern is find out over a period of time. If the changes or improvement is not satisfactory, the management can find out the reasons for it and some corrective action can betaken. 3) Comparative Balance Sheet The financial condition of the business concern can be find out by preparing comparative balance sheet. The various items of Balance sheet for two different periods are used. The assets are classified as current assets and fixed assets for comparison. Likewise, the liabilitiesare classified as current liabilities, long term liabilities and shareholders‘ net worth. The term shareholders‘ net worth includes Equity Share Capital, Preference Share Capital, Reserves and Surplus and the like. 4) Common Size Statements A vertical presentation of financial information is followed for preparing common-size statements. Besides, the rupee value of financial statement contents are not taken into consideration. But, only percentage is considered for preparing common size statement. The total assets or total liabilities or sales is taken as 100 and the balance
  • 6. Management Accounting B.Com (Hons) Semester 4th 6 | Page Prepared by UMA KANT (Research Scholar “LU”, JRF(Commerce), UGC NET(Management), M.Com, MBA items are compared to the total assets, total liabilities or sales in terms of percentage. Thus, a common size statement shows the relation of each component to the whole. Separate common size statement is prepared for profit and loss account as Common Size Income Statement and for balance sheet as Common Size Balance Sheet. 5) Trend Analysis The ratios of different items for various periods are find out and then compared under this analysis. The analysis of the ratios over a period of years gives an idea of whether the businessconcern is trending upward or downward. This analysis is otherwise called as Pyramid Method. 6) Statement of Changes in Working Capital The extent of increase or decrease of working capital is identified by preparing the statement of changes in working capital. The amount of net working capital is calculated by subtracting the sum of current liabilities from the sum of current assets. It does not detail the reasons for changes in working capital. 7) Fund Flow Analysis Fund flow analysis deals with detailed sources and application of funds of the business concern for a specific period. It indicates where funds come from and how they are used during the period under review. It highlights the changes in the financial structure of the company. 8) Cash Flow Analysis Cash flow analysis is based on the movement of cash and bank balances. In other words, the movement of cash instead of movement of working capital
  • 7. Management Accounting B.Com (Hons) Semester 4th 7 | Page Prepared by UMA KANT (Research Scholar “LU”, JRF(Commerce), UGC NET(Management), M.Com, MBA would be considered in the cash flow analysis. There are two types of cash flows. They are actual cash flows and notional cashflows. 9) Ratio Analysis Ratio analysis is an attempt of developing meaningful relationship between individual items (or group of items) in the balance sheet or profit and loss account. Ratio analysis is not only useful to internal parties of business concern but also useful to external parties. Ratio analysis highlights the liquidity, solvency, profitability and capital gearing. Funds Flow Statement: Funds flow statement is a statement which discloses the analytical information about the different sources of a fund and the application of the same in an accounting cycle. It deals with the transactions which change either the amount of current assets and current liabilities (in the form of decrease or increase in working capital) or fixed assets, long-term loans including ownership fund. It gives a clear picture about the movement of funds between the opening and closing dates of the Balance Sheet. It is also called the Statement of Sources and Applications of Funds, Movement of Funds Statement; Where Got—Where Gone Statement: Inflow and Outflow of Fund Statement, etc. No doubt, Funds Flow Statement is an important indicator of financial analysis and control. It is valuable and also helps to determine how the funds are financed. The financial analyst can evaluate the future flows of a firm on
  • 8. Management Accounting B.Com (Hons) Semester 4th 8 | Page Prepared by UMA KANT (Research Scholar “LU”, JRF(Commerce), UGC NET(Management), M.Com, MBA the basis of past data. This statement supplies an efficient method for the financial manager in order to assess the: a. Growth of the firm, b. Its resulting financial needs, and c. To determine the best way to finance those needs. Objective of preparing a Funds Flow Statement is multifaceted: a. Revealing Sources and Applications of Funds: It clarifies the important items related to the sources and uses of funds for fixed assets, long-term loans, and capital, indicating whether assets derived from business activities are being utilized properly. b. Detailing Fund Acquisition and Utilization: It shows how funds are acquired, whether through asset disposal, issuing shares or debentures, loans, or normal business activities, and how these funds are utilized, such as for acquiring fixed assets, repaying loans, or paying taxes and dividends. c. Informing Management for Budgeting and Policy Formulation: It assists management in preparing budgets and formulating future operational policies based on insights into fund utilization and acquisition. The significance of Funds Flow Statements can be summarized as follows: a. Analysis of Financial Statement: It provides a dynamic view of financial activities, explaining the causes and effects of changes in a firm's financial position, addressing questions like changes in working capital, asset sales,
  • 9. Management Accounting B.Com (Hons) Semester 4th 9 | Page Prepared by UMA KANT (Research Scholar “LU”, JRF(Commerce), UGC NET(Management), M.Com, MBA dividend payments, utilization of profits, debt repayment, and sources of increased working capital. b. Guiding Dividend Policy: It helps firms make sound dividend decisions, even in the presence of sufficient profits but a lack of liquid resources. c. Allocation of Resources: It aids management in making informed decisions about resource allocation by projecting future fund flows. d. Future Planning: It acts as a guide for future financial provision, enabling firms to anticipate and avoid potential financial problems. e. Working Capital Appraisal: It helps assess the efficient use of working capital and suggests improvements based on present challenges. Basis for comparison Cash flow Fund flow Meaning A cash flow statement is a statement showing the inflows and outflows of cash and cash equivalents over a period. A fund flow statement is a statement showing the changes in the financial position of the entity in different accounting years. Purpose o fPreparation To show the reasons for movements in the cash at the beginning and at the end of the accounting period. To show the reasons for the changes in the financial position, with respect to previous year and current accounting year.
  • 10. Management Accounting B.Com (Hons) Semester 4th 10 | Page Prepared by UMA KANT (Research Scholar “LU”, JRF(Commerce), UGC NET(Management), M.Com, MBA Basis Cash Basis of Accounting. Accrual Basis of Accounting. Analysis Short Term Analysis of cash planning. Long Term Analysis of financialplanning Discloses Inflows and Outflows of Cash Sources and applications of funds Opening an d closing balance Contains opening and closing balance of cash and cash equivalents. Does not contains opening balance of cash and cash equivalents. Part of Financial Statement Yes No Cash Flow Statement A cash flow statement provides information about the changes in cash and cash equivalents of a business by classifying cash flows into operating, investing and financing activities. It is a key report to be prepared for each accounting period for which financial statements are presented by an enterprise. Monitoring the cash situation of any business is the key. The income statement would reflect the profits but does not give any indication of the cash components. The important information of what the business has been
  • 11. Management Accounting B.Com (Hons) Semester 4th 11 | Page Prepared by UMA KANT (Research Scholar “LU”, JRF(Commerce), UGC NET(Management), M.Com, MBA doing with the cash is provided by the cash flow statement. Like the other financial statements, the cash flow statement is also usually drawn up annually, but can be drawn up more often. It is noteworthy that cash flow statement covers the flows of cash over a period of time (unlike the balance sheet that provides a snapshot of the business at a particular date). Also, the cashflow statement can be drawn up in a budget form and later compared to actual figures. Objectives of preparing Cash Flow Statement 1) Cash flow statement shows inflow and outflow of cash and cash equivalents from various activities of a company during a specific period under the main heads i.e., operating activities, investing activities and financing activities. 2) Information through the Cash Flow statement is useful in assessing the ability of any enterprise to generate cash and cash equivalents and the needs of the enterprise to utilize those cash flows. 3) Taking economic decisions requires an evaluation of the ability of an enterprise to generate cash and cash equivalents, which is provided by the cash flow statement Cash and cash equivalents generally consist of the following: o Cash in hand o Cash at bank o Short term investments that are highly liquid o Bank overdrafts comprise an integral element of the organization‘s treasury management
  • 12. Management Accounting B.Com (Hons) Semester 4th 12 | Page Prepared by UMA KANT (Research Scholar “LU”, JRF(Commerce), UGC NET(Management), M.Com, MBA Classification of activities: Cash flow activities are to be classified into three categories :This is done to show separately the cash flows generated / used by these activities, thereby helping to assess the impact of these activities on the financial position and cash and cashequivalents of an enterprise. 1) Operating activities 2) Investing activities 3) Financing activities Cash from Operating Activities: Operating activities are the activities that comprise of the primary / main activities of an enterprise during an accounting period. For example, for a garment manufacturing company, operating activities include procurement of raw material, sale of garments, incurrence of manufacturing expenses, etc. These are the principal revenue generating activities of the enterprise. Profit before tax as presented in the income statement could be used as a starting point to calculate the cash flows from operating activities. Cash Inflows from operating activities: o Cash receipts from sale of goods and rendering services. o Cash receipts from fees, royalties, commissions and other revenues.
  • 13. Management Accounting B.Com (Hons) Semester 4th 13 | Page Prepared by UMA KANT (Research Scholar “LU”, JRF(Commerce), UGC NET(Management), M.Com, MBA Cash Outflows from operating activities: o Cash payments to suppliers for goods and services. o Cash payments of income taxes unless they can be specifically identified with financing and investing activities. Following adjustments are required to be made to the profit before tax to arriveat the cash flow from operations: o Elimination of non cash expenses (e.g. depreciation, amortization, impairment losses, bad debts written off, etc) o Removal of expenses to be classified elsewhere in the cash flow statement (e.g. interest expense should be classified under financing activities) o Removal of income to be presented elsewhere in the cash flow statement (e.g. dividend income and interest income should be classified under investing activities unless in case of forexample an investment bank) o Elimination of non cash income (e.g. gain on revaluation of investments) o The amount of cash from operations indicates the internal solvency level of the company. It is a key indicator of the extent to which the operations of the enterprise have generated sufficient cash flows to maintain its operating potential.
  • 14. Management Accounting B.Com (Hons) Semester 4th 14 | Page Prepared by UMA KANT (Research Scholar “LU”, JRF(Commerce), UGC NET(Management), M.Com, MBA Cash from Investing Activities: Cash flow from investing activities includes the movement in cash flows owing to the purchase and sale of assets. It relates to purchase and sale of long-term assets or fixed assets such as machinery, furniture, land and building, etc. a) Cash Outflows from investing activities b) Cash payments to acquire fixed assets including intangibles and capitalized R&D. c) Cash advances and loans made to third party (other than advances and loans made by a financial enterprise wherein it is operating activities). d) Cash payments to acquire shares, warrants or debt instruments of other enterprises other than the instruments those held for trading purposes. Cash Inflows from investing activities a) Cash receipt from disposal of fixed assets including intangibles. b) Cash receipt from the repayment of advances or loans made to third parties (except in case offinancial enterprise). c) Dividend received from investments in other enterprises. d) Cash receipt from disposal of shares, warrants or debt instruments of other enterprises exceptthose held for trading purposes. Cash from Financing Activities: It includes financing activities related to long-term funds or capital of an enterprise. Financing activitiesare activities that result in changes in the size and composition of the owners‘ capital and borrowings of the enterprise.
  • 15. Management Accounting B.Com (Hons) Semester 4th 15 | Page Prepared by UMA KANT (Research Scholar “LU”, JRF(Commerce), UGC NET(Management), M.Com, MBA e.g., cash proceeds from issue of equity shares, debentures, raising long-term loans, repayment of bank loans, etc. Cash Inflows from financing activities o Cash proceeds from issuing shares (equity / preference). o Cash proceeds from issuing debentures, loans, bonds and other short/ long-term borrowings. Cash Outflows from financing activities: o Cash repayments of amounts borrowed. o Interest paid on debentures and long-term loans and advances. o Dividends paid on equity and preference capital. Main heads of Cash Flow statement: Cash Flow Statement (Main heads only) (A)Cash flows from operating activities xxx (B)Cash flows from investing activities xxx (C)Cash flows from financing activities xxx Net increase (decrease) in cash and cash xxx equivalents (A + B + C) + Cash and cash equivalents at the beginning xxx = Cash and cash equivalents at the end xxxx Methods of preparing the Cash Flow Statements Operating activities are the main source of revenues and expenditures, thereby cash flow from thesame needs to be ascertained. The cash flow can
  • 16. Management Accounting B.Com (Hons) Semester 4th 16 | Page Prepared by UMA KANT (Research Scholar “LU”, JRF(Commerce), UGC NET(Management), M.Com, MBA be reported through two ways: Direct method that discloses the major classes of gross cash receipts and cash payments and Indirect method that has the net profit or loss adjusted for effects of 1) transactions of a non-cash nature, 2) any deferrals or accruals of past/future operating cash receipts and 3) items of income or expenses associated with investing or financing cash flows. Direct method: In the direct method, the major heads of cash inflows and outflows (such as cash received from trade receivables, employee benefits, expenses paid, etc.) are to be considered. As the different line items are recorded on accrual basis in statement of profit and loss, certainadjustments are to be made to convert them into cash basis such as the following: 1) Cash receipts from customers = Revenue from operations + Trade receivables in the beginning – Trade receivables in the end. 2) Cash payments to suppliers = Purchases + Trade Payables in the beginning – Trade Payables inthe end.
  • 17. Management Accounting B.Com (Hons) Semester 4th 17 | Page Prepared by UMA KANT (Research Scholar “LU”, JRF(Commerce), UGC NET(Management), M.Com, MBA 3) Purchases = Cost of Revenue from Operations – Opening Inventory + Closing Inventory. 4) Cash expenses = Expenses on accrual basis + Prepaid expenses in the beginning and Outstanding expenses in the end – Prepaid expenses in the end and Outstanding expenses in the beginning. Purpose & Importance of Cash Flow Statements 1) Statement of cash flows provides important insights about the liquidity and solvency of a company which are vital for survival and growth of any organization. 2) It enables analysts to use the information about historic cash flows for projections of future cash flows of an entity on which to base their economic decisions. 3) By summarizing key changes in financial position during a period, cash flow statement serves to highlight priorities of management. 4) Comparison of cash flows of different entities helps reveal the relative quality of their earnings since cash flow information is more objective as opposed to the financial performance reflected in income statement. Advantages of Cash Flow Statement 1) Cash Flow Statements help in knowing the liquidity / actual cash position of the company which funds flow and P&L are unable to specify.
  • 18. Management Accounting B.Com (Hons) Semester 4th 18 | Page Prepared by UMA KANT (Research Scholar “LU”, JRF(Commerce), UGC NET(Management), M.Com, MBA 2) As the liquidity position is known, any shortfalls can be arranged for or excess can be used forthe growth of the business 3) Any discrepancy in the financial reporting can be gauged through the cash flow statement bycomparing the cash position of both. 4) Cash is the basis of all financial operations. Therefore, a projected cash flow statement will enable the management to plan and control the financial operations properly. 5) Cash Flow analysis together with the ratio analysis helps measure the profitability and financialposition of business. 6) Cash flow statement helps in internal financial management as it is useful in formulation offinancial plans. Disadvantages of Cash Flow Statement 1) Through the cash flow statement alone, it is not possible to arrive at actual P&L of the company as it shows only the cash position. It has limited usage and in isolation it is of no use and requires BL, P&L for its projections. Cash flow statement does not disclose net income from operations. Therefore, it cannot be a substitute for income statement 2) The cash balance as shown by the cash flow statement may not represent the real liquidity position of the business because it can be easily influenced by postponing the purchases and other payments 3) Cash flow statement cannot replace the funds flow statement. Each of the two has a separate function to perform.
  • 19. Management Accounting B.Com (Hons) Semester 4th 19 | Page Prepared by UMA KANT (Research Scholar “LU”, JRF(Commerce), UGC NET(Management), M.Com, MBA Ratio Analysis Meaning: A ratio is a mathematical number calculated as a reference to relationship of two or more numbers and can be expressed as a fraction, proportion, percentage and a number of times. When the number is calculated by referring to two accounting numbers derived from the financial statements, it is termed as accounting ratio. It needs to be observed that accounting ratios exhibit relationship, if any, between accounting numbers extracted from financial statements. Ratios are essentially derived numbers and their efficacy depends a great deal upon the basic numbers from which they are calculated. Further, a ratio must be calculated using numbers which are meaningfully correlated. Objectives of Ratio Analysis: Ratio analysis is indispensable part of interpretation of results revealed by the financial statements. It provides users with crucial financial information and points out the areas which require investigation. Ratio analysis is a technique which involves regrouping of data by application of arithmetical relationships, though its interpretation is a complex matter. It requires a fine understanding of the way and the rules used for preparing financial
  • 20. Management Accounting B.Com (Hons) Semester 4th 20 | Page Prepared by UMA KANT (Research Scholar “LU”, JRF(Commerce), UGC NET(Management), M.Com, MBA statements. Once done effectively, it provides a lot of information which helps the analyst: 1. To know the areas of the business which need more attention; 2. To know about the potential areas which can be improved with the effort in the desired direction; 3. To provide a deeper analysis of the profitability, liquidity, solvency and efficiency levels in the business; 4. To provide information for making cross-sectional analysis by comparing the performance with the best industry standards; and 5. To provide information derived from financial statements useful for making projections and estimates for the future. Importance (or Advantages) of Ratio Analysis: 1. Helps to understand efficacy of decisions: The ratio analysis helps you to understand whether the business firm has taken the right kind of operating, investing and financing decisions. It indicates how far they have helped in improving the performance. 2. Simplify complex figures and establish relationships: Ratios help in simplifying the complex accounting figures and bring out their relationships. They help summarise the financial information effectively and assess the managerial efficiency, firm‘s credit worthiness, earning capacity, etc. 3. Helpful in comparative analysis: The ratios are not be
  • 21. Management Accounting B.Com (Hons) Semester 4th 21 | Page Prepared by UMA KANT (Research Scholar “LU”, JRF(Commerce), UGC NET(Management), M.Com, MBA calculated for one year only. When many year figures are kept side by side, they help a great deal in exploring the trends visible in the business. The knowledge of trend helps in making projections about the business which is a very useful feature. 4. Identification of problem areas: Ratios help business in identifying the problem areas as well as the bright areas of the business. Problem areas would need more attention and bright areas will need polishing to have still better results. 5. Enables SWOT analysis: Ratios help a great deal in explaining the changes occurring in the business. The information of change helps the management a great deal in understanding the current threats and opportunities and allows business to do its own SWOT (Strength-Weakness-Opportunity-Threat) analysis. 6. Various comparisons: Ratios help comparisons with certain bench marks to assess as to whether firm‘s performance is better or otherwise. For this purpose, the profitability, liquidity, solvency, etc. of a business, may be compared: (i) over a number of accounting periods with itself (Intra-firm Comparison/Time Series Analysis), (ii) with other business enterprises (Inter-firm Comparison/Cross- sectional Analysis) and (iii) with standards set for that firm/industry (comparison with standard (or industry expectations). Limitations of Ratio Analysis:
  • 22. Management Accounting B.Com (Hons) Semester 4th 22 | Page Prepared by UMA KANT (Research Scholar “LU”, JRF(Commerce), UGC NET(Management), M.Com, MBA 1. Lack of Precision and Finality: Accounting data may appear precise, but they are influenced by recorded facts, conventions, and personal judgments, leading to potential inaccuracies. Profit figures, for example, are subjective and dependent on the competence and integrity of those involved, which can obscure the true state of affairs in a business. 2. Ignoring Price-level Changes: Financial accounting typically assumes stable money values, disregarding the impact of inflation or deflation. In reality, changes in the price level render comparisons across different accounting periods meaningless. 3. Neglecting Qualitative Aspects: While accounting focuses on quantitative aspects, qualitative factors such as character, honesty, and managerial ability can significantly affect business outcomes. Ratios derived from purely quantitative analysis may fail to capture these qualitative dimensions. 4. Variations in Accounting Practices: Differing accounting policies among businesses, such as inventory valuation methods and depreciation calculation, hinder cross-sectional analysis and make valid comparisons challenging. 5. Limited Forecasting Ability: Historical analysis alone is insufficient for accurate future forecasting. Predictions require consideration of non-financial factors, and reliance solely on past financial data may lead to unreliable forecasts. 6. Inability to Provide Solutions: Accounting data serve primarily as indicators and whistleblowers, highlighting issues rather than offering solutions to problems. They lack the capacity to resolve underlying issues within a business. Balance Sheet Ratios:
  • 23. Management Accounting B.Com (Hons) Semester 4th 23 | Page Prepared by UMA KANT (Research Scholar “LU”, JRF(Commerce), UGC NET(Management), M.Com, MBA 1. Current Ratio = Current Assets Current Liabilities 2. Liquid Ratio = Quick (Liquid) Assets Quick (Liquid) Liabilities  Liquid assets are those which are readily converted into cash and will include cash/ bank balances, bills receivable, sundry debtors and short term investments. Inventories and Prepaid Expenses are not included in liquid assets.  Liquid Liabilities includes all items of current liabilities except Bank Overdraft. 3. Proprietary Ratio = Proprietors funds Total Assets  Proprietor fund = Share capital(Equity & Pref.) + Retained earnings (less loss if any) -Fictitious assets  Total Assets = Fixed Assets + Current Assets-Fictitious assets 4. Stock Working capital Ratio = Closing Stock Working Capital  Working Capital = Current assets – Current liabilities 5. Capital Gearing Ratio = Fixed Interest & Dividend Bearing Funds Equity Share holders fund  Equity Share holders fund= Equity Sh. Capital + Retained earnings (less loss if any) -Fictitious assets 6. Debt Equity Ratio = Long Term Debt Proprietors Fund Prob1:
  • 24. Management Accounting B.Com (Hons) Semester 4th 24 | Page Prepared by UMA KANT (Research Scholar “LU”, JRF(Commerce), UGC NET(Management), M.Com, MBA Liabilities Rs. Assets Rs. Equity Share Capital 5,00,000 Land & Building 1,00,000 Preference share capital 2,00,000 Machinery 4,00,000 General Reserve 1,00,000 Furniture 50,000 Secured Loan 3,00,000 Inventory 3,00,000 Sundry Creditors 1,00,000 Sundry Debtors Cash/Bank Balance 3,00,000 50,000 12,00,00 0 12,00,00 0 Calculate Following Ratios from the above balance sheet: 1. Current Ratio 2. Liquid Ratio 3. Proprietary Ratio 4. Stock Working capital Ratio 5. Capital Gearing Ratio 6. Debt Equity Ratio Solution: 1. Current ratio = Current assets/current liabilities Current assets = inventory (3,00,000)+ s.debtors(3,00,000) + cash balance(50,000) = 6,50,000 Current liabilities = S.Creditors = 1,00,000 = 6,50,000/1,00,000 = 6.5:1 2. Liquid ratio = liquid assets/liquid liabilities liquid assets = s.debtors(3,00,000) + cash balance(50,000) = 3,50,000 liquid liabilities = S.Creditors = 1,00,000 = 3,50,000/1,00,000 = 3.5:1 3. Proprietary Ratio Proprietors fund / total assets Proprietor fund = Share capital(Equity & Pref.) + Retained earnings (less loss if any) -Fictitious assets = 5,00,000 + 2,00,000 + 100,000 = 8,00,000
  • 25. Management Accounting B.Com (Hons) Semester 4th 25 | Page Prepared by UMA KANT (Research Scholar “LU”, JRF(Commerce), UGC NET(Management), M.Com, MBA Total Assets = Fixed Assets + Current Assets- Fictitious assets = 12,00,000 = 800,000/12,00,000 = 0.66 : 1 4. Stock Workin g = closing stock / working capital capital Ratio = 300,000 / 5,50,000 = 0.55:1 Working capital (CA-CL= 6,50,000 – 1,00,000 = 5,50,000) 5. Capital Gearin g = Fixed Interest & Dividend Bearing Funds Ratio Equity Share holders fund Fixed Interest & Dividend Bearing Funds = pref sh. (2,00,000) + secured loan (3,00,000) = 500,000 Equity Share holders fund = Eq. Shares (5,00,000) + GR (100,000) = 600,000 = 500,000 / 600,000 = 0.83 : 1 6. Debt Equity =Long Term Debt Ratio Proprietors Fund Long term debt = secured loan (300,000) = 3,00,000/8,00,000 = 0.38 : 1 Prob 2: Liabilities Rs. Assets Rs. Equity Share Capital 2,00,000 Machinery 5,92,000 12% Preference share capital 3,60,000 Investment 2,24,000 General Reserve 1,40,000 Stock 2,02,000 16% debentures 2,40,000 Bills Receivable 40,000 Trade payable 2,44,000 S. Debtors 98,000 Bank overdraft 40,000 Cash and Bank 76,000 Provision for Income Tax 36,000 Profit & Loss A/c 28,000 12,60,00 0 12,60,00 0 Calculate Following Ratios from the above balance sheet: 1. Current Ratio
  • 26. Management Accounting B.Com (Hons) Semester 4th 26 | Page Prepared by UMA KANT (Research Scholar “LU”, JRF(Commerce), UGC NET(Management), M.Com, MBA 2. Liquid Ratio 3. Proprietary Ratio 4. Capital Gearing Ratio 5. Debt Equity Ratio Solution: 1. Current ratio = Current assets/current liabilities Current assets = stock (2,02,000)+ BR (40,000)+ s.debtors(98000) + cash balance(76,000) = 4,16,000 Current liabilities = trade payable (2,44,000) + Bank o/d(40,000) + provision for income tax (36,000) = 320,000 = 4,16,000/3,20,000 = 1.3:1 2. Liquid ratio = liquid assets/liquid liabilities liquid assets = BR (40,000)+ s.debtors(98000) + cash balance(76,000) = 2,14,000 liquid liabilities = trade payable (2,44,000) provision for income tax (36,000) = 2,80,000 = 2,14,000/2,80,000 = 0.76:1 3. Proprietary Ratio Proprietors fund / total assets Proprietor fund = Share capital(Equity & Pref.) + Retained earnings (less loss if any) -Fictitious assets = 2,00,000 + 3,60,000 + 140,000-28,000 = 6,72,000 Total Assets = Fixed Assets + Current Assets- Fictitious assets = 12,60,000 – 28,000 = 12,32,000 = 6,72,000/12,32,000 = 0.55 : 1
  • 27. Management Accounting B.Com (Hons) Semester 4th 27 | Page Prepared by UMA KANT (Research Scholar “LU”, JRF(Commerce), UGC NET(Management), M.Com, MBA 4. Capital Gearin g Ratio = Fixed Interest & Dividend Bearing Funds Equity Share holders fund Fixed Interest & Dividend Bearing Funds = pref sh. (3,60,000) + debentures (2,40,000) = 6,00,000 Equity Share holders fund = Eq. Shares (2,00,000) + GR (1,40,000) – profit & loss (28000) = 3,12,000 = 600,000 / 3,12,000 = 1.92 : 1 5. Debt Equit y Ratio =Long Term Debt Proprietors Fund Long term debt = debentures (2,40,000) = 2,40,000/6,70,000 = 0.36 : 1 Practice problems: Prob 3: Liabilities Rs. Assets Rs. Equity Share Capital 1,00,000 Furniture 2,96,000 10% Preference share capital 1,80,000 Trademarks 1,12,000 General Reserve 70,000 Stock 1,01,000 15% debentures 1,20,000 Bills Receivable 20,000 Trade payable 1,22,000 Trade Receivables 49,000 Bank overdraft 20,000 Cash and Bank 38,000 Provision for Tax 18,000 Profit & Loss A/c 14,000 6,30,000 6,30,000 Calculate Following Ratios from the above balance sheet: 1. Current Ratio 2. Liquid Ratio 3. Proprietary Ratio 4. Capital Gearing Ratio 5. Debt Equity Ratio Prob 4: The Balance Sheet of Trident Limited as on 31‐12‐2017 was as follow: Liabilities Rs. Assets Rs. Equity Share Capital 40,000 Plant & Machinery 24,000 Capital Reserve 8,000 Land & Building 40,000 Profit & Loss A/c 12,000 Furniture & Fixtures 16,000
  • 28. Management Accounting B.Com (Hons) Semester 4th 28 | Page Prepared by UMA KANT (Research Scholar “LU”, JRF(Commerce), UGC NET(Management), M.Com, MBA 7% Mortgage Loan 32,000 Stock 12,000 Creditors 16,000 Debtors 12,000 Bank overdraft 4,000 Investment (Short-term) 4,000 Provision for Income Tax 8,000 Cash at bank 12,000 1,20,000 1,20,000 You are required to Calculate Following Ratios: 1. Current Ratio (1.43:1) 2. Liquid Ratio (1.17:1) 3. Proprietary Ratio (0.5: 1) or 50%) 4. Capital Gearing Ratio (0.53: 1) 5. Debt Equity Ratio (0.53: 1) or 53%) Prob 5: The Balance Sheet of omega Limited as on 31‐12‐2018 was as follow: Liabilities Rs. Assets Rs. Equity Share Capital 20,00,000 Machinery 35,00,000 8% Pref. Share Capital 15,00,000 Patents & Trademarks 20,00,000 Reserves & Surplus 11,00,000 Stock 1,75,000 10% Debenture 10,00,000 Debtors 3,50,000 9% Secured Loan 5,00,000 Bills Receivables 50,000 Creditors 1,00,000 Cash at bank 2,25,000 Bank overdraft 1,50,000 Fictitious Assets 1,00,000 Bills Payable 45,000 Outstanding Expenses 5,000 64,00,000 64,00,000 You are required to Calculate Following Ratios: 1. Current Ratio (2.67:1) 2. Liquid Ratio (4.17:1) 3. Proprietary Ratio (0.71: 1) or 71%) 4. Capital Gearing Ratio (1: 1) 5. Debt Equity Ratio (0.33: 1) or 33%) Prob 6: Following is the summarised Balance Sheet of Borkar tiles Ltd. as on 31‐3‐19. Liabilities Rs. Assets Rs. Equity Shares of Rs. 10 Each 10,00,000 Fixed Assets 20,00,000 10% Pref. Shares of Rs. 100 4,00,000 Investments 2,00,000 each Closing Stock 2,00,000 Reserves and surplus 7,00,000 S. Debtors 4,60,000 15% Debentures 5,00,000 Bills Receivables 60,000 Sundry Creditors 2,40,000 Cash Balance 60,000
  • 29. Management Accounting B.Com (Hons) Semester 4th 29 | Page Prepared by UMA KANT (Research Scholar “LU”, JRF(Commerce), UGC NET(Management), M.Com, MBA Bank Overdraft 1,60,000 Preliminary Expenses 20,000 30,00,000 30,00,000 You are required to Calculate Following Ratios: 1. Current Ratio (1.95:1) 2. Liquid Ratio (2.42:1) 3. Proprietary Ratio (0.70: 1) or 70%) 4. Capital Gearing Ratio (0.54: 1) 5. Debt Equity Ratio (0.24: 1) or 24%) INCOME STATEMENT RATIOS: 1. Gross Profit Ratio = Gross Profit X100 Net Sales Purpose: Indicates the efficiency of production and trading operations . 2. Operating Ratio = Cost of Goods Sold + Operating Expenses X100 Net Sales Purpose: index of managerial ability to control operating expenses. 3. Expenses Ratio= Operating Expenses X100 Net Sales (Expenditure may be cost of production or Cost of sales, administrative or Selling or distribution expenses or any other Element of Group) Purpose: Indicates the direction in which economies ought to be effected. 4. Net Operating Profit Ratio = Operating Profit X100 Net Sales Purpose: Index of Operating Efficiency. 5. Net Profit Ratio = Net Profit After Tax X100 Net Sales Purpose: Indicates Net Margin on
  • 30. Management Accounting B.Com (Hons) Semester 4th 30 | Page Prepared by UMA KANT (Research Scholar “LU”, JRF(Commerce), UGC NET(Management), M.Com, MBA sales. Prob. 1: Following is the Income Statement of Urja Auto. Ltd. For the year ended 31st Dec 2019. You are required to calculate: 1) Gross Profit Ratio; 2) Operating Ratio; 3) Net operating Profit Ratio and 4) Net Profit Ratio. Particulars Rs. Sales 20,00,000 Less: Cost of goods Sold 12,00,000 Gross Profit 8,00,000 Less: Operating Expenses 4,80,000 Operating Profit 3,20,000 Add: Non –operating income 48,000 3,68,000 Less: Non –operating Expenses 16,000 Profit before Tax 3,52,000 Less: Tax @ 30% 1,05,600 Net Profit After Tax 2,46,400 Solution: (Hint: only needs to replace available figures with respective formula to arrive at answer) 1. Gross Profit Ratio = 800000/20,00,000 x 100 = 40% 2. Operating ratio = 12,00,000 + 4,80,000 X100 = 84% 20,00,000 3. Net operating profit Ratio = 3,20,000/20,00,000 x 100 = 16% 4. Net profit ratio = 2,46,400/20,00,000 x 100 = 12.3% Prob. 2: The following Trading and Profit and Loss Account of Tiptop Ltd. for the year 31‐3‐2019 is given below: Particulars Rs. Particulars Rs.
  • 31. Management Accounting B.Com (Hons) Semester 4th 31 | Page Prepared by UMA KANT (Research Scholar “LU”, JRF(Commerce), UGC NET(Management), M.Com, MBA To opening stock To purchases To Carriage inward To wages To Gross profit c/f 76,250 3,15,250 2,000 5,000 2,00,000 By Sales By Closing stock 5,00,000 98,500 5,98,500 5,98,500 To Administrative exp. To Selling & dist. Exp. To non operating exp. To financial exp. To net profit c/d 1,01,000 12,000 2,000 7,000 84,000 By Gross profit b/d By interest on securities By dividend on shares By profit on sale of shares 2,00,000 1,500 3,750 750 2,06,000 2,06,000 Calculate: Gross profit ratio, Expense ratio, operating ratio, net operating profit ratio & net profit ratio. Solution: 1. Gross profit ratio = 2,00,000/500,000 x 100 = 40% 2. Expense ratio = operating exp. / net sales x 100 1,13,000+5,00,000 x 100 = 22.60% 3. Operating ratio = cost of goods sold +operating Exp / net sales x100 3,00,000 + 1,13,000 x100 5,00,000 (Cost of Goods sold = Op. stock + purchases + carriage inward + wages – Closing Stock) 4. Operating profit ratio = operating profit / net sales = 87,000 /5,00,000 x 100 = 17.40% (Operating profit = sales – (cost of goods sold + operating exp.) 5. Net profit ratio = Net profit/net sales x 100 84,000 / 5,00,000 x 100 = 16.8% Practice problems:
  • 32. Management Accounting B.Com (Hons) Semester 4th 32 | Page Prepared by UMA KANT (Research Scholar “LU”, JRF(Commerce), UGC NET(Management), M.Com, MBA Prob. 3: Following is the Income Statement of Durv Pvt. Ltd. For the year ended 31st March 2017. Particulars Rs. Net Sales 12,00,000 Less: Cost of goods Sold 7,00,000 Gross Profit 5,00,000 Less: Operating Expenses 2,00,000 Operating Profit 3,00,000 Add: Non –operating income 45,000 3,45,000 Less: Non –operating Expenses 25,000 Profit before Tax 3,20,000 Tax Rate is 40% Calculate: 1) Gross Profit Ratio; 2) Operating Ratio; 3) Net operating Profit Ratio and 4) Net Profit Ratio. Prob. 4: From the following information for the year ended 31st Dec 2018, You are required to calculate: 1) Gross Profit Ratio; 2) Operating Ratio; 3) Net operating Profit Ratio and 4) Net Profit Ratio. Total Sales- Rs. 5,00,000/- Sales Return- Rs. 50,000/- Gross Profit – 40% of Net Sales. Cost of goods sold – Rs. ?? Operating Expenses – Rs.60,000/- Non-operating Income – Rs. 21,000/- Tax Rate is 50% Hint: first prepare income statement and then calculate ratios.
  • 33. Management Accounting B.Com (Hons) Semester 4th 33 | Page Prepared by UMA KANT (Research Scholar “LU”, JRF(Commerce), UGC NET(Management), M.Com, MBA FUNCTIONAL CLASSIFICATION OF RATIOS Liquidity Ratios Long-Term Solvency and Leverage Ratios Activity Ratios Asset Management Ratios Profit Abilities Ratios (A)  Current Ratio  Liquid Ratio  Absolute Liquid or Cash Ratios  Interval Measure (B)  Debtors Turnover Ratio  Creditor Turnover Ratio  Inventory Turnover Ratio  Debt/Equity Ratio  Debt to total Capital Ratio  Interest Coverage Ratio  Cash Flow/ Debt  Capital Gearing  Inventory Turnover Ratio  Debtors Turnover Ratio  Fixed Assets Turnover Ratio  Total Assets Turnover Ratio  Working Capital Turnover Ratio  Payable Turnover Ratio  Capital Employed Turnover Ratio (A) In relation to sales  Gross Profit Ratio  Operating Ratio  Operating Ratio  Operative Profit Ratio  Net Profit Ratio  Expenses Ratio (B) In relation to Investments  Return on Investment  Return on Capital  Return on Equity  Return on Total  Resources  Earnings per Share  Price Earnings Ratio Common Size Statement? Common size statement is a form of analysis and interpretation of the financial statement. It is also known as vertical analysis. This method analyses financial
  • 34. Management Accounting B.Com (Hons) Semester 4th 34 | Page Prepared by UMA KANT (Research Scholar “LU”, JRF(Commerce), UGC NET(Management), M.Com, MBA statements by taking into consideration each of the line items as a percentage of the base amount for that particular accounting period. Common size statements are not any kind of financial ratios but are a rather easy way to express financial statements, which makes it easier to analyse those statements. Common size statements are always expressed in the form of percentages. Therefore, such statements are also called 100 per cent statements or component percentage statements as all the individual items are taken as a percentage of 100. Types of Common Size Statements There are two types of common size statements: 1. Common size income statement 2. Common size balance sheet 1. Common Size Income Statement This is one type of common size statement where the sales is taken as the base for all calculations. Therefore, the calculation of each line item will take into account the sales as a base, and each item will be expressed as a percentage of the sales. Use of Common Size Income Statement It helps the business owner in understanding the following points 1. Whether profits are showing an increase or decrease in relation to the sales obtained. 2. Percentage change in cost of goods that were sold during the accounting period. 3. Variation that might have occurred in expense. 4. If the increase in retained earnings is in proportion to the increase in profit of the business. 5. Helps to compare income statements of two or more periods. 6. Recognises the changes happening in the financial statements of the organisation, which will help investors in making decisions about investing in the business. 2. Common Size Balance Sheet:
  • 35. Management Accounting B.Com (Hons) Semester 4th 35 | Page Prepared by UMA KANT (Research Scholar “LU”, JRF(Commerce), UGC NET(Management), M.Com, MBA A common size balance sheet is a statement in which balance sheet items are being calculated as the ratio of each asset in relation to the total assets. For the liabilities, each liability is being calculated as a ratio of the total liabilities. Common size balance sheets can be used for comparing companies that differ in size. The comparison of such figures for the different periods is not found to be that useful because the total figures seem to be affected by a number of factors. Standard values for various assets cannot be established by this method as the trends of the figures cannot be studied and may not give proper results. Common Size Income Statement Format The common size income statement format is as follows:
  • 36. Management Accounting B.Com (Hons) Semester 4th 36 | Page Prepared by UMA KANT (Research Scholar “LU”, JRF(Commerce), UGC NET(Management), M.Com, MBA Preparing Common Size Balance Sheet (1) Take the total of assets or liabilities as 100. (2) Each individual asset is expressed as a percentage of the total assets, i.e., 100 and different liabilities are also calculated as per total liabilities. For example, suppose total assets are around Rs. 4 lakhs, and inventory value is Rs. 1 lakh. In that case, it will be counted as 25% of the total assets. Limitations of Common Size Statement Following are the limitations discussed
  • 37. Management Accounting B.Com (Hons) Semester 4th 37 | Page Prepared by UMA KANT (Research Scholar “LU”, JRF(Commerce), UGC NET(Management), M.Com, MBA 1. It is not helpful in the decision-making process as it does not have any approved benchmark. 2. For a business that is impacted by fluctuations due to seasonality, it can be misleading. Comparative Statements? Comparative statements or comparative financial statements are statements of financial position of a business at different periods. These statements help in determining the profitability of the business by comparing financial data from two or more accounting periods. The data from two or more periods are updated side by side, which is why it is also known as Horizontal Analysis. The advantage of such an analysis is that it helps investors to identify the trends of business, check a company’s progress and also compare it with that of its competitors. The financial data will be considered to be comparative only when the same set of accounting principles are being used for preparing the statements. Types of Comparative Statements There are two types of comparative statements which are as follows 1. Comparative income statement 2. Comparative balance sheet Comparative Income Statement Income statements provide the details about the results of the operations of the business, and comparative income statements provide the progress made by the business over a period of a few years. This statement also helps in ascertaining the changes that occur in each line item of the income statement over different periods. The comparative income statement not only shows the operational efficiency of the business but also helps in comparing the results with the competitors, over different
  • 38. Management Accounting B.Com (Hons) Semester 4th 38 | Page Prepared by UMA KANT (Research Scholar “LU”, JRF(Commerce), UGC NET(Management), M.Com, MBA time periods. This is possible by comparing the operational data spanning multiple periods of accounting. The following points should be studied when analysing a comparative income statement 1. Compare the increase or decrease in sales with a relative increase in the cost of goods sold 2. Studying the operational profits of the business 3. Overall profitability of the business can be analysed by an increase or decrease in the net profit Steps in preparing a comparative income statement The below steps are followed 1. Specify absolute figures of all the items related to the accounting period under consideration. 2. Determine the absolute change that has occurred in the items of the income statement. It can be achieved by finding the difference between previous year values with the current year values. 3. Calculate the percentage change in the items present in the current statement with respect to previous year statements. The format of a comparative income statement is as follows:
  • 39. Management Accounting B.Com (Hons) Semester 4th 39 | Page Prepared by UMA KANT (Research Scholar “LU”, JRF(Commerce), UGC NET(Management), M.Com, MBA Comparative Balance Sheet Comparative balance sheet analyses the assets and liabilities of business for the current year and also compares the increase or decrease in them in relative as well as absolute parameters. A comparative balance sheet not only provides the state of assets and liabilities in different time periods, but it also provides the changes that have taken place in individual assets and liabilities over different accounting periods. The following points should be studied when analysing a comparative balance sheet 1. The present financial and liquidity position (study working capital) 2. The financial position of the business in the long term
  • 40. Management Accounting B.Com (Hons) Semester 4th 40 | Page Prepared by UMA KANT (Research Scholar “LU”, JRF(Commerce), UGC NET(Management), M.Com, MBA 3. The profitability of the business Steps in preparing a comparative balance sheet The below steps can be followed 1. Determine the absolute value of assets and liabilities related to the accounting periods. 2. Determine absolute changes in the items of the balance sheet relative to the accounting periods in question. 3. Calculate the percentage change in assets and liabilities by comparing current year values with values of previous accounting periods. The format of a comparative balance sheet is as follows:
  • 41. Management Accounting B.Com (Hons) Semester 4th 41 | Page Prepared by UMA KANT (Research Scholar “LU”, JRF(Commerce), UGC NET(Management), M.Com, MBA difference between the comparative and common size financial statements.
  • 42. Management Accounting B.Com (Hons) Semester 4th 42 | Page Prepared by UMA KANT (Research Scholar “LU”, JRF(Commerce), UGC NET(Management), M.Com, MBA Comparative Financial Statement Common Size Financial Statement Definition Comparative financial statement is a kind of document that presents the financial performance of the organisations side by side with the previous year performances, in order to compare the growth of business over a period of time Common size financial statement is a way of presenting financial information of a business by expressing the components of financial statements as percentages. Type of analysis Comparative statements are also known as horizontal analysis as financial statements are compared side by side Common size statements are also known as vertical analysis as data is analysed vertically Purpose Comparative statements are used for comparing financial performance for internal purposes and for inter-firm comparison Common size statements are prepared for the reference of stakeholders. Types of comparison made Comparative statements make use of both absolute figures and percentages Common size statements use only percentage form