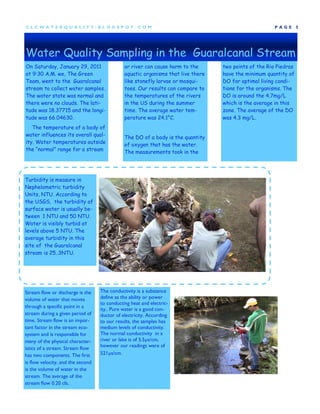
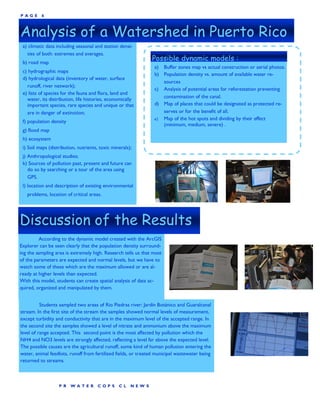
PR Water Cops CL
                     C L C W A T E R Q U A L I T Y . B L O G S P O T . C O M


                     V O L U M E   # 2                                             A P R I L   1 3 ,   2 0 1 1


Introduction p. 1

Abstract p. 1
                     Introduction
Purpose p. 2           Where does the water        (CWA, for its acronym in     stances to a body of wa-
Materials p. 2
                     you use come from? Do         English) establishes that    ter can damage its qual-
                     you always have enough        water quality should be      ity, which stops it from
Procedure p. 3       water or is it limited at     evaluated and maintained     being suitable for what it
                     the place where you live?     in accordance with estab-    was designated.
Results p. 4-5
                     What factors affect the       lished (USEPA, 2002).
                                                                                 The concept of water
Result Analysis p.   amount and quality of the
                                                                                pollution depends on the
5-6                  water where you live?                                      purpose to which the wa-
Conclusion p. 6        The over enrichment                                      ter is designated.
                     with nutrients and the
                     contamination with patho-
                     gens of the bodies of wa-
                                                      Excessive amount of
                     ter negatively affect
                                                   nutrients to bodies of
                     their use for public con-
                     sumption, for industry        water reduce their water
                                                   quality, which can lead to
                     and agriculture, and as
                     being habitat for wild life   an eutrophic state.
                     (USEPA 2005).                   We understand that
                                                   the addition of sub-
                       The Clean Water Act


                     Abstract
                       The multidisciplinary       of land use can affect       and Think-quest.org or
                     project Water Cops PR         plant and animal communi-    Blogger.
                     CL, will make students to     ties that live along it.
                                                                                This project also has the
                     explore their own water-
                                                      This project also in-     purpose of making stu-
                     shed and understand what      tends to develop technol-    dents create conscious-
                     happens to the flow of
                                                   ogy skills on students in    ness about the environ-
                     water over them. The
                                                   applications such as Log-    ment they live in.
                     students will also visual-
                                                   ger Pro and Vernier Soft-
                     ize the way in which hu-      ware LabQuest, MS Pub-
                     man activities impact the     lisher 2007, ArcGIS Ex-
                     river’s hydrology and the     plorer , Adobe Premier
                     way in which the change
P AGE    2


                  Purpose
                  Students will investigate their own water-       (Spanish), and Technology - Video Docu-
                  shed to understand the flow of water in          mentary - Adobe Premier. Geography
                  them, how human activities can affect its        and Technology - GeoMapping - ArcEx-
                  hydrology, and how the usage of land by          plorer, in English (Spanish), and Technol-
                  humans can also affect the hydrology wa-         ogy - Blog Thinkquest.org Google Blog-
                  tershed.                                         ger.
                  Students from elementary through high
                  school level will be involved in this project.
                  During the development of the students are
                  in-they involve sub-tasks and tasks to com-
                  plete the following products :
                  "In Science, Mathematics and Technology -
                  Scientific Article (Journal)-In English


                  Materials
                  Water Cops CL project is a multi-application where students have the oppor-
                  tunity to perform research on water quality from several points of Rio Pie-
                  dras. The students will be using technologies such as: Vernier Technology to
                  take water quality measurements. It will be chosen an urban water body close
                  to the school and two sampling locations will be selected in this body of water.
                  There will be three trials for each sample using the different sensors of
                  Vernier LabQuest. Some of the measurements which will be performed are:
                  -Turbidity
                  -Conductivity                   This measurements were took using :
                  -Alkalinity
                                                      Vernier Labquest Sensors
                  -pH
                  -Temperature
                  -Dissolved Oxygen
                  - Stream Flow


                                                                                    Vernier
                                                                      Labquest Water Quality
                                                                                kit


   P R   WA TER   COP S     CL    NEW S
CLCW A TERQUA LIT Y.BLOG SP OT .COM                                                                                 P AGE   3


  Procedure
   Part I. Physical Assessment of Wa-     Part II. Chemical Evaluation of Wa-     Part III. Biological Assessment
  ter Quality                             ter Quality


  Description: As a component of          Description: As a component of          Description: As a component of
  water quality research, the students    water quality research, the students    water quality research, the students
  observe, measure and map the            use handhelds LabQuest Vernier          collect, identify and analyze data.
  physical characteristics of a stream    scientific and current sensors for      This information is analyzed to
  of water. Quantitatively, using         measuring pH, dissolved oxygen,         draw conclusions given the local
  handheld computers scientific Lab       temperature and turbidity. Students     creek water.
  Quest Vernier sensors and current       develop a hypothesis, record data
                                                                                  Objectives: At the end of the pro-
  flow, the students measure different    obtained including measurements
                                                                                  gram, students will be able to:
  parameters (mentioned in the ma-        and observations. So students may
                                          do a scientific conclusion.             1. Define the terms watershed, ero-
  terials section). Qualitatively, stu-
                                                                                  sion, contamination and local water-
  dents use the skills of observation     Objectives: Upon completion of the
                                                                                  sheds.
  to notice specific characteristics of   project, students will be able to:
                                                                                  2. Make graphs with the collected
  the river.                              1.Define the terms of watersheds,
                                                                                  data.
  Objectives: Upon completion of the      source of pollution including indi-
  project, students will be able to:      rect sources, pH, dissolved oxygen
  1. Define the terms of the water-       and turbidity.
  shed, erosion, and deposition.          2. Identify different sources of con-
  2. Identify local watersheds by         tamination.
  name.                                   3. Explain how pollutants travel
  3. Use scientific tools to determine    through the river basin and explain
  physical water quality by collecting    how different chemical proportions
  data.                                   of a stream affect water quality.
  4. Build a watershed model-map          4.Develop products with the ob-
  using the titles, legends and their     tained results.
  role.                                   5. Use math while collecting data.
  5. Develop ways to maintain a           6. Apply the scientific method.
  healthy water body based on physi-
  cal, chemical and biological evalua-
  tion.
P AGE    4

                   Water Quality Sampling in the Rio Piedras
                   On Saturday, January 22,        “normal” range for a            quantity of DO for optimal
                   2011, at 10:21 A.M. we,         stream or a river can cause     for optimal conditions for
                   The Green Team, went to         harm to the aquatic organ-      the organisms. The average
                   the Rio Piedras to collect      isms that live there like       DO of this river is 4.7 mg/L.
                   water samples. The water        stonefly larvae or mosqui-         The pH is a measure of
                   state was normal and the        toes. The average tempera-      acidity or alkalinity of a solu-
                   sky was clear with isolated     ture of this river is 23.7 °    tion. The pH indicates the
                   clouds. The latitude was        C.                              concentration of hydronium
                   18.38837 and the longitude         The dissolved oxygen of      ion (H30 +) present in cer-
                   was 66.05904.                   a body is the quantity of       tain substances, in this case
                       The temperature of a        oxygen that the water has.      water. According to our re-
                   body of water influences        The measurements took in        search, the Rio Piedras has
                   its overall quality. Water      the two points of the Rio       an average pH of 7.68. This
                   temperatures outside the        Piedras have the minimum        pH is optimal for the survival


                  of all marine organisms. Water quality at this point of the Rio Piedras is generally acceptable for
                  domestic use and water.
                     Turbidity is a measure of water’s lack of clarity. Water with high turbidity is cloudy, while
                  water with low turbidity is clear. The cloudiness is produced by light reflecting off of particles in
                  water; therefore, the more particles in the water, the higher the turbidity.
                     Stream flow or discharge is the volume of water that moves through a specific point in a
                  stream during a given period of time. Stream flow is an important factor in the stream ecosys-
                  tem and is responsible for many of the physical characteristics of a stream. Stream flow has two
                  components. The first is flow velocity, and the second is the volume of water in the stream.
                  The average of the stream flow was 0.18 cfs.

                     The conductivity of a substance defines as the ability or power of conducting heat, electricity.
                  Pure water is a good conductor of electricity. According to our results, the sample has medium
                  levels of conductivity. The normal conductivity level in a river or lake is of 5.5 μS/cm, however
                  our readings were of 381 μS/cm. The average of the conductivity was 381 μS/cm.


   P R   WA TER    COP S     CL    NEW S
CLCW A TERQUA LIT Y.BLOG SP OT .COM                                                                    P AGE      5


Water Quality Sampling in the Guaralcanal Stream
On Saturday, January 29, 2011                 or river can cause harm to the      two points of the Rio Piedras
at 9:30 A.M. we, The Green                    aquatic organisms that live there   have the minimum quantity of
Team, went to the Guaralcanal                 like stonefly larvae or mosqui-     DO for optimal living condi-
stream to collect water samples.              toes. Our results can compare to    tions for the organisms. The
The water state was normal and                the temperatures of the rivers      DO is around the 4.7mg/L
there were no clouds. The lati-               in the US during the summer         which is the average in this
tude was 18.37715 and the longi-              time. The average water tem-        zone. The average of the DO
tude was 66.04630.                            perature was 24.1°C.                was 4.3 mg/L.
   The temperature of a body of
water influences its overall qual-            The DO of a body is the quantity
ity. Water temperatures outside               of oxygen that has the water.
the “normal” range for a stream
                                              The measurements took in the


Turbidity is measure in
Nephelometric turbidity
Units, NTU. According to
the USGS, the turbidity of
surface water is usually be-
tween 1 NTU and 50 NTU.
Water is visibly turbid at
levels above 5 NTU. The
average turbidity in this
site of the Guaralcanal
stream is 25..3NTU.


Stream flow or discharge is the    The conductivity is a substance
volume of water that moves         define as the ability or power
                                   to conducting heat and electric-
through a specific point in a
                                   ity.. Pure water is a good con-
stream during a given period of    ductor of electricity. According
time. Stream flow is an impor-     to our results, the samples has
tant factor in the stream eco-     medium levels of conductivity.
system and is responsible for      The normal conductivity in a
many of the physical character-    river or lake is of 5.5µs/cm,
istics of a stream. Stream flow    however our readings were of
has two components. The first      521µs/cm.
is flow velocity, and the second
is the volume of water in the
stream. The average of the
stream flow 0.20 cfs.
P AGE     6


Analysis of a Watershed in Puerto Rico
 a) climatic data including seasonal and station densi-
   ties of both: extremes and averages.
 b) road map
                                                               Possible dynamic models :
                                                                a) Buffer zones map vs actual construction or aerial photos.
 c) hydrographic maps
                                                                b) Population density vs. amount of available water re-
 d) hydrological data (inventory of water, surface
                                                                   sources
   runoff, river network);
                                                                c) Analysis of potential areas for reforestation preventing
 e) lists of species for the fauna and flora, land and
   water, its distribution, life histories, economically           contamination of the canal.
   important species, rare species and unique or that           d) Map of places that could be designated as protected re-
   are in danger of extinction;                                    serves or for the benefit of all.
                                                                e) Map of the hot spots and dividing by their effect
 f) population density
                                                                   (minimum, medium, severe) .
 g) flood map
 h) ecosystem
 i) Soil maps (distribution, nutrients, toxic minerals);
 j) Anthropological studies;
 k) Sources of pollution past, present and future can
    do so by searching or a tour of the area using
    GPS.
 l) location and description of existing environmental
   problems, location of critical areas.


Discussion of the Results
         According to the dynamic model created with the ArcGIS
Explorer can be seen clearly that the population density surround-
ing the sampling area is extremely high. Research tells us that most
of the parameters are expected and normal levels, but we have to
watch some of these which are the maximum allowed or are al-
ready at higher levels than expected.
With this model, students can create spatial analysis of data ac-
quired, organized and manipulated by them.


          Students sampled two areas of Rio Piedras river: Jardín Botánico and Guaralcanal
stream. In the first site of the stream the samples showed normal levels of measurement,
except turbidity and conductivity that are in the maximum level of the accepted range. In
the second site the samples showed a level of nitrate and ammonium above the maximum
level of range accepted. This second point is the most affected by pollution which the
NH4 and NO3 levels are strongly affected, reflecting a level far above the expected level.
The possible causes are the agricultural runoff, some kind of human pollution entering the
water, animal feedlots, runoff from fertilized fields, or treated municipal wastewater being
returned to streams.


                   P R   WA TER       COP S      CL    NEW S
CLCW A TERQUA LIT Y.BLOG SP OT .COM                                          P AGE   7


                                Contact us
                       clcwaterquality.blogspot.com


                            Colegio Mater Salvatoris


                                                       COMPUTER LEARNING

                                                       17 años apoyando la educación en
                                                                 Puerto Rico

                                                            Edificio BBVA
                                                            Calle Amarilla
                                                            #206 San Juan
                                                            Puerto Rico

                                                            Phone: 787-764-2222
                                                            Fax: 787-764-9999
                                                            watercops@clcpr.com

Magazine water cops

  • 1.
    PR Water CopsCL C L C W A T E R Q U A L I T Y . B L O G S P O T . C O M V O L U M E # 2 A P R I L 1 3 , 2 0 1 1 Introduction p. 1 Abstract p. 1 Introduction Purpose p. 2 Where does the water (CWA, for its acronym in stances to a body of wa- Materials p. 2 you use come from? Do English) establishes that ter can damage its qual- you always have enough water quality should be ity, which stops it from Procedure p. 3 water or is it limited at evaluated and maintained being suitable for what it the place where you live? in accordance with estab- was designated. Results p. 4-5 What factors affect the lished (USEPA, 2002). The concept of water Result Analysis p. amount and quality of the pollution depends on the 5-6 water where you live? purpose to which the wa- Conclusion p. 6 The over enrichment ter is designated. with nutrients and the contamination with patho- gens of the bodies of wa- Excessive amount of ter negatively affect nutrients to bodies of their use for public con- sumption, for industry water reduce their water quality, which can lead to and agriculture, and as being habitat for wild life an eutrophic state. (USEPA 2005). We understand that the addition of sub- The Clean Water Act Abstract The multidisciplinary of land use can affect and Think-quest.org or project Water Cops PR plant and animal communi- Blogger. CL, will make students to ties that live along it. This project also has the explore their own water- This project also in- purpose of making stu- shed and understand what tends to develop technol- dents create conscious- happens to the flow of ogy skills on students in ness about the environ- water over them. The applications such as Log- ment they live in. students will also visual- ger Pro and Vernier Soft- ize the way in which hu- ware LabQuest, MS Pub- man activities impact the lisher 2007, ArcGIS Ex- river’s hydrology and the plorer , Adobe Premier way in which the change
  • 2.
    P AGE 2 Purpose Students will investigate their own water- (Spanish), and Technology - Video Docu- shed to understand the flow of water in mentary - Adobe Premier. Geography them, how human activities can affect its and Technology - GeoMapping - ArcEx- hydrology, and how the usage of land by plorer, in English (Spanish), and Technol- humans can also affect the hydrology wa- ogy - Blog Thinkquest.org Google Blog- tershed. ger. Students from elementary through high school level will be involved in this project. During the development of the students are in-they involve sub-tasks and tasks to com- plete the following products : "In Science, Mathematics and Technology - Scientific Article (Journal)-In English Materials Water Cops CL project is a multi-application where students have the oppor- tunity to perform research on water quality from several points of Rio Pie- dras. The students will be using technologies such as: Vernier Technology to take water quality measurements. It will be chosen an urban water body close to the school and two sampling locations will be selected in this body of water. There will be three trials for each sample using the different sensors of Vernier LabQuest. Some of the measurements which will be performed are: -Turbidity -Conductivity This measurements were took using : -Alkalinity Vernier Labquest Sensors -pH -Temperature -Dissolved Oxygen - Stream Flow Vernier Labquest Water Quality kit P R WA TER COP S CL NEW S
  • 3.
    CLCW A TERQUALIT Y.BLOG SP OT .COM P AGE 3 Procedure Part I. Physical Assessment of Wa- Part II. Chemical Evaluation of Wa- Part III. Biological Assessment ter Quality ter Quality Description: As a component of Description: As a component of Description: As a component of water quality research, the students water quality research, the students water quality research, the students observe, measure and map the use handhelds LabQuest Vernier collect, identify and analyze data. physical characteristics of a stream scientific and current sensors for This information is analyzed to of water. Quantitatively, using measuring pH, dissolved oxygen, draw conclusions given the local handheld computers scientific Lab temperature and turbidity. Students creek water. Quest Vernier sensors and current develop a hypothesis, record data Objectives: At the end of the pro- flow, the students measure different obtained including measurements gram, students will be able to: parameters (mentioned in the ma- and observations. So students may do a scientific conclusion. 1. Define the terms watershed, ero- terials section). Qualitatively, stu- sion, contamination and local water- dents use the skills of observation Objectives: Upon completion of the sheds. to notice specific characteristics of project, students will be able to: 2. Make graphs with the collected the river. 1.Define the terms of watersheds, data. Objectives: Upon completion of the source of pollution including indi- project, students will be able to: rect sources, pH, dissolved oxygen 1. Define the terms of the water- and turbidity. shed, erosion, and deposition. 2. Identify different sources of con- 2. Identify local watersheds by tamination. name. 3. Explain how pollutants travel 3. Use scientific tools to determine through the river basin and explain physical water quality by collecting how different chemical proportions data. of a stream affect water quality. 4. Build a watershed model-map 4.Develop products with the ob- using the titles, legends and their tained results. role. 5. Use math while collecting data. 5. Develop ways to maintain a 6. Apply the scientific method. healthy water body based on physi- cal, chemical and biological evalua- tion.
  • 4.
    P AGE 4 Water Quality Sampling in the Rio Piedras On Saturday, January 22, “normal” range for a quantity of DO for optimal 2011, at 10:21 A.M. we, stream or a river can cause for optimal conditions for The Green Team, went to harm to the aquatic organ- the organisms. The average the Rio Piedras to collect isms that live there like DO of this river is 4.7 mg/L. water samples. The water stonefly larvae or mosqui- The pH is a measure of state was normal and the toes. The average tempera- acidity or alkalinity of a solu- sky was clear with isolated ture of this river is 23.7 ° tion. The pH indicates the clouds. The latitude was C. concentration of hydronium 18.38837 and the longitude The dissolved oxygen of ion (H30 +) present in cer- was 66.05904. a body is the quantity of tain substances, in this case The temperature of a oxygen that the water has. water. According to our re- body of water influences The measurements took in search, the Rio Piedras has its overall quality. Water the two points of the Rio an average pH of 7.68. This temperatures outside the Piedras have the minimum pH is optimal for the survival of all marine organisms. Water quality at this point of the Rio Piedras is generally acceptable for domestic use and water. Turbidity is a measure of water’s lack of clarity. Water with high turbidity is cloudy, while water with low turbidity is clear. The cloudiness is produced by light reflecting off of particles in water; therefore, the more particles in the water, the higher the turbidity. Stream flow or discharge is the volume of water that moves through a specific point in a stream during a given period of time. Stream flow is an important factor in the stream ecosys- tem and is responsible for many of the physical characteristics of a stream. Stream flow has two components. The first is flow velocity, and the second is the volume of water in the stream. The average of the stream flow was 0.18 cfs. The conductivity of a substance defines as the ability or power of conducting heat, electricity. Pure water is a good conductor of electricity. According to our results, the sample has medium levels of conductivity. The normal conductivity level in a river or lake is of 5.5 μS/cm, however our readings were of 381 μS/cm. The average of the conductivity was 381 μS/cm. P R WA TER COP S CL NEW S
  • 5.
    CLCW A TERQUALIT Y.BLOG SP OT .COM P AGE 5 Water Quality Sampling in the Guaralcanal Stream On Saturday, January 29, 2011 or river can cause harm to the two points of the Rio Piedras at 9:30 A.M. we, The Green aquatic organisms that live there have the minimum quantity of Team, went to the Guaralcanal like stonefly larvae or mosqui- DO for optimal living condi- stream to collect water samples. toes. Our results can compare to tions for the organisms. The The water state was normal and the temperatures of the rivers DO is around the 4.7mg/L there were no clouds. The lati- in the US during the summer which is the average in this tude was 18.37715 and the longi- time. The average water tem- zone. The average of the DO tude was 66.04630. perature was 24.1°C. was 4.3 mg/L. The temperature of a body of water influences its overall qual- The DO of a body is the quantity ity. Water temperatures outside of oxygen that has the water. the “normal” range for a stream The measurements took in the Turbidity is measure in Nephelometric turbidity Units, NTU. According to the USGS, the turbidity of surface water is usually be- tween 1 NTU and 50 NTU. Water is visibly turbid at levels above 5 NTU. The average turbidity in this site of the Guaralcanal stream is 25..3NTU. Stream flow or discharge is the The conductivity is a substance volume of water that moves define as the ability or power to conducting heat and electric- through a specific point in a ity.. Pure water is a good con- stream during a given period of ductor of electricity. According time. Stream flow is an impor- to our results, the samples has tant factor in the stream eco- medium levels of conductivity. system and is responsible for The normal conductivity in a many of the physical character- river or lake is of 5.5µs/cm, istics of a stream. Stream flow however our readings were of has two components. The first 521µs/cm. is flow velocity, and the second is the volume of water in the stream. The average of the stream flow 0.20 cfs.
  • 6.
    P AGE 6 Analysis of a Watershed in Puerto Rico a) climatic data including seasonal and station densi- ties of both: extremes and averages. b) road map Possible dynamic models : a) Buffer zones map vs actual construction or aerial photos. c) hydrographic maps b) Population density vs. amount of available water re- d) hydrological data (inventory of water, surface sources runoff, river network); c) Analysis of potential areas for reforestation preventing e) lists of species for the fauna and flora, land and water, its distribution, life histories, economically contamination of the canal. important species, rare species and unique or that d) Map of places that could be designated as protected re- are in danger of extinction; serves or for the benefit of all. e) Map of the hot spots and dividing by their effect f) population density (minimum, medium, severe) . g) flood map h) ecosystem i) Soil maps (distribution, nutrients, toxic minerals); j) Anthropological studies; k) Sources of pollution past, present and future can do so by searching or a tour of the area using GPS. l) location and description of existing environmental problems, location of critical areas. Discussion of the Results According to the dynamic model created with the ArcGIS Explorer can be seen clearly that the population density surround- ing the sampling area is extremely high. Research tells us that most of the parameters are expected and normal levels, but we have to watch some of these which are the maximum allowed or are al- ready at higher levels than expected. With this model, students can create spatial analysis of data ac- quired, organized and manipulated by them. Students sampled two areas of Rio Piedras river: Jardín Botánico and Guaralcanal stream. In the first site of the stream the samples showed normal levels of measurement, except turbidity and conductivity that are in the maximum level of the accepted range. In the second site the samples showed a level of nitrate and ammonium above the maximum level of range accepted. This second point is the most affected by pollution which the NH4 and NO3 levels are strongly affected, reflecting a level far above the expected level. The possible causes are the agricultural runoff, some kind of human pollution entering the water, animal feedlots, runoff from fertilized fields, or treated municipal wastewater being returned to streams. P R WA TER COP S CL NEW S
  • 7.
    CLCW A TERQUALIT Y.BLOG SP OT .COM P AGE 7 Contact us clcwaterquality.blogspot.com Colegio Mater Salvatoris COMPUTER LEARNING 17 años apoyando la educación en Puerto Rico Edificio BBVA Calle Amarilla #206 San Juan Puerto Rico Phone: 787-764-2222 Fax: 787-764-9999 watercops@clcpr.com