SlideShare a Scribd company logo
1 of 48
Download to read offline
2022
MACROECONOMIC
DEVELOPMENTS
REPORT
SEPTEMBER
MACROECONOMIC DEVELOPMENTS REPORT
September 2022
MACROECONOMIC DEVELOPMENTS REPORT
September 2022, No 35
© Latvijas Banka, 2022
The source is to be indicated when reproduced.
Latvijas Banka
K. Valdemāra iela 2A, Riga, LV-1050, Latvia
Tel.: +371 67022300 info@bank.lv
https://www.bank.lv; https://www.macroeconomics.lv
2
MACROECONOMIC DEVELOPMENTS REPORT
September 2022
CONTENTS
Contents
Abbreviations 3
Additional information 3
Topical issues in brief 4
1. External Demand 5
2. Financial Conditions 10
2.1 Decisions of the ECB and other major central banks 10
2.2 Global financial market developments 13
2.3 Financing conditions in the Latvian economy 15
3. Sectoral Development 20
3.1 Manufacturing 20
3.2 Construction 21
3.3 Real estate sector 22
3.4 Trade 23
3.5 Transport 23
3.6 Energy 24
4. GDPAnalysis from the Demand Side 26
4.1 Domestic demand 26
4.2 Government consumption 27
4.3 Trade balance 28
5. Labour Market, Costs and Prices 31
Box 1. Which sectors will be most affected by the increase in the minimum wage? 32
Box 2. Inflation differences across the Baltics and other euro area countries 35
6. Conclusions and Forecasts 40
7. Analysis of Scenarios 42
7.1 Assessment of the impact of government support provided during the energy
price crisis 42
7.2 Impact of restrictions on the availability of natural gas on Latvia's economy 44
3
MACROECONOMIC DEVELOPMENTS REPORT
September 2022
ABBREVIATIONS
Abbreviations
€STR – euro short-term rate
AS – joint stock company
EC – European Commission
ECB – European Central Bank
EONIA – euro overnight index average
EU – European Union
EURIBOR – Euro Interbank Offered Rate
FRS – US Federal Reserve System
GDP – Gross Domestic Product
HICP – Harmonised Index of Consumer Prices
IMF – International Monetary Fund
SEA – State Employment Agency
US – United States of America
VAT – value added tax
Additional information
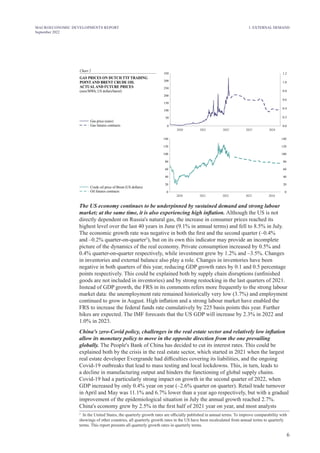
Unless specified otherwise, the cut-off date for the information used in the publication Macroeconomic
Developments Report (September 2022, No 35) is 12 September 2022. The cut-off date for the
information used in the forecasts is 12 September 2022, and 15 August for the information used in
some technical assumptions.
Data sources for charts are Bloomberg (Charts 1 and 5–9), Refinitiv (Charts 2, 10 and 14), the EC
(Charts 3, 4, 20, 27–29, 33, 36 and 2.1–2.7), Latvijas Banka (Charts 5, 11–16, 18, 20, 23, 25–28,
1.1, 33–35, 2.3–2.5, 2.7 and 37–41), the Central Statistical Bureau (Charts 12, 15, 18–20, 22–26,
28 and 30–32), the Treasury (Chart 17), SIAARCO REAL ESTATE (Chart 21), the State Unified
Computerised Land Register (Chart 21), the World Trade Organisation (Chart 29), Brent (Chart 34),
Title Transfer Facility (Chart 35), the ECB (Chart 2.4) as well as the Ministries of Economics, Welfare
and Finance (Chart 37).
Statistical data are available at: https://www.bank.lv/en/statistics/stat-data/key-macroeconomic-
indicators.
4
MACROECONOMIC DEVELOPMENTS REPORT
September 2022
Topical issues in brief
TOPICAL ISSUES IN BRIEF
The rise in energy and food prices triggered by the war, as well as the disruption
of gas supply in Europe have led to sharp inflation hikes. Hence, the inflation
forecast for Latvia has also been revised upwards.
The high inflation dampens growth across the world, including Latvia. As the
population's purchasing power and consumption decline, a short-lived recession
is impending.
Central banks, including the ECB, are on the way to removing monetary policy
accommodation.
Inflation in Latvia exceeds the euro area average, reflecting a higher share of
food and energy in consumption, a sharper increase in their prices as well as in
wages.
Exports are constrained by weaker demand, falling wood prices and large stocks
of raw materials.
The tight labour market will mitigate the impact of the crisis on unemployment
and maintain wage increases in companies even in the context of rising energy
costs.
Government support and spending of household savings will partly absorb the
effects of the energy price crisis on the economy.
The issues of energy independence and energy efficiency have become
more relevant.
5
MACROECONOMIC DEVELOPMENTS REPORT
September 2022
1. EXTERNAL DEMAND
1. External Demand
High inflation has become the main downside risk to growth. Lower imports of natural gas
from Russia and record-high prices create uncertainty about both prospects for economic
activity and the heating season in Europe. Meanwhile, limited exports of agricultural
commodities from Russia and Ukraine contribute to food price inflation. High energy and
food prices limit household consumption and create an undesirable risk of de-anchoring
of inflation expectations, forcing central banks to tighten their monetary policy. According
to the IMF, significant downside risks to growth also include China's zero-Covid policy
and the crisis in China's real estate sector, as well as a higher risk of default in developing
countries, driven both by high food prices and higher interest rates due to tighter monetary
policy of major central banks. The war in Ukraine and the escalated relations between the
US and China pose significant geopolitical risks that may result in further adjustments to the
development of the global economy.
According to the latest forecast of the IMF1
published in July 2022, global growth will reach
3.2% this year, i.e. 0.4 percentage points less than projected in April. It will slow down
further to 2.9% in 2023 (a negative revision of 0.7 percentage point). Meanwhile inflation
could reach 8.3% in 2022 and 5.7% in 2023 (0.9 percentage point higher than projected in
April). In emerging market and developing economies, where energy and food expenditure
accounts for a larger share of the consumption basket, inflation is expected to be higher in
2022 and 2023 than in developed countries.
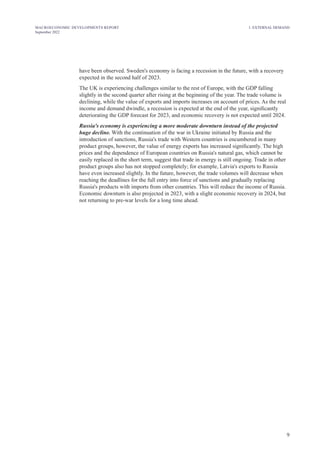
Energy and food prices remain stubbornly high. Although the price of natural gas on the
Dutch TTF trading point stabilised around EUR 80–100 per MWh in May and June, later
it rose rapidly, reaching even more than EUR 300 per MWh. The main reason for these
fluctuations is the growing concerns about the ability of European countries to fill sufficient
gas reserves for the upcoming heating season, with Russia constantly reducing supply
volumes. These concerns reached another turning point in early September, when Russia
completely stopped supplies via Nord Stream 1 pipeline and announced that the resumption
of supplies is possible only if the EU sanctions put in place after the beginning of the war
were lifted. The current level of natural gas prices is about 18 times higher compared to
September 20192
, although it is also characterised by a very high volatility in response to the
incoming information on the sufficiency and availability of natural gas.
Chart 1
WHEAT AND MAIZE PRICES
ON EURONEXT EXCHANGE
euro/t)
(
Wheat
Maize 0
50
100
150
200
250
300
350
400
450
500
0
50
100
150
200
250
300
350
400
450
500
1 2
2016 2020 2021
3 4
2022
2017 2018 2019
3 1 2
4 3 1 2
4 3 1 2
4 3 1 2
4 3 1 2
4 3
1 2
In the oil market, however, the situation is much less dramatic. Consumer sentiment there
was more positive on account of the oil prices falling to pre-war levels (around USD 90 per
barrel), driven by the rising global economic recession expectations. This happened despite
the agreement reached by the EU countries to ban Russia's oil imports by sea at the end
of 2022. Lower oil prices are reflected in cheaper fuels, easing inflationary pressures. As
Ukraine's grain exports partly resumed, wheat and maize prices also fell, but they remained
high at around 14% above pre-war levels.
1
International Monetary Fund. World Economic Outlook Update, July 2022.
2
Based on monthly averages (in 2022, from 1 to 8 September inclusive).
6
MACROECONOMIC DEVELOPMENTS REPORT
September 2022
Chart 2
GAS PRICES ON DUTCH TTF TRADING
POINT AND BRENT CRUDE OIL
ACTUALAND FUTURE PRICES
euro/MWh; US dollars/barrel)
(
Gas price (euro)
Gas futures contracts 0.0
0.2
0.4
0.6
0.8
1.0
1.2
0
50
100
150
200
250
300
350
0
20
40
60
80
100
120
140
2020 2022 2023 2024
2021
2020 2022 2023 2024
2021
0
20
40
60
80
100
120
140
Crude oil price of Brent (US dollars)
Oil futures contracts
The US economy continues to be underpinned by sustained demand and strong labour
market; at the same time, it is also experiencing high inflation. Although the US is not
directly dependent on Russia's natural gas, the increase in consumer prices reached its
highest level over the last 40 years in June (9.1% in annual terms) and fell to 8.5% in July.
The economic growth rate was negative in both the first and the second quarter (–0.4%
and –0.2% quarter-on-quarter3
), but on its own this indicator may provide an incomplete
picture of the dynamics of the real economy. Private consumption increased by 0.5% and
0.4% quarter-on-quarter respectively, while investment grew by 1.2% and –3.5%. Changes
in inventories and external balance also play a role. Changes in inventories have been
negative in both quarters of this year, reducing GDP growth rates by 0.1 and 0.5 percentage
points respectively. This could be explained both by supply chain disruptions (unfinished
goods are not included in inventories) and by strong restocking in the last quarters of 2021.
Instead of GDP growth, the FRS in its comments refers more frequently to the strong labour
market data: the unemployment rate remained historically very low (3.7%) and employment
continued to grow in August. High inflation and a strong labour market have enabled the
FRS to increase the federal funds rate cumulatively by 225 basis points this year. Further
hikes are expected. The IMF forecasts that the US GDP will increase by 2.3% in 2022 and
1.0% in 2023.
China's zero-Covid policy, challenges in the real estate sector and relatively low inflation
allow its monetary policy to move in the opposite direction from the one prevailing
globally. The People's Bank of China has decided to cut its interest rates. This could be
explained both by the crisis in the real estate sector, which started in 2021 when the largest
real estate developer Evergrande had difficulties covering its liabilities, and the ongoing
Covid-19 outbreaks that lead to mass testing and local lockdowns. This, in turn, leads to
a decline in manufacturing output and hinders the functioning of global supply chains.
Covid-19 had a particularly strong impact on growth in the second quarter of 2022, when
GDP increased by only 0.4% year on year (–2.6% quarter on quarter). Retail trade turnover
in April and May was 11.1% and 6.7% lower than a year ago respectively, but with a gradual
improvement of the epidemiological situation in July the annual growth reached 2.7%.
China's economy grew by 2.5% in the first half of 2021 year on year, and most analysts
3
In the United States, the quarterly growth rates are officially published in annual terms. To improve comparability with
showings of other countries, all quarterly growth rates in the US have been recalculated from annual terms to quarterly
terms. This report presents all quarterly growth rates in quarterly terms.
1. EXTERNAL DEMAND
7
MACROECONOMIC DEVELOPMENTS REPORT
September 2022
1. EXTERNAL DEMAND
believe that China will not achieve the government's 5.5% yearly GDP growth target this
year (the IMF's June forecast for China is an increase of 3.3%). Economic difficulties in
China significantly slow down the growth of the global economy through a weaker supply.
Japan's recovery after the pandemic is more stable but at the same time more temperate.
The GDP remained almost unchanged in the first quarter of 2022, but in the second quarter
it increased by 0.9% quarter on quarter. Private consumption increased by 0.3% and 1.2%
respectively, while the external sector did not provide a significant support; this is partly
explained by the slowdown in China. Both in Japan and China, inflation remains much lower
than in the rest of the world. Weaker consumption and cultural background do not allow
producers to raise prices faster; therefore, the annual consumer price inflation was only 2.6%
in Japan and 2.7% in China.
In the euro area, strong recovery in the first half of the year is overshadowed by recession
expectations. Despite the geographical proximity of the war, the euro area economy
convincingly expanded after the easing of Covid-19 restrictions, rising by 0.7% and 0.8%
quarter on quarter in the first two quarters of 2022. In the first three months, trade balance
provided the largest contribution to growth (0.65 percentage point). This was mainly due to
a very large surplus in Ireland, where exports of multinational corporations have a strong
impact. In the second quarter, growth was much more evenly distributed across Member
States, with private consumption accounting for 0.6 percentage point.
Deferred consumption as Covid-19 restrictions eased provided an additional boost to
inflation, consumer prices being 8.9% higher in July than a year ago. 4 percentage points of
this figure were driven by energy, 2 percentage points by food and the rest – by goods and
services. Core inflation also accelerated, reaching 4%. Concerns about high energy bills
and geopolitical instability are the main reasons why the Consumer Uncertainty Sub-Index
reached its historic peak in March and continues to grow also in August. On the other hand,
economic sentiment indicators have declined significantly.4
So far, the only substantial
evidence of slower expected growth in the third quarter is provided by the Purchasing
Managers' Index (PMI) fallen below 50 in July and August, pointing to a decline in
economic activity month-on-month (keeping in mind that part of the PMI is still constituted
by the sentiment assessment).
In response to the high inflation, the ECB raised its policy rates by a total of 125 basis
points at its July and September meetings. In the latest projections published in September,
the ECB forecasts the GDP increase of 3.1% in 2022, 0.9% in 2023 and 1.9% in 2024.
Inflation is expected to reach 8.1%, 5.5% and 2.3% respectively. Compared to the June
forecast, the annual growth rate of 2022 has been revised upwards by 0.3 percentage points
(due to a faster-than-expected growth in the first half of the year), but lowered in 2023
(–1.2 percentage points) and 2024 (–0.2 percentage point) due to high inflationary pressures
weighing on consumption, disruptions in supply chains and gas supplies, and a weak
sentiment. At the same time, inflation is projected to be higher than expected in June by 1.3,
2.0 and 0.2 percentage point respectively, with energy and food exerting longer-persisting
pressures on prices, with spillovers to other sectors.
The ECB has also prepared a downside scenario, which assumes almost a full cut-off
from Russia's gas supply and inability to replace it with other supplies, an extremely cold
winter and limiting industrial capacity to save energy, as well as significantly higher energy
and food prices. This scenario expects a drop in output in 2023 (–0.9% year on year) and
expansion in 2022 and 2024 (2.8% and 1.9%).
4
Business and Consumer Survey (August 2022).
8
MACROECONOMIC DEVELOPMENTS REPORT
September 2022
Chart 3
GDP
Manufacturing output
Retail trade turnover
EURO AREA GDP, MANUFACTURING
OUTPUT AND RETAIL TRADE TURNOVER
( )
annual changes; %
–30
–20
–10
0
10
20
30
40
–30
–20
–10
0
10
20
30
40
2020 2021 2022
2019
1 2
4 3 1 2
4 3 1 2
4
Inflation in the Baltic countries, the highest in the EU, weakens economic activity to the
point of recession5
. After the first quarter of 2022, Lithuania's relatively strong economic
growth declined in the second quarter. In Estonia, the weakening of the economy has already
been evident since the beginning of the year. This was determined by the impact of the war
initiated by Russia, with the decrease in trade with Russia as well as the rise in energy prices,
leading to very high inflation, which is significantly higher in the Baltic States than in the
rest of the EU. At the end of the year, an economic recession is projected in both Estonia
and Lithuania, reducing the growth of the two Baltic States in 2022. Although in the year
as a whole growth is observed due to the successful first half of the year, it is significantly
lower than previously. Significantly more pessimistic growth is projected for 2023, with
a decelerating growth rate in the first half of the year. Inflation in the Baltic countries is
projected to decline in 2023 and a gradual normalisation of fossil fuel prices will facilitate
the recovery towards the end of the year.
The high energy prices and the deteriorating sentiment of economic agents suggest a
recession also in other major trade partner countries in the second half of 2022. In the first
quarter, the economic growth of Germany was slightly above the rate projected previously,
but already in the second quarter it fell slightly below the forecasts of the Deutsche
Bundesbank, with the economy growing only marginally quarter on quarter. As a result of
rising energy prices, Germany, which has largely depended on Russia's natural gas, recorded
a deficit in its external trade balance for the first time. Both the high energy prices and a
weaker global demand scale down production, thus leading to a decline in exports. At the
same time, imports will also weaken due to the high energy prices, along with a decreasing
domestic demand.
ECONOMIC SENTIMENT INDICATOR
long-term average = 100)
(
Euro area
Latvia
Estonia
Lithuania
Germany
Sweden
Poland 50
80
90
100
110
130
60
70
2019
III VI IX XII
2020 2021
120
III VI IX XII III VI IX
2022
XII
50
80
90
100
110
130
60
70
120
Chart 4
III VI
Sweden has sustained its economic growth in the first two quarters of 2022. In the second
quarter, it grew faster than previously expected, with a slight improvement in the annual
GDP growth forecast, while 2023 is expected to be worse. The beginning of 2022 has
marked a recovery from the pandemic in the economy, along with an increase in demand.
Given that the supply, in part, falls short of demand due to rising energy prices and
disruptions in supply chains, like elsewhere in Europe, higher than expected price increases
5
In the preparation of the analysis of economic growth in Latvia's trade partner countries, the forecasts of the central
banks were used.
1. EXTERNAL DEMAND
9
MACROECONOMIC DEVELOPMENTS REPORT
September 2022
have been observed. Sweden's economy is facing a recession in the future, with a recovery
expected in the second half of 2023.
The UK is experiencing challenges similar to the rest of Europe, with the GDP falling
slightly in the second quarter after rising at the beginning of the year. The trade volume is
declining, while the value of exports and imports increases on account of prices. As the real
income and demand dwindle, a recession is expected at the end of the year, significantly
deteriorating the GDP forecast for 2023, and economic recovery is not expected until 2024.
Russia's economy is experiencing a more moderate downturn instead of the projected
huge decline. With the continuation of the war in Ukraine initiated by Russia and the
introduction of sanctions, Russia's trade with Western countries is encumbered in many
product groups, however, the value of energy exports has increased significantly. The high
prices and the dependence of European countries on Russia's natural gas, which cannot be
easily replaced in the short term, suggest that trade in energy is still ongoing. Trade in other
product groups also has not stopped completely; for example, Latvia's exports to Russia
have even increased slightly. In the future, however, the trade volumes will decrease when
reaching the deadlines for the full entry into force of sanctions and gradually replacing
Russia's products with imports from other countries. This will reduce the income of Russia.
Economic downturn is also projected in 2023, with a slight economic recovery in 2024, but
not returning to pre-war levels for a long time ahead.
1. EXTERNAL DEMAND
10
MACROECONOMIC DEVELOPMENTS REPORT
September 2022
2. FINANCIAL CONDITIONS
2. Financial Conditions
In response to the soaring inflation, major central banks have begun rapidly removing
their previously particularly accommodative monetary policies since the end of March.
The FRS and the Bank of England continued to raise their policy rates. After the end of net
asset purchases, the ECB also increased its monetary policy rates. At the same time, despite
the skyrocketing global commodity and energy prices, the Bank of Japan does not expect
inflation in Japan to stay high for long and continues with its particularly accommodating
monetary policy.
2.1 Decisions of the ECB and other major central banks
The Governing Council of the ECB has continued with decisive normalisation of its
monetary policy since the end of March. Net asset purchases under the Asset Purchase
Programme (APP) ended at the beginning of July. The Governing Council decided on
the lift-off of the key ECB interest rates, implementing a 50 basis points raise at the July
meeting, in line with its previous signals and forward guidance, yet at a faster rate than
priced in by financial markets. This decision was made seeing that inflation rates continue
to reach new peaks. In September, the Governing Council increased the key ECB interest
rates by a further 75 basis points. Consequently, the interest rate on the deposit facility, the
main refinancing operations and the marginal lending facility have reached 0.75%, 1.25%
and 1.50% respectively. The Governing Council also notified that it would continue to raise
interest rates over the next several meetings, yet any future decisions on the scale would
follow a meeting-by-meeting approach. In addition to that, a new non-standard monetary
policy instrument, the Transmission Protection Instrument (TPI), was also announced at
the July meeting, which will ensure a smooth transmission of the monetary policy stance
across all euro area countries during the monetary policy normalisation. From the Governing
Council's point of view, singleness of its monetary policy is a precondition for the ECB to
be able to deliver on its medium-term price stability mandate. The TPI is an addition to the
Governing Council's toolkit and can be activated to counter unwarranted, disorderly market
dynamics that pose a serious threat to the transmission of monetary policy across the euro
area. The scale of TPI asset purchases depends on the severity of the risks facing monetary
policy transmission. Purchases are not restricted ex ante. In any event, the flexibility in
reinvestments of redemptions coming due in the pandemic emergency purchase programme
(PEPP) portfolio remains the first line of defence to counter risks to the transmission
mechanism related to the pandemic.
After the Governing Council's September meeting, ECB's President Christine Lagarde
indicated that, while buoyant tourism has been supporting economic growth during the
third quarter, the economy can be expected to slow down substantially over the remainder
of this year. There are four main reasons behind this. First, high inflation is dampening
spending and production throughout the economy, and these headwinds are reinforced by
gas supply disruptions. Second, the strong rebound in demand for services that came with
the reopening of the economy will lose steam in the coming months. Third, the weakening
in global demand, also in the context of tighter monetary policy in many major economies,
and the worsening terms of trade will mean less support for the euro area economy. Fourth,
uncertainty remains high, and household and business confidence is falling sharply. With
regard to risks to the growth of the euro area economy, it is noted that, in the context of the
slowing global economy, risks to growth are primarily on the downside, in particular in the
near term. At the same time, the risks to the inflation outlook are primarily on the upside. In
the same way as for growth, the major risk in the short term is a further disruption of energy
supplies.
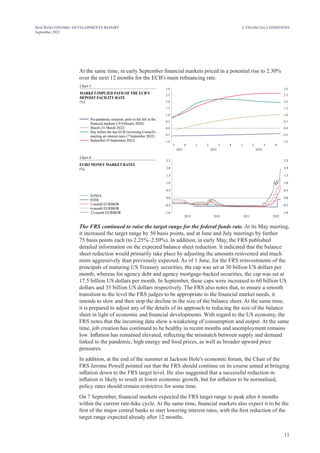
Analysts forecast that the interest rate on the ECB's deposit facility could rise to 1.50% in
early 2023 and the main refinancing rate could climb to 2.00%.
11
MACROECONOMIC DEVELOPMENTS REPORT
September 2022
2. FINANCIAL CONDITIONS
At the same time, in early September financial markets priced in a potential rise to 2.30%
over the next 12 months for the ECB's main refinancing rate.
Chart 5
Pre-pandemic situation, prior to the fall in the
financial markets (19 February 2020)
March (31 March 2022)
Day before th last ECB Governing Council's
e
meeting on interest rates (7 September 2022)
September (9 September 2022)
MARKET-IMPLIED PATH OF THE ECB'S
DEPOSIT FACILITY RATE
( )
%
–1.0
0.0
0.5
1.0
1.5
2.0
2.5
3.0
–0.5
–1.0
0.0
0.5
1.0
1.5
2.0
2.5
3.0
–0.5
2022 2023 2024
1 2
3 4 3 1 2
4 3 4
Chart 6
EURO MONEY MARKET RATES
(%)
EONIA
€STR
3-month EURIBOR
6-month EURIBOR
12-month EURIBOR –1.0
–0.5
0.0
0.5
1.0
1.5
2.0
2.5
–1.0
–0.5
0.0
0.5
1.0
1.5
2.0
2.5
2019 2021
2020 2022
The FRS continued to raise the target range for the federal funds rate. At its May meeting,
it increased the target range by 50 basis points, and at June and July meetings by further
75 basis points each (to 2.25%–2.50%). In addition, in early May, the FRS published
detailed information on the expected balance sheet reduction. It indicated that the balance
sheet reduction would primarily take place by adjusting the amounts reinvested and much
more aggressively than previously expected. As of 1 June, for the FRS reinvestments of the
principals of maturing US Treasury securities, the cap was set at 30 billion US dollars per
month, whereas for agency debt and agency mortgage-backed securities, the cap was set at
17.5 billion US dollars per month. In September, these caps were increased to 60 billion US
dollars and 35 billion US dollars respectively. The FRS also notes that, to ensure a smooth
transition to the level the FRS judges to be appropriate to the financial market needs, it
intends to slow and then stop the decline in the size of the balance sheet. At the same time,
it is prepared to adjust any of the details of its approach to reducing the size of the balance
sheet in light of economic and financial developments. With regard to the US economy, the
FRS notes that the incoming data show a weakening of consumption and output. At the same
time, job creation has continued to be healthy in recent months and unemployment remains
low. Inflation has remained elevated, reflecting the mismatch between supply and demand
linked to the pandemic, high energy and food prices, as well as broader upward price
pressures.
In addition, at the end of the summer at Jackson Hole's economic forum, the Chair of the
FRS Jerome Powell pointed out that the FRS should continue on its course aimed at bringing
inflation down to the FRS target level. He also suggested that a successful reduction in
inflation is likely to result in lower economic growth, but for inflation to be normalised,
policy rates should remain restrictive for some time.
On 7 September, financial markets expected the FRS target range to peak after 6 months
within the current rate-hike cycle. At the same time, financial markets also expect it to be the
first of the major central banks to start lowering interest rates, with the first reduction of the
target range expected already after 12 months.
12
MACROECONOMIC DEVELOPMENTS REPORT
September 2022
US (March 2022)
UK (March 2022)
Japan (March 2022)
US (September 2022)
UK (September 2022)
Japan (September 2022)
Chart 7
MARKET-IMPLIED CENTRAL BANK
POLICY RATES
(%)
–0.5
0.0
0.5
1.0
1.5
2.0
2.5
3.0
3.5
4.0
4.5
2022 2023 2024
–0.5
0.0
0.5
1.0
1.5
2.0
2.5
3.0
3.5
4.0
4.5
2025
Like the FRS, the Bank of England continued to raise its Bank Rate. At each of its
meetings in early May and mid-June, the Monetary Policy Committee (MPC) decided to
increase the Bank Rate by 25 basis points, but, as inflation continued to reach new peaks,
at the August meeting it decided to step up and to raise the Bank Rate by 50 basis points,
to 1.75%. In its August Monetary Policy Report, the Bank of England points out that
the upward inflationary pressures in the United Kingdom have intensified in the summer
months. This is mainly due to the wholesale price of natural gas, which has risen sharply
due to Russia's restrictions on supply. As the high wholesale prices feed through to retail
energy prices, it will exacerbate the fall in the households' real incomes and further increase
inflation in the near term. Inflation could remain elevated throughout 2023, before returning
to the Bank of England's 2% target in a two years' time. The economic activity is slowing.
The latest rise in natural gas prices has led to significant deterioration in the outlook for
activity, and the UK is projected to enter into a recession in the fourth quarter of 2022.
Financial markets have priced in that the Bank of England's Bank Rate could reach 4.5%
over the next 12 months, representing the highest level in this policy rate hiking cycle.
The Bank of Japan is maintaining the short-term policy interest rate at –0.1% and the
target level of 10-year government bond yields at around 0.0%, thereby continuing its yield
curve control policy. According to the Bank of Japan, the economy is likely to continue
recovering, with the impact of Covid-19 and supply-side constraints waning. At the same
time, the negative effects of the downward pressure stemming from a rise in commodity
prices is also noted. Financial markets expect that the Bank of Japan's target rate could be
increased to 0.1% over the next 12 months, yet the management of the Bank of Japan points
out that no revision of the rates is foreseen for the time being and it is committed to keeping
the rates at the current level.
Chart 8
CENTRAL BANK ASSETS
(relative to GDP; %)
0
20
40
60
80
100
120
140
160
0
20
40
60
80
100
120
140
160
United Kingdom
US
Euro area
Japan
2006 2008 2010 2012 2014 2016 2018 2020 2022
2. FINANCIAL CONDITIONS
13
MACROECONOMIC DEVELOPMENTS REPORT
September 2022
2. FINANCIAL CONDITIONS
2.2 Global financial market developments
The increase in the interest rates of the major central banks was reflected in a substantial
rise in government bond yields. As inflation rates continue to grow and are increasingly
moving away from the targets of the major central banks, thereby increasing the risk of
inflation expectations becoming unanchored, the rhetoric and actions of the major central
banks aimed at containing inflation and avoiding second-round inflation effects have also
become more resolute. As a result, the yields on government bonds of developed countries
also rose significantly, with only a few episodes of decline, when the market participants'
sentiment was clouded by concerns that the sharp increase in interest rates could lead
to a slowdown in economic growth. This contributed to higher volatility in government
bond markets, also affecting the deterioration of the liquidity. The yield on German ten-
year government bonds increased by 109 basis points, to 1.63%, during the review period
(31 March–6 September), temporarily rising even above 1.77% in mid-June and reaching
the historical levels of the end of 2013. The yields on ten-year government bonds in France,
Spain, Greece and Italy rose by 125 basis points, 138 basis points, 157 basis points and
194 basis points respectively. A higher increase in debt security yields in Spain, Italy as well
as Greece compared to that in Germany could be explained by a more prudent investors'
assessment of the sovereign debt sustainability in a context of rising interest rates. The
political turmoil in Italy also contributed to an increase in the yields on its government
securities. At the same time, the flexible approach to reinvesting the maturing principals
of the PEPP portfolio to the benefit of the southern countries as well as the announcement
of TPI prevented uncontrolled increases in the yields of the government securities in these
countries. The yields on US Treasury debt securities rose more slowly this time, given that
in the past they increased faster than those on German debt securities. The future evolution
of the government bond yields will largely depend on the overall inflation and economic
developments and on the central banks' monetary policy stance in response to these changes.
Chart 9
7-YEAR GOVERNMENT BOND SPREADS
RELATIVE TO GERMAN GOVERNMENT
BOND YIELDS
( s)
basis point
France
Spain
Italy
Latvia 0
50
100
150
200
250
300
0
50
100
150
200
250
300
2019 2021
2020 2022
2 3 4
1 2 3 4
1 2 3 4
1 2
1
The yields on corporate debt securities also increased as well as their spreads relative to
the risk-free rates. The yields in the euro area and US corporate debt securities markets
generally moved in line with the sovereign bond yields. They increased significantly both
for investment-grade corporate debt securities and high-yield debt securities, thus further
increasing the financing costs of businesses, which in turn contributed to an increase in
spreads relative to the risk-free rates, especially for high-yield debt securities. The soaring
commodity prices, especially those on natural gas, also contributed to the widening of
spreads in Europe. However, the borrower's default rate remains very low. With central
banks winding down their government bond purchases and the yields on government
bonds rising, investors' appetite for higher-risk and higher-yield corporate debt declined,
which was also reflected in the rise in the yields on corporate debt securities. Moreover, the
increase in yields was more pronounced in the high-yield debt securities market and it was
observed across all high-yield credit rating categories. Despite the rising corporate yields,
investment-grade companies continued to issue new debt securities, while the riskier high-
yield companies were very reluctant to raise new market-based financing. In the coming
14
MACROECONOMIC DEVELOPMENTS REPORT
September 2022
months, the yields on corporate debt securities will remain dependent on the pace of the
central banks' monetary policy normalisation, overall economic growth and commodity price
developments as well as the sectoral outlook, and most likely will also remain sensitive to
the incoming inflation data.
Stock markets fell, with the sharpest price declines experienced by the technologies and
the health care sectors which had gained most during the Covid-19 pandemic. Following
a small episode of calm in mid-summer, stock markets continued to fall. Particularly,
the hawkish stance of the FRS in containing the inflation, with the policy rate lift-off on
16 March and further rapid normalisation of its monetary policy, had a negative impact on
stock market sentiment. Market concerns about the rapid rise in interest rates potentially
leading to an economic downturn were coupled by expectations of a gradual containment
of inflation. In addition, the high energy prices, especially in Europe, exerted an additional
downward pressure on stock prices. However, the fall was slowed down by the still solid
earnings of the second quarter. Stock valuations in both the euro area and the United States
continued to decline. The US technology industry repeatedly suffered the biggest losses.
The NASDAQ-100 index characterising the US tech stock market fell by 19.1% between
31 March and 6 September. The persistently high oil prices, the uncertainty caused by the
war in Ukraine and the new outbreaks of Covid-19 in China also had a negative impact on
the overall sentiment and contributed to investors turning away from stocks. Stock markets
remained highly volatile, with the mood swinging in a broad range within a day and the
sell-off episodes replaced by price increases during the next trading sessions. The implied
volatility indices, both the European VSTOXX and the US VIX, developed in opposite
directions. While the European VSTOXX index declined by 1.6 percentage points compared
to its spike at the end of February, the US VIX index rose by 6.4 percentage points. The
EuroStoxx index characterising the euro area stock market has declined by 10.9%, whereas
S&P 500 index characterising the US stock market contracted even more sharply, by 13.7%.
During the period under review, only the stock prices of energy sector companies rose
in the euro area (by 5.0%). The technology sector (by 16.4%), the health care sector (by
14.3%) and the insurance sector (by 13.4%) experienced the biggest decline in their stock
prices. Looking at the euro area stock market at a country level, it appears that the decrease
in the Italian FTSE MIB index, the German DAX index and the French CAC 40 index (by
14.2%, 10.7% and 8.3% respectively) were larger than that of the Spanish IBEX 35 index
(by 7.1%). Further developments in the stock markets will continue to largely depend on the
pace of economic development and on the ability of policy makers to balance decisions and
measures, so that to contain the rising inflation without leading to a significant economic
downturn and subsequent revaluation of financial assets. The supply of natural gas during
the heating season in Europe and the possible need for coercive energy saving measures, as
well as the level of the natural gas price, will also have a significant impact on the further
development of stock prices.
A more aggressive US monetary policy and the natural gas price shock in Europe are
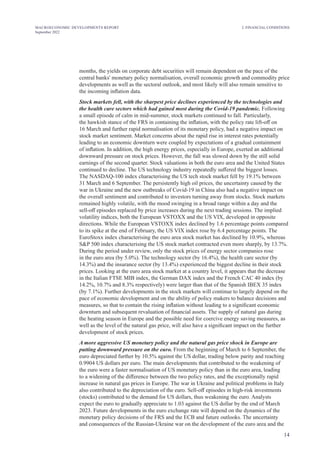
putting downward pressure on the euro. From the beginning of March to 6 September, the
euro depreciated further by 10.5% against the US dollar, trading below parity and reaching
0.9904 US dollars per euro. The main developments that contributed to the weakening of
the euro were a faster normalisation of US monetary policy than in the euro area, leading
to a widening of the difference between the two policy rates, and the exceptionally rapid
increase in natural gas prices in Europe. The war in Ukraine and political problems in Italy
also contributed to the depreciation of the euro. Sell-off episodes in high-risk investments
(stocks) contributed to the demand for US dollars, thus weakening the euro. Analysts
expect the euro to gradually appreciate to 1.03 against the US dollar by the end of March
2023. Future developments in the euro exchange rate will depend on the dynamics of the
monetary policy decisions of the FRS and the ECB and future outlooks. The uncertainty
and consequences of the Russian-Ukraine war on the development of the euro area and the
2. FINANCIAL CONDITIONS
15
MACROECONOMIC DEVELOPMENTS REPORT
September 2022
global economy, in particular the future of gas supply in Europe, will undoubtedly also have
an impact on the future prospects of the euro exchange rate.
Chart 10
EURO EXCHANGE RATE AGAINST US
DOLLAR AND FUTURE MARKET
EXPECTATIONS
EUR/USD
EUR/USD (future expectations;
September 2022) 0.95
1.00
1.05
1.10
1.15
1.20
1.25
2019
III VI IX XII
2020 2021
III VI IX XII III VI IX
2023
XII III VI IX XII III
2022
0.95
1.00
1.05
1.10
1.15
1.20
1.25
2.3 Financing conditions in the Latvian economy
The decline in the sentiment caused by the hostilities, soaring inflation and the lift-off
of the euro base rates will have a negative impact on Latvia's financing conditions and
long-term borrowing; the prevailing high uncertainty has already discouraged businesses
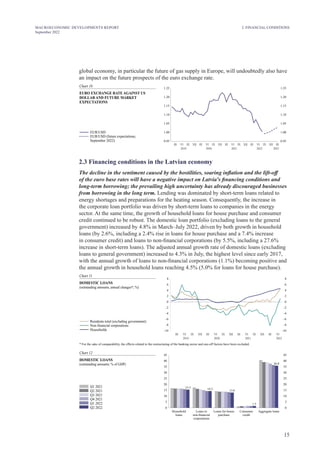
from borrowing in the long term. Lending was dominated by short-term loans related to
energy shortages and preparations for the heating season. Consequently, the increase in
the corporate loan portfolio was driven by short-term loans to companies in the energy
sector. At the same time, the growth of household loans for house purchase and consumer
credit continued to be robust. The domestic loan portfolio (excluding loans to the general
government) increased by 4.8% in March–July 2022, driven by both growth in household
loans (by 2.6%, including a 2.4% rise in loans for house purchase and a 7.4% increase
in consumer credit) and loans to non-financial corporations (by 5.5%, including a 27.6%
increase in short-term loans). The adjusted annual growth rate of domestic loans (excluding
loans to general government) increased to 4.3% in July, the highest level since early 2017,
with the annual growth of loans to non-financial corporations (1.1%) becoming positive and
the annual growth in household loans reaching 4.5% (5.0% for loans for house purchase).
Chart 11
DOMESTIC LOANS
( )
outstanding amounts; annual changes*; %
–10
–8
–6
–4
–2
0
2
4
8
Residents total (excluding government)
Non-financial corporations
Households
* For the sake of comparability, the effects related to the restructuring of the banking sector and one-off factors have been excluded.
6
–10
–8
–6
–4
–2
0
2
4
8
6
2019
III VI IX XII
2020 2021
III VI IX XII III VI IX XII III VI
2022
Chart 12
Q1 2021
Q2 2021
Q3 2021
Q4 2021
Q1 2022
Q2 2022
15.5 14.3 13.0
1.5
36.0
0
5
10
15
20
25
30
35
40
45
0
5
10
15
20
25
30
35
40
45
Household
loans
Loans to
non-financial
corporations
Loans for house
purchase
Consumer
credit
Aggregate loans
DOMESTIC LOANS
( )
outstanding amounts; % of GDP
2. FINANCIAL CONDITIONS
16
MACROECONOMIC DEVELOPMENTS REPORT
September 2022
Nominal GDP growth continued to weigh on the already low ratio of domestic loans to GDP,
pushing it down to 36.0% in the second quarter (37.8% in 2021).
Chart 13
NEW DOMESTIC LOANS
( )
flows; millions of euro
Households
Non-financial corporations 0
50
100
150
200
250
300
350
400
0
50
100
150
200
250
300
350
400
2019
III VI IX XII
2020 2021
III VI IX XII III VI IX
2022
XII III VI
The interest rate on corporate loans remained broadly unchanged from February to
July: after falling at the beginning of the period under review, with the ECB gradually
normalising its monetary policy, it returned to the previous level. The interest rate on new
corporate loans in euro remained broadly unchanged (2.9% in both February and July), as
it was affected by countervailing factors. On the one hand, the rising corporate demand of
short-term loans for inventories and working capital had a downward effect on the interest
rate on loans to enterprises. Credit institutions granted more short-term corporate loans
with an interest rate lower than the long-term lending rate, including to a number of large
companies with low credit risk. For example, in May 2022, AS Latvenergo concluded two
short-term loan agreements for the financing of current assets and liquidity management for
a total amount of 200 million euro. On the other hand, the increasing euro money market
indices had an upward effect on the corporate lending rates. The uncertainty related to the
Russian war in Ukraine contributed to a slight increase in the credit risk premium for
long-term corporate loans during the reporting period.
In 2022 and 2023, corporate loans are at a high risk of rising interest rates. As the majority
of corporate loans have been issued at a variable rate, the September decision of the ECB's
Governing Council on a 75 basis points increase of the key ECB interest rates and the
financial market expectations of further rate increases will quickly be reflected in the interest
rates on new corporate loans and, after the next regular revision of lending rates, also in
the rates on existing loans. At the same time, the negative impact of the soaring energy
prices caused by the Russian military aggression may strengthen if the development or sales
prospects of the Latvian economy, individual sectors or enterprises weakens and the risk
tolerance of credit institutions decreases.
The interest rate on household loans for house purchase tended to rise as money market
indices increased and the composition of lending flows changed. The interest rate on new
household loans for house purchase in euro gradually increased from 2.3% in February to
2.7% in July. Since the start of spring, in the housing loan segment, mainly the interest rates
on unsecured loans, usually provided for housing repairs and improvements, increased, and
the overall lending composition was also influenced by the rising demand for measures to
improve the energy efficiency of housing. Loans of this type often carry a higher interest rate
than traditional mortgage-backed housing loans. At the end of the period under review, as
money market indices of different maturities gradually turned positive, their upward effect
on interest rates on housing loans strengthened. Interest rates on housing loans will continue
to rise in the near future, mainly due to further ECB's monetary policy normalisation. In a
context of soaring inflation, as households' real purchasing power declines and their credit
risk grows, the priced in credit risk and credit risk premiums may increase.
The interest rates on consumer credit and other lending to households declined as a
result of stronger competition between credit institutions and changes in the composition
2. FINANCIAL CONDITIONS
17
MACROECONOMIC DEVELOPMENTS REPORT
September 2022
2. FINANCIAL CONDITIONS
of lending flows. The weighted average interest rate on consumer credit and other lending
to households declined gradually over most of the period under review (down from
11.1% in February to 10.9% in June), with an exceptional fall to 8.9% in July. Stronger
competition among credit institutions, as well as households giving preference to credit
institutions offering more favourable interest rates contributed to the rate reduction in this
lending segment. During the period under review, the conclusion of study and student loan
agreements had a downward impact on interest rates in the particular lending segment.
Despite a fall in the past six months, the interest rate on consumer credit and other lending
to households could rise in the coming year if inflation continues to undermine households'
purchasing power and increases credit risk.
Chart 14
INTEREST RATES ON NEW CREDIT
INSTITUTION LOANS IN EURO AND
3-MONTH EURIBOR
(%)
Loans to enterprises
Loans to households for house purchase
3-month EURIBOR
Consumer credit and other lending to
households (right-hand scale) –4
0
4
8
12
16
–1
0
1
2
3
4
2020 2021 2022
III VI IX XII III VI IX XII III VI IX XII III VI
2019
High inflation significantly increased household spending, mostly depleting the savings
accumulated during the pandemic. Not only has the upward trend in household deposits
observed for two years slowed down, but it has reversed even in nominal terms in recent
months. With annual inflation above 20% in July, consumer spending also reduced the total
stock of domestic deposits. The annual growth rate of deposits is only 7%, and the real
decline in savings is accelerating: for example, in July, the real decline in deposits has been
at least 2% in monthly terms and more than 10% year on year. The fall in real incomes of
the population, as wage growth lags behind inflation, is no longer allowing a large part of
households to build up precautionary savings, although several factors (e.g. expected record-
high utility payments in the winter period and the impact of the expected recession) could
encourage them to do so.
As a result, the annual growth rate has slowed more for household deposits but has been
volatile with no visible downward trend for corporate deposits. In July, the annual growth
rate of domestic household deposits stood at 7.2%, whereas that of corporate deposits was
6.9% (including a 10.9% rise for deposits by non-financial corporations). In nominal terms,
the growth of deposits in the five months from March to July stood at 2.8% (5.7% and 1.3%
rise in deposits by non-financial corporations and household deposits respectively, including
a 5.5% fall in fixed term deposits). This indicates that at least part of the population had to
tap into the savings made for a rainy day. The expected recession in autumn and winter will
reduce the overall income level, so the stock of deposits will decrease.
Chart 15
Total deposits of domestic enterprises and
households
Deposits of non-financial corporations
Household deposits
Annual inflation
DOMESTIC DEPOSITS AND INFLATION
( )
outstanding amounts; annual changes; %
–5
0
5
10
15
20
25
–5
0
5
10
15
20
25
2020 2021 2022
VI IX XII III VI IX XII III VI IX XII III VI
2019
III
18
MACROECONOMIC DEVELOPMENTS REPORT
September 2022
Higher money market indices have been poorly reflected in interest rates on deposits. The
overall weighted average interest rate on euro deposits remained close to zero, although the
rate on corporate demand deposits turned positive. At the same time, the interest rate on new
fixed-term deposits of households and enterprises in euro even decreased, as the flow of new
business in credit institutions offering relatively higher interest rates declined (from 0.2% in
February to 0.1% in July). In the future, however, the growth of deposits and interest rates
on new fixed term deposits will be supported by a faster increase in money market indices.
Households also spend their cash savings accumulated during the Covid-19 pandemic
for consumption needs in a context of rising inflation. As a result, the net issuance of
cash decreased from 101 million euro to 12 million euro between the end of March and the
beginning of September. The population was able to spend public support received during
the peak of the pandemic.
Chart 16
NET ISSUANCE OF EURO BANKNOTES BY
LATVIJAS BANKA
( )
millions of euro
2022
XII
2021
III VI IX
–500
–400
–300
–200
–100
0
100
200
–500
–400
–300
–200
–100
0
100
200
XII III VI IX
III VI IX
2020
Government financing conditions also deteriorated due to the rising interest rates. On the
secondary market, Latvia's government bond yields increased, following the overall trend
of the euro area sovereigns. The average yield on 9-year bonds increased from 1.34% at the
end of March to 2.69% on 6 September. The spread vis-á-vis the German government bonds
of an equivalent maturity widened from 86 basis points to 115 basis points. This can be
explained by a higher vulnerability of the Baltic economies and the border with Russia.
At the same time, the Latvian government continued to place its securities that were
previously released on international markets on the domestic market (same ISIN for
securities launched on both the domestic and international markets). 11 auctions were held in
April–August, where due to higher interest rates the supply in recent months was lower than
in spring. The total supply was 540 million euro, whereas the bids amounted to 1179 million
euro, resulting in full allotment of the supply. 2 to 6-year bonds were offered at the auctions.
Chart 17
AUCTIONS OF GOVERNMENT SECURITIES
(millions of euro)
–0.5
0.0
0.5
1.0
1.5
2.0
2.5
0
100
200
300
400
500
600
700
800
Supply (millions of euro)
Bids (millions of euro)
Allotment (millions of euro)
2–4-year bond yield (%; right-hand scale)
5–7-year bond yield (%; right-hand scale)
8–10-year bond yield (%; right-hand scale)
2021 2022
I II III IV V VI VII VIII IX X XI XII I II III IV V VI VII VIII
Since March, all three leading international credit rating agencies affirmed the previous
Latvian credit ratings and maintained a stable outlook. Agencies (Moody's, S&P Global
Ratings, Fitch Ratings) stressed that Latvia is reducing its energy dependence on Russia, the
country has a moderate level of sovereign debt, as well as stability is ensured by its NATO
and EU membership. Consequently, the impact of the Russian-induced war in Ukraine on
the Latvian economy as well as the fiscal situation will be relatively limited.
2. FINANCIAL CONDITIONS
19
MACROECONOMIC DEVELOPMENTS REPORT
September 2022
Despite the expectations of rising interest rates, private sector debt issuers have been able
to raise financing. AS Latvenergo issued 5-year green bonds in the amount of 100 million
euro at a fixed annual interest rate of 2.42%, rolling over the previous issue. BluOr Bank AS
issued 7-year unsecured subordinated bonds at a fixed annual interest rate of 7% and an issue
amount of 4.9 million euro. The self-service coffee service provider in the Baltic States,
SIA Coffee Address Holding, in cooperation with Signet Bank AS, carried out the issue of
unsecured bonds in the amount of 5 million euro. Signet Bank AS, in cooperation with its
subsidiary car leasing company AS Primero Finance, carried out the first securitisation issue
in Latvia. The Bank helped its subsidiary to issue asset-backed securities in the amount of
9.5 million euro. AS Conexus Baltic Grid announced its intention to issue and list unsecured
bonds of up to 80 million euro on the stock exchange this year. The investment management
company IPAS Indexo raised the planned 7.5 million euro in the initial public offering of
stock. These stocks were listed on Main List of the stock exchange AS Nasdaq Riga. Online
building materials and lifestyle goods trader prof.lv, SIA and car wash network AS Puto plan
to list their stocks on the stock exchange and concluded agreements with the Central Finance
and Contracting Agency on attracting EU co-financing for this purpose.
The decrease in stock prices and indices was determined by the war in Ukraine, which
negatively affected the cooperation of Latvian companies with partners in Ukraine, Russia
and Belarus, as well as by changes in the business environment. On the Latvian stock
market, the stock price index OMXR decreased by 2.9% on 6 September 2022 compared
to the end of March 2022 and the Baltic stock price index OMXBBGI decreased by 7.7%.
These developments were similar to those on the major global stock markets when the risks
of the global recession increased. An increase in stock prices of AS DelfinGroup by 7.1%
and a rise in the stock prices of AS Virši-A by 2.3% are worth a special mention. At the same
time, the stock prices decreased for AS MADARA Cosmetics (by 25.2%), AS Latvijas Gāze
(by 13.0%) and IPAS Indexo (by 3.8%). AS DelfinGroup announced that it is forecasting
stable development in the next three years, and its revenue increased by 46% in the second
quarter compared to the corresponding period of the previous year. AS Virši-A acquired 20%
of the stock of AS Skulte LNG Terminal. AS MADARA Cosmetics reduced its future growth
goals, whereas AS Latvijas Gāze will most likely have to undergo reorganisation.
2. FINANCIAL CONDITIONS
20
MACROECONOMIC DEVELOPMENTS REPORT
September 2022
3. Sectoral Development6
The rise in energy prices and the impact of sanctions imposed on Russia have already
started to erode economic growth. The lifting of restrictions related to the Covid-19
pandemic in the second quarter helped the sectors like accommodation and food service
activities, art, culture and entertainment services as well as air transport services to
recover substantially from a low level. While higher demand for many services already
contributed to price hikes, consumers' purchasing power was partly supported by their
savings accumulated during the pandemic. The actual ties of economic cooperation with
the aggressor countries were not severed immediately, thus enabling build-up of inventories
and delaying or slowing down the decline in activity in a number of sectors (e.g. industry,
construction, transport). However, activities of certain companies (including wholesale
companies) were already restricted by the sanctions imposed on their owners because
of the war in Ukraine. At the same time, the current and expected cost increases caused
many economic operators to act with more caution, which materialised gradually until July
in household real spending (affecting development of retail trade), industry and energy.
According to EC survey data, several services sectors have witnessed the optimism related to
the expectations of lifting pandemic restrictions wane and pessimism strengthen in relation
to the development outlook over the next three months, albeit not reaching the lows seen
during the pandemic.
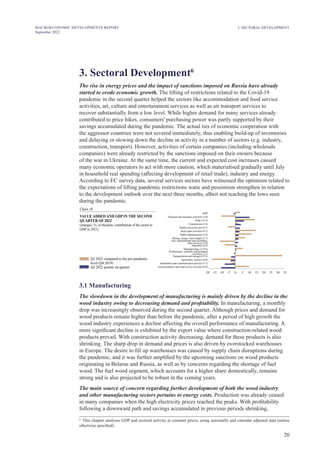
Chart 18
VALUE ADDED AND GDP IN THE SECOND
QUARTER OF 2022
(changes; %; in brackets: contribution of the sector to
GDP in 2021)
Q2 2022 compared to the pre-pandemic
level (Q4 2019)
Q2 2022 quarter on quarter
–20 –15 –10 –5 10
0 5 25
15 35
20 30
GDP
Financial and insurance activities (3.0)
Trade (13.4)
Construction (5.4)
Health and social care (4.7)
Real estate activities (9.7)
Public administration (7.0)
Mining, energy, water supply (2.7)
Education (4.4)
Manufacturing (11.8%)
Transportation and storage (6.3%)
Agriculture, forestry (4.0)
Information and communication services (5.1)
Accommodation and food service activities (0.9)
Arts, entertainment and recreation,
other services (2.0)
Professional, scientific and technical
activities (7.1)
3.1 Manufacturing
The slowdown in the development of manufacturing is mainly driven by the decline in the
wood industry owing to decreasing demand and profitability. In manufacturing, a monthly
drop was increasingly observed during the second quarter. Although prices and demand for
wood products remain higher than before the pandemic, after a period of high growth the
wood industry experiences a decline affecting the overall performance of manufacturing. A
more significant decline is exhibited by the export value where construction-related wood
products prevail. With construction activity decreasing, demand for these products is also
shrinking. The sharp drop in demand and prices is also driven by overstocked warehouses
in Europe. The desire to fill up warehouses was caused by supply chain disruptions during
the pandemic, and it was further amplified by the upcoming sanctions on wood products
originating in Belarus and Russia, as well as by concerns regarding the shortage of fuel
wood. The fuel wood segment, which accounts for a higher share domestically, remains
strong and is also projected to be robust in the coming years.
The main source of concern regarding further development of both the wood industry
and other manufacturing sectors pertains to energy costs. Production was already ceased
in many companies when the high electricity prices reached the peaks. With profitability
following a downward path and savings accumulated in previous periods shrinking,
6
This chapter analyses GDP and sectoral activity at constant prices, using seasonally and calendar adjusted data (unless
otherwise specified).
3. SECTORAL DEVELOPMENT
21
MACROECONOMIC DEVELOPMENTS REPORT
September 2022
the situation will deteriorate further. State support helps, but it will not succeed in fully
addressing the problems.
The increase in energy costs affects every producer, but there are also other areas of concern
in each sector. Engineering industries experience easing in metal prices and, out of concern
for its availability, they find alternatives to metal supplies (concerning future transactions,
currently warehouse stocks are increasingly used) or replacement of this material following
the collapse of Russian imports. Building materials are still in demand, but the decline in
construction activity in the region raises concerns about future demand. Demand for food
production is more resilient, but costs (also those of grain, including feed grain) are growing
and the issue of competitiveness is becoming more acute. Productivity of fragmented
and relatively small firms is lower than that of rivals, and vulnerability is higher. Overall,
manufacturing is expected to contract further in the second half of the year.
Chart 19
MANUFACTURING
(2019 = 100)
average
Production output
Total turnover*
Turnover in domestic market*
Non-domestic turnover* 85
95
* At current prices.
115
125
135
145
155
85
95
105
115
125
135
145
155
2022
XII
2021
III
XII III VI IX
III VI IX
2020
VI
3.2 Construction
The price hikes of commodities and construction materials have significantly increased
the costs of ongoing construction projects. This led to a fall in real volume in the construction
sector and financial losses to builders. The performance of the construction sector was
weaker than expected in the first half of 2022. Value added in the construction sector
continued to decline in the second quarter of 2022 and decreased by 3.3% quarter on quarter.
Risks related to climbing prices and costs continued to weigh on the construction sector. The
increase in construction costs, challenges as regards access to construction input materials
and supply chains have been affected by both the Covid-19 pandemic and the Russian war in
Ukraine. In the second quarter, the overall level of construction costs increased by 22% year
on year. This is mainly due to a sharp increase in prices of building materials (metal, cement,
glass, thermal insulation materials, expanded polystyrene, polymers). The mounting prices
of building materials have been beneficial to their producers whose production volumes
and turnover have increased notably, but the turnover of other sectors of the construction
industry has been adversely affected by rising construction costs. Therefore, construction
activity and volumes continued to decline also in the second quarter, significantly hampering
the sector's growth, including the implementation of public sector projects. The upward trend
in construction costs has had a negative impact not only on investors' interest in making new
investments but also on the execution of the existing contracts and the implementation of the
ongoing construction projects, leading to a significant risk that construction merchants might
unilaterally terminate works contracts and withdraw from them. As a result, buildings will
not be completed and/or they will be frozen. The government has approved rules on standard
contracts in relation to public construction projects and guidelines for assessing the rising
costs of building materials, but unfortunately these indexation mechanisms have not been
fully used by the sector. The building permits issued in the second quarter reveal that the size
of the areas intended for construction continued to contract, and this also offers no hope of
rebound in construction activity in the coming quarters.
3. SECTORAL DEVELOPMENT
22
MACROECONOMIC DEVELOPMENTS REPORT
September 2022
3. SECTORAL DEVELOPMENT
The Rail Baltica multi-annual project, demand and the need to renew the housing stock,
as well as the available financial resources in the form of various EU funds for the
implementation of public sector projects (the Recovery and Resilience Facility funding and
the European structural funds within the multi-annual budget) provide opportunities for the
construction sector to boost its growth, while the drop in real construction volumes for the
fourth consecutive quarter raises concerns that the construction sector may lack sufficient
capacity for the delivery of the available investments and acceleration of growth.
Chart 20
CONSTRUCTION SECTOR'S INDICATORS
( )
2019 average = 100; sentiment – net responses
Production output
Number of the employed
Construction costs
Manufacture of non-metallic mineral products
Sentiment (right-hand scale) 2
3
4
5
6
7
8
80
85
90
95
100
105
110
115
120
125
130
2019 2021
2020 2022
2 3 4
1 2 3 4
1 2 3 4
1 2
1 3
3.3 Real estate sector
Inflation and the soaring energy costs have contributed to changes in the real estate
market: the share of transactions involving energy efficient housing is constantly growing.
In the second quarter of 2022, the value added of the real estate market sector, following a
minor increase registered at the beginning of the year, decreased by 0.8% quarter on quarter.
Although the real estate market experiences price stabilisation (the average price of standard
apartments was 973 euro/m² in July), transaction dynamics have been put on a declining path
compared with the last year. This was driven by price hikes and the decrease in household
savings. In the first eight months of this year, the number of transactions registered with the
Land Register recorded a decline of 4.7% in Latvia but an increase of 3.2% in Riga.
The secondary market witnessed changes in summer compared to the situation at the
beginning of the year. In 2021 (during the Covid-19 pandemic), business class housing was
more preferred, and transactions with land and private houses in Pieriga picked up driven
by the need to perform remote work from home. Meanwhile, with energy prices surging in
2022, the supply of standard apartments took an upward trend in Riga in summer months
as the population, in anticipation of the new heating season, started to look more actively
for possibilities to change the existing housing to a new one – smaller and more energy
efficient. Demand for housing remains above supply. In the segment of new projects, the
supply and choice also continue to decrease, as an uptrend in construction costs leads to the
postponement of residential projects, reducing very substantially the number of new project
proposals.
Chart 21
AVERAGE PRICE OF STANDARD
APARTMENTS IN RIGAAND THE
NUMBER OF CONTRACTS REGISTERED
WITH THE LAND REGISTER
Purchase contract in Latvia
s
Purchase contracts in Riga
Average price (euro/m ; SIAARCO REAL
2
ESTATE; right-hand scale)
973
0
200
400
600
800
1000
1200
0
1000
2000
3000
4000
5000
6000
2020 2021 2022
VI IX XII III VI IX XII III VI IX XII III VI
2019
III
It is expected that the real estate market will continue to face a number of problems in
the second half of 2022: the increase in borrowing interest rates and prices of energy
23
MACROECONOMIC DEVELOPMENTS REPORT
September 2022
3. SECTORAL DEVELOPMENT
resources (higher expenditure on heating and electricity) and inflation, which will reduce the
population's savings and, consequently, the possibility to purchase new housing.
3.4 Trade
The decline in trade was driven both by the impact of sanctions on wholesale and
by more cautious household spending on retail goods. The development of the trade
sector deteriorated significantly in the second quarter of 2022. This was partly due to the
normalisation of retail trade volumes observed already in April following the post-pandemic
shopping boom in March, when consumers made pent-up purchases. However, the effects of
the rising price levels also gradually translated into the fall in real spending, and these effects
continue to take their toll in the third quarter, as evidenced by both retail trade data until
July and card payment data for most of the weeks of the third quarter. The fall in specialised
wholesale and belonging of the wholesale companies owned by sanctioned owners to this
subsector suggest that these could be the factors contributing to the decline in the trading
sector observed in the second quarter. As a result of these factors, the total value added of the
trade sector was 7.3% lower than in the previous quarter. On the other hand, car sales saw a
pickup in the second quarter, and this increase could have been driven by pent-up spending
during the pandemic. At the same time, the number of newly registered cars is no longer
increasing.
Despite the availability of government support to compensate the exceptional increase in
energy prices, the decline in real purchasing power and the soaring housing maintenance
costs will likely continue to limit household spending on retail goods. Recovery of wholesale
dented by the sanctions is not expected either. Thus, the trade sector is still expected to
experience a decline in the coming quarters.
Chart 22
TRADE TURNOVER IN SUBSECTORS
( )
2019 average = 100
Wholesale
Trade and repair of motor vehicles
Retail trade 50
60
70
80
90
100
110
120
130
50
60
70
80
90
100
110
120
130
2020 2021 2022
VI IX XII III VI IX XII III VI IX XII III VI
2019
III
3.5 Transport
The transport sector has managed to avoid the worst case scenario for the time being,
but the sector's future development will no longer be so positive. In the first half of 2022,
the transport sector saw a steady increase in freight traffic by rail and in volumes of cargoes
loaded and unloaded at Latvia's ports, as well as a significant uptrend in air passenger flows
at Riga Airport. Although the worst case scenario for freight transport has not materialised
following the Russian invasion of Ukraine, freight transport activity is expected to decline in
the second half of the year. Geopolitical tensions continue to raise concerns about the future
dynamics of the transport sector.
The slowdown in the road transport sector was driven by both the restrictions introduced
on the Russian market and the new mobility package conditions for freight transport
in Europe. In the first half of the year when road freight transport decreased significantly,
affecting primarily international transport flows, the total freight circulation fell by 7.3%
year on year. Road transport flows to Russia are expected to continue on a downward trend
in the second half of the year, but the role of the region in Latvia's road transport structure
has been gradually declining since 2014 (currently less than 10% of total freight turnover).
24
MACROECONOMIC DEVELOPMENTS REPORT
September 2022
3. SECTORAL DEVELOPMENT
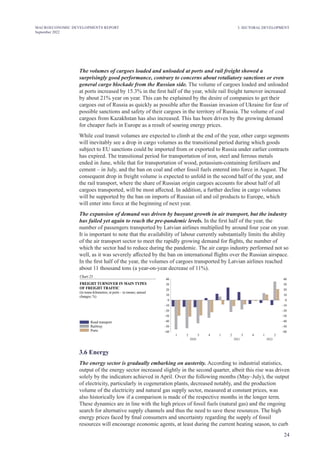
The volumes of cargoes loaded and unloaded at ports and rail freight showed a
surprisingly good performance, contrary to concerns about retaliatory sanctions or even
general cargo blockade from the Russian side. The volume of cargoes loaded and unloaded
at ports increased by 15.3% in the first half of the year, while rail freight turnover increased
by about 21% year on year. This can be explained by the desire of companies to get their
cargoes out of Russia as quickly as possible after the Russian invasion of Ukraine for fear of
possible sanctions and safety of their cargoes in the territory of Russia. The volume of coal
cargoes from Kazakhstan has also increased. This has been driven by the growing demand
for cheaper fuels in Europe as a result of soaring energy prices.
While coal transit volumes are expected to climb at the end of the year, other cargo segments
will inevitably see a drop in cargo volumes as the transitional period during which goods
subject to EU sanctions could be imported from or exported to Russia under earlier contracts
has expired. The transitional period for transportation of iron, steel and ferrous metals
ended in June, while that for transportation of wood, potassium-containing fertilisers and
cement – in July, and the ban on coal and other fossil fuels entered into force in August. The
consequent drop in freight volume is expected to unfold in the second half of the year, and
the rail transport, where the share of Russian origin cargoes accounts for about half of all
cargoes transported, will be most affected. In addition, a further decline in cargo volumes
will be supported by the ban on imports of Russian oil and oil products to Europe, which
will enter into force at the beginning of next year.
The expansion of demand was driven by buoyant growth in air transport, but the industry
has failed yet again to reach the pre-pandemic levels. In the first half of the year, the
number of passengers transported by Latvian airlines multiplied by around four year on year.
It is important to note that the availability of labour currently substantially limits the ability
of the air transport sector to meet the rapidly growing demand for flights, the number of
which the sector had to reduce during the pandemic. The air cargo industry performed not so
well, as it was severely affected by the ban on international flights over the Russian airspace.
In the first half of the year, the volumes of cargoes transported by Latvian airlines reached
about 11 thousand tons (a year-on-year decrease of 11%).
Chart 23
FREIGHT TURNOVER IN MAIN TYPES
OF FREIGHT TRAFFIC
( ne
in tonne-kilometres; at ports – in ton s; annual
changes; %)
Road transport
Railway
Ports –60
–50
–40
–30
–20
–10
0
10
20
30
40
–60
–50
–40
–30
–20
–10
0
10
20
30
40
2021
2020 2022
2 3 4
1 2 3 4
1 2
1
3.6 Energy
The energy sector is gradually embarking on austerity. According to industrial statistics,
output of the energy sector increased slightly in the second quarter, albeit this rise was driven
solely by the indicators achieved in April. Over the following months (May–July), the output
of electricity, particularly in cogeneration plants, decreased notably, and the production
volume of the electricity and natural gas supply sector, measured at constant prices, was
also historically low if a comparison is made of the respective months in the longer term.
These dynamics are in line with the high prices of fossil fuels (natural gas) and the ongoing
search for alternative supply channels and thus the need to save these resources. The high
energy prices faced by final consumers and uncertainty regarding the supply of fossil
resources will encourage economic agents, at least during the current heating season, to curb
25
MACROECONOMIC DEVELOPMENTS REPORT
September 2022
3. SECTORAL DEVELOPMENT
energy consumption both in dwellings and companies, thus reducing energy demand and
significantly limiting the sector's growth.
Chart 24
ENERGY SECTOR INDICATORS
( )
May–July
Total gross electricity generation (TWh)
Including at cogeneration plants (TWh)
Electricity and gas supply (production volume;
May–July 2015 = 100; right-hand scale) 85
90
95
100
105
110
115
120
125
0
200
400
600
800
1000
1200
1400
1600
2006 2008 2010 2012 2014 2016 2018 2020 2022
26
MACROECONOMIC DEVELOPMENTS REPORT
September 2022
4. GDP ANALYSIS FROM THE DEMAND SIDE
4. GDPAnalysis from the Demand Side7
4.1 Domestic demand
Although the most challenging period – the heating season with high costs at the end of
the year and the beginning of next year – is still ahead, spending is already being affected
by precaution and high inflation. In the second quarter, GDP contracted by 1.0% quarter
on quarter, maintaining a positive annual growth at 2.9%. The fall in the quarterly pace was
determined by a decrease in private consumption and an increase in imports. The contraction
in private consumption was affected by the decline in purchasing power and precaution. On
the other hand, the increase in imports was driven by the uncertainty caused by the war, the
expected restrictions imposed by sanctions, as well as price hikes. This has contributed to
filling warehouses with raw materials and finished products: imports of all types of goods,
particularly intermediate goods, have increased. Imports of capital goods for investment
purposes have also followed an upward path.
Chart 25
GDPAND DEMAND SIDE COMPONENTS
(quarterly changes; %; demand side – percentage points)
Imports of goods and services
Exports of goods and services
Changes in inventories
Gross fixed capital formation
Public consumption
Private consumption
GDP quarterly changes –25
–20
–15
–10
–5
0
5
10
15
20
–25
–20
–15
–10
–5
0
5
10
15
20
2020
2019 2022
2 3 4
1 2 3 4
1 2
2 3 4
1
2021
1
As a result of the heightened uncertainty prevailing since the beginning of the war and
the rapid price rises, the population faces a decision-making dilemma: whether to spend
the savings reduced by inflation or save more by way of precaution? Data for the second
quarter reveal that private consumption has started to decline, as income and savings made
during the previous periods do not fully offset spending of the population. While household
deposits were still growing in nominal terms year on year and data from various surveys
suggest that, in general, the population is cautious when it comes to spending, and this
caution may also persist in the third quarter as the heating season is approaching, deposits
have started to fall not only in real but also in nominal terms during recent months. However,
behaviour of the population is not homogeneous: the mentioned frugality and the increasing
desire to spend the savings due to their falling value as well as to implement travel plans
after lifting the restrictions imposed during the pandemic (as evidenced by a sharp increase
in consumer credit, mainly for travel purposes).
Chart 26
INDICATORS DESCRIBING PRIVATE
CONSUMPTION
(Q 2019 = 100; %; sentiment – net response changes
4 ,
Q4 2019 = 0)
Real wage fund
Retail trade
Private consumption
Consumers sentiment (right-hand scale) –30
–25
–20
–15
–10
–5
0
5
10
15
70
75
80
85
90
95
100
105
110
115
2020 2021 2022
2 3 4
1 2
1
2 3 4
1
7
This chapter analyses GDPand demand components at constant prices, using seasonally and calendar adjusted data (unless
otherwise specified).
27
MACROECONOMIC DEVELOPMENTS REPORT
September 2022
4. GDP ANALYSIS FROM THE DEMAND SIDE
Chart 27
CONSUMER CONFIDENCE AND
UNDERLYING FACTORS
( )
net responses; percentage points
Larger purchases planned in next 12 months
the
Country's economic outlook for the next
12 months
Financial position of the household in the next
12 months
Financial position of the household in
the previous 12 months
Consumer confidence
–35
–30
–25
–20
–15
–10
–5
0
5
–40
–35
–30
–25
–20
–15
–10
–5
0
5
–40
2020 2021 2022
VI IX XII III VI IX XII III VI IX XII III VI
2019
III
Investment was maintained by imports of capital goods – machinery and transport
equipment. Investment in construction is hampered by both uncertainty and an increase
in costs, in particular by rising prices of building materials, which have led to a review
of already prepared or even launched investment plans. The rise in credit interest rates
gradually pushes up costs, while the implementation of new investment projects is hampered
by war-induced insecurity, weakening the attractiveness of the regions closest to the
aggressor states.
With the risks of the global recession increasing, private investment may fall, and public
infrastructure projects will take over the key role of heating the economy. On the other hand,
additions to vehicle (trains, planes) equipment and machinery dominate in the investment
projects requiring imports of capital goods. Currently, alternative power supply equipment
and energy efficient equipment to reduce energy costs, i.e. solar panels, heating boilers, heat
pumps, allocators, thermostatic radiator heads, etc. are particularly sought after.
Chart 28
INVESTMENT
(2019 = 100)
average
0
20
40
60
80
100
120
140
0
20
40
60
80
100
120
140
Gross fixed capital formation
Construction of buildings
Construction of engineering structures
Imports of capital goods*
* According to Latvijas Banka's estimates of capital goods for June.
2020 2021 2022
2 3 4
1 2
1
2 3 4
1
4.2 Government consumption
Government support provided during the energy crisis by the end of the year will result in
a larger budget deficit. Meanwhile, in the seven months of 2022, the general government
deficit reached 98.2 million euro, significantly less in year-on-year terms. This was driven by
higher budgetary revenues, mainly – by higher-than-expected tax revenue growth. However,
in the second half of the year, the budget balance is expected to deteriorate due to both the
weakening economic activity and the government spending to offset the increase in energy
prices and mitigate the impact of inflation. The general government budget deficit for this
year is estimated at 7.9% of GDP, increasing by 2.2 percentage points compared to the June
projections. The budget deficit projections for 2023 and 2024 have been increased to 3.5%
and 2.6% of GDP respectively, taking into account both the sluggish economic growth and
additional measures promoted by the government on the expenditure side of the budget.
The rapid increase in energy prices will reduce the real purchasing power of the
population, which, as the heating season resumes, will have a negative impact on
economic activity, and the growth rate of tax revenues will decline by the end of the year.
28
MACROECONOMIC DEVELOPMENTS REPORT
September 2022
In the seven months of 2022, general government revenue increased by 11.5% year on year
to around 8 billion euro. The increase was mainly driven by high tax revenues supported
by the recovery of economic activity and the growth of private consumption (both owing to
lifting the restrictions imposed during the Covid-19 pandemic), as well as the rising prices
of goods and services, coupled with increases in employment and wages in the economy.
In seven months, the consumer tax revenue grew by 17.1%, while the revenue from labour
taxes – by 30.0% year on year. As a result of the decline in economic activity, overall tax
revenue growth by the end of the year will moderate.
Meanwhile, budget expenditure this year is driven by state support measures to mitigate
the increase in energy prices, provide assistance to Ukraine and its people and strengthen
defence and internal security. Overall, during the seven months of this year general
government expenditure increased only by 0.7% year on year. Expenditure on social
benefits declines, as support measures and investment linked to the Covid-19 pandemic have
diminished. On the other hand, it has been intended to allocate more than 1 billion euro for
energy crisis support measures between 2021 and 2023, with the largest share earmarked
for the 2022–2023 heating season. The support package includes a number of consumption-
enhancing measures: an earlier pension indexation, social support and compensation for part
of the increase in heat supply and heating costs for households. The government support
designed to partially compensate for the effects of the increase in energy prices is also
intended for companies. Due to these measures and other steps, budget expenditure will
increase faster in the second half of the year, exceeding 15% increase year on year at the end
of the year. The rise in budget expenditure is expected to continue also in the coming years,
including a significant increase to strengthen internal security and defence. With deadlines
of the absorption of EU funds approaching, faster flows are expected, which will continue to
boost overall government consumption and public investment.
Despite the deterioration of the budget balance, the lower debt level is driven by GDP
growth in nominal terms and by the liquidity accumulated so far. In 2022, the government
debt level will reach 45.0% of GDP, falling by 1.5 percentage points compared to the
June projections (46.5%). In 2023 and 2024, the government debt level will continue to
decline gradually, while in the coming years, a more moderate economic growth will keep
government debt at 44.4% and 42.9% of GDP respectively.
4.3 Trade balance
The increase in the value of exports and imports in the first half of the year was already
dominated by the price effect, and the approaching recession and contraction in demand
will reduce both exports and imports. Contrary to the initial forecasts that foreign trade
would weaken due to the sanctions, exports and imports of goods and services increased
in the second quarter. Concerns about the shortage of certain raw materials and price rise
intensified trade. Stocks in warehouses, which were already full due to the disruptions
of supply chains caused by the pandemic, were replenished. As the pandemic-related
restrictions were eased, the services sector also became more active.
However, most of the increase was due to the price effect, while in real terms, exports of
goods and services grew by 0.7% compared to the first quarter, with the volume of both
goods and services increasing at a similar pace. Imports saw a faster increase in the volume
of goods (goods and services in real terms constituted 1.7%) securing energy for the future
and importing goods from Russia prior to the entry into force of the sanctions.
In the second quarter, exports of goods continued to grow due to rising prices, with articles
of wood, machinery and electrical equipment predominating. Export value of agricultural
products and products of the chemical industry remained high. Due to the dominance of the
price effect, the value of exports of mineral products doubled in the first half of 2022 year on
4. GDP ANALYSIS FROM THE DEMAND SIDE
29
MACROECONOMIC DEVELOPMENTS REPORT
September 2022
year, with re-exports accounting for the bulk of it. However, as early as in June, the value of
exports fell as wood prices decreased due to a shrinking external demand and deteriorating
overall future outlook, thus signalling a turning point in exports.
In the second quarter, imports of goods were dominated by mineral products whose value
appreciation was driven by both high prices and efforts to secure natural gas reserves for
the future. The increase in imports was also driven by machinery, electrical appliances and
vehicles (mostly planes), as well as wood whose imports slightly picked up in April and May
before the sanctions against Russia and Belarus came into force.
In the second quarter, exports and imports of services rose well above the pre-pandemic
levels. Most of these exports and imports are made up of various business services and
information and communication services. Travel exports also recovered in May and June.
Overall, during the first half of the year, the increase in exports of goods and services has not
been able to offset the import growth, thus creating a significant deficit in the trade balance
of the first half of the year.
Concerns about the future development of foreign trade are mainly related to the
impending recession, the continuation of Russia's war in Ukraine and the energy price
crisis. In the second half of the year, amid a weakening demand, both exports and imports
of goods and services will decline in Latvia as well as in its trade partner countries. The
export value of goods will be reduced by the decrease in wood prices, while the increase in
natural gas prices, which has a more significant impact on the import side, is likely to persist
for a longer period. However, the gas reserves already in place and the decline in domestic
demand will significantly reduce the need for imports, to be reflected in a lower deficit in
the trade balance in the second half of the year. In the second quarter, the terms of trade in
goods that play a major role both in exports and imports, i.e. wood and mineral products
respectively remained favourable. However, already in June when wood prices started to
fall but energy prices continued on an upward path, there was a shift towards deteriorating
trading conditions. As regards trade in services, the export side will also be weakened by the
lack of development opportunities for rail freight.
Export ties with Russia have not weakened since the outbreak of the war as previously
expected. At the same time, imports from Russia have decreased significantly. A further
decline in imports is expected in view of the entry into force of the sanctions and the end of
contract execution. For example, imports of mineral products and base metals from Russia
have already decreased which is reflected in lower re-export volumes. In general, imports
from Russia have been partly replaced by products from other countries, e.g. other countries
play a stronger role in imports of natural gas.
The rapidly increasing energy and labour costs in Latvia may weaken competitiveness,
particularly in non-EU countries. In the first half of 2022, an increase in the cost
competitiveness indicator – the real effective exchange rate (REER), which includes
37 national currencies and is deflated by the unit labour costs (ULC) and the export price
index, has slowed down, while the REER, deflated by the HICP and the GDP deflator,
continues to increase. Latvia's share of exports in world imports is stable, and this share also
shows a slight long-term growth trend and some seasonal fluctuations in imports of most of
Latvia's major partner countries. Competitiveness analysis is also important from the point
of view of government support provided during the energy crisis.
The profitability level of the traditionally exporting sectors, i.e. manufacturing and
agriculture, remains close to the pre-pandemic level (on average in 2017–2019). It should be
noted that profitability in the manufacturing industry remained stable during the pandemic as
the export structure was dominated by goods still in demand on export markets. The lifting
of pandemic restrictions contributed to a rapid rebound in economic activity in a number of
4. GDP ANALYSIS FROM THE DEMAND SIDE
30
MACROECONOMIC DEVELOPMENTS REPORT
September 2022
4. GDP ANALYSIS FROM THE DEMAND SIDE
services sectors engaged in services exports (e.g. accommodation, catering, air transport);
the production volume in catering services even exceeded the pre-pandemic levels.
Meanwhile, the profitability level of these services continued to lag behind significantly,
suggesting a sharp increase in costs.
Chart 29
EXPORT MARKET SHARE AND REAL
EFFECTIVE EXCHANGE RATE
(2015 = 100)
average
95
100
105
110
115
120
125
130
95
100
105
110
115
120
125
130
REER_unit labour costs.
REER_HICP
REER_GDP deflator
REER_export prices
Global market share of exports of goods
(four-quarter moving average)
1 2
2015 2020 2021
3 4
2022
2017 2018 2019
3 1 2
4 3 1 2
4 3 1 2
4 3 1 2
4 3 1 2
4
1 2 3 4
1 2
2016
31
MACROECONOMIC DEVELOPMENTS REPORT
September 2022
5. LABOUR MARKET, COSTS AND PRICES
5. Labour Market, Costs and Prices
With unemployment declining after the Covid-19 pandemic, the labour market remains
tight. In the second quarter of 2022, the unemployment rate in Latvia decreased to 6.6%,
as did the unemployment rate registered with the State Employment Agency in August
(to 5.8%). Although household concerns about the increasing rate of unemployment are
lower than during the pandemic, they still remain relatively high8
. Following a leap at the
beginning of the year after the end of the pandemic, employment expectations of businesses
have stabilised. Labour shortage in manufacturing as a factor weighing on business activities
has declined somewhat since the beginning of the year, while remaining at its elevated
pre-pandemic level – it is still high in construction and even increased in the services sector.
Chart 30
SHARE OF BUSINESSES REFERRING TO
LABOUR SHORTAGES AS A MAJOR FACTOR
WEIGHING ON BUSINESS ACTIVITIES
( ; %)
seasonally and calendar adjusted data
0
10
20
30
40
0
10
20
30
40
Manufacturing
Construction
Services
1 2
2015 2020 2021
3 4
2022
2017 2018 2019
3 1 2
4 3 1 2
4 3 1 2
4 3 1 2
4 3 1 2
4
1 2 3 4
1 2
2016
3
Refugees from Ukraine continue to participate in Latvia's labour market, but they do not
have a significant impact on the overall rate of unemployment or employment. According
to the data from the State Employment Agency, approximately six thousand refugees from
Ukraine (less than 1% of the number of employed persons) had found a job over the period
from the outbreak of the war until the end of July. From the beginning of June to the end
of July, the State Employment Agency received weekly about 300 applications for job
vacancies from Ukrainian refugees, which is a relatively small fraction considering that
the total number of unemployed persons exceeds 52 thousand. Moreover, labour demand
is significantly higher – according to the data from the State Employment Agency, the total
number of the current vacancies was 30 thousand in July 2022, with nine thousand new
vacancies being registered in the same month.
The rate of unemployment is expected to increase somewhat during the recession. In the
first half of the year, a lower than previously anticipated rate of unemployment reduces
the unemployment forecast for 2022 to 6.7% (–0.6 percentage point compared to the June
forecast). The projected weakening of activities of several sectors will also find reflection in
a minor increase in the rate of unemployment around the turn of the year. In the short run,
the sharp rise in unemployment will be hampered by the high number of vacancies and,
consequently, businesses might initially decide not to search for employees, without laying
off the current employees. Therefore, unemployment would remain at the level of 2022
(6.7%; –0.4 percentage point) in 2023. The forecast scenario assumes a rebound in economic
activity in the second half of the next year, which would be positively reflected in a slight
decline in the unemployment rate (to 6.3%) in 2024 as also previously projected.
The sectors with lower average wages are recovering from the pandemic crisis, which is
a factor weighing on the average wage growth. In the first half of this year, the services
sectors were recovering from the pandemic crisis, with the number of persons employed
in these sectors increasing rapidly. This also affected the average wage in the country.
A striking example is the accommodation and food service activities sector, where in the first
half of 2022 the number of employed persons rose by 80% year on year. As wages in this
8
Unemployment expectations of households, employment expectations of businesses and the assessment of labour
shortages based on the EC business and consumer survey. Available at Time series (europa.eu).
32
MACROECONOMIC DEVELOPMENTS REPORT
September 2022
5. LABOUR MARKET, COSTS AND PRICES
BOX 1. WHICH SECTORS WILL BE MOST AFFECTED BY THE INCREASE
IN THE MINIMUM WAGE?9
In April 2022, the Ministry of Welfare proposed to raise the minimum wage to 640 euro per
month as of 1 January 2023.10
This would imply that the minimum wage is likely to reach a
level close to 60% of the median wage, slightly exceeding the OECD average.
The raising of the minimum wage is one of the tools for a country to reduce poverty and
income inequality among the employed. However, such a step may also have certain side
effects. A higher minimum wage can reduce employment, especially among younger and
low-paid employees. Namely, if employee productivity is below the minimum wage level,
the employer has no economic justification for retaining the job (position).
Latvijas Banka's calculations using the CGE and EUROMOD models show that, in the
long term, the raising of the minimum wage contributes to lower inequality in income (as
measured by the Gini index) and a minor increase in private consumption. Meanwhile, as
9
Prepared by Oļegs Tkačevs, economist of Latvijas Banka.
10
"Ministrija piedāvā no 2023. gada vismaz līdz 640 eiro celt minimālo algu cenu kāpuma dēļ", lsm.lv, 21.04.2022.
sector are lower than the average in the country, this had a dampening effect on the average
wage growth. In the second quarter of 2022, the average wage increase reached 8.3%
year on year. The rise in prices was faster; therefore, the purchasing power of employed
persons decreased already for the second consecutive quarter. The wage bill also declined in
real terms in the second quarter.
Chart 31
AVERAGE MONTHLY GROSS WAGE AND
WAGE BILL
( ; %)
annual changes
Real wages
Wages
Wage bill
Real wage bill –12
–8
–4
0
4
8
12
16
–12
–8
–4
0
4
8
12
16
2020 2021 2022
2019
1 2 3 1 2
4 3 1 2
4 3 1 2
4
Chart 32
FIVE SECTORS WITH THE HIGHEST AND
LOWEST GROSS WAGE GROWTH RATES
IN THE SECOND QUARTER OF 2022
( ; %)
annual changes
Health and social care
Other service activities
Financial and insurance activities
Electricity, gas, steam and air conditioning supply
Professional, scientific and technical activities
Transportation and storage
Arts, entertainment and recreation
Agriculture, forestry and fishing
0 2 4 6 8 10 12 14 16
Public administration and defence, compulsory
social security
Water supply, sewerage, waste management and
remediation activities
Inflation and labour market tightness will further increase the wage growth. Moreover,
discussions on the increase in the minimum wage (16% of employed persons currently
receive the minimum wage or less) are underway. At the beginning of the year, lower
than expected wage growth contributes to a downward revision of the wage growth
forecast for 2022 (up to 8.5% (–1.8 percentage points)). The major constraint to the wage
increase is the steep rise in energy prices, which forces businesses to spend more on other
production resources instead of the labour force. The increase projected for 2023 is 7.2%
(+0.5 percentage point). In 2024, with the economy recovering, labour shortages will again
be a factor contributing to wage growth (forecast for 2024 is 7.5%).
33
MACROECONOMIC DEVELOPMENTS REPORT
September 2022
labour costs, especially the costs for low-skilled workers, pick up, labour is replaced by
capital or a company does not cope with the competition and goes bankrupt. Moreover, the
rise in labour costs worsens the competitiveness of businesses in external markets, leading
to a decline in exports. The overall long-term impact on employment and GDP is estimated
to be negative (for more details, see the study to be published soon). However, the impact
on Latvia's economy overall masks significant differences in the breakdown of economic
sectors.
Chart 1.1 shows that the highest share of employees earning a wage below the set
minimum might be recorded by the accommodation and food service activities (30.1%)11
,
500 640 500 640 1000 1500 2000 5000 500 640 1000 1500 2000 5000
1000 1500 2000 5000
500 640 1000 1500 2000 5000 500 640 1000 15002000 5000
500 640 1000 1500 2000 5000
4. (5.8%)
Construction
7. Accommodation and food service
(30.1%)
activities
10. (21.6%)
Real estate activities
500 640 1000 1500 2000 5000 500 640 1000 15002000 5000 500 640 1000 1500 2000 5000
500 640 1000 1500 2000 5000 500 640 1000 1500 2000 5000 500 640 1000 1500 2000 5000
Chart 1.1
GROSS MONTHLY WAGE IN 2021
(frequency; the share of employees who earn
a monthly wage of less than 640 euro is given in
)
brackets
1. (25.7%)
Agriculture 2. (15.0%)
Manufacturing 3. (11.5%)
Electricity, gas and water supply
5. (22.9%)
Wholesale and retail trade 6. (17.3%)
Transportation
8. Information and communication
(5.2%)
services
9. (3.2%);
Financial services
11. (11.0%)
Professional services 12. Administrative and other service
(16.8%)
activities
The wage level is 640 euro
Gross monthly wage (frequency)
11
The share of employed persons per sector has been calculated using the wage statistics for 2021, i.e. excluding the
wage increase in 2022. Assuming that the wage growth by sector will be even in 2022, the calculated share will be
lower in 2023, with the indicated differences across sectors persisting.
5. LABOUR MARKET, COSTS AND PRICES
Macroeconomic Developments Report. September 2022

More Related Content

Similar to Macroeconomic Developments Report. September 2022

Macroeconomic Developments Report. March 2021
Macroeconomic Developments Report. March 2021Macroeconomic Developments Report. March 2021
Macroeconomic Developments Report. March 2021Latvijas Banka
 
WORLD ECONOMIC OUTLOOK UPDATE JULY 2022
WORLD ECONOMIC OUTLOOK UPDATE JULY 2022WORLD ECONOMIC OUTLOOK UPDATE JULY 2022
WORLD ECONOMIC OUTLOOK UPDATE JULY 2022dynamo777
 
MNI Connect Video Conference
MNI Connect Video ConferenceMNI Connect Video Conference
MNI Connect Video ConferenceLatvijas Banka
 
Impact of Russia`s invasion of Ukraine on Latvia`s economic growth and fiscal...
Impact of Russia`s invasion of Ukraine on Latvia`s economic growth and fiscal...Impact of Russia`s invasion of Ukraine on Latvia`s economic growth and fiscal...
Impact of Russia`s invasion of Ukraine on Latvia`s economic growth and fiscal...Latvijas Banka
 
Romain Duval. IMF Regional Economic Outlook for Europe
Romain Duval. IMF Regional Economic Outlook for EuropeRomain Duval. IMF Regional Economic Outlook for Europe
Romain Duval. IMF Regional Economic Outlook for EuropeEesti Pank
 
WORLD ECONOMIC OUTLOOK INTERNATIONAL MONETARY FUND UPDATE
WORLD ECONOMIC OUTLOOK INTERNATIONAL MONETARY FUND UPDATEWORLD ECONOMIC OUTLOOK INTERNATIONAL MONETARY FUND UPDATE
WORLD ECONOMIC OUTLOOK INTERNATIONAL MONETARY FUND UPDATEdynamo777
 
Ukraine Monthly Economic Review, December 2016
Ukraine Monthly Economic Review, December 2016Ukraine Monthly Economic Review, December 2016
Ukraine Monthly Economic Review, December 2016DIXI Group
 
Prévisions de la Commission européenne été 2020
Prévisions de la Commission européenne été 2020Prévisions de la Commission européenne été 2020
Prévisions de la Commission européenne été 2020Mathilde Obert
 
Prévisions de la Commission européenne été 2020
Prévisions de la Commission européenne été 2020Prévisions de la Commission européenne été 2020
Prévisions de la Commission européenne été 2020Paperjam_redaction
 
Ukraine Monthly Economic Review, June 2017
Ukraine Monthly Economic Review, June 2017  Ukraine Monthly Economic Review, June 2017
Ukraine Monthly Economic Review, June 2017 DIXI Group
 
Impact of Russia`s invasion of Ukraine on Latvia`s economic growth
Impact of Russia`s invasion of Ukraine on Latvia`s economic growthImpact of Russia`s invasion of Ukraine on Latvia`s economic growth
Impact of Russia`s invasion of Ukraine on Latvia`s economic growthLatvijas Banka
 
EY Price Point Q3 2022
EY Price Point Q3 2022EY Price Point Q3 2022
EY Price Point Q3 2022EY
 
Macroeconomic Developments Report, December 2017
Macroeconomic Developments Report, December 2017Macroeconomic Developments Report, December 2017
Macroeconomic Developments Report, December 2017Latvijas Banka
 
Latvia's Macro Profile. September 2022
Latvia's Macro Profile. September 2022Latvia's Macro Profile. September 2022
Latvia's Macro Profile. September 2022Latvijas Banka
 
Ukraine Monthly Economic Review, August 2017
Ukraine Monthly Economic Review, August 2017Ukraine Monthly Economic Review, August 2017
Ukraine Monthly Economic Review, August 2017DIXI Group
 
Macroeconomic Developments Report. December 2018
Macroeconomic Developments Report. December 2018Macroeconomic Developments Report. December 2018
Macroeconomic Developments Report. December 2018Latvijas Banka
 
2023 At the crossroads Círculo de Empresarios February 2023
2023 At the crossroads Círculo de Empresarios February 20232023 At the crossroads Círculo de Empresarios February 2023
2023 At the crossroads Círculo de Empresarios February 2023Círculo de Empresarios
 
Macroeconomic Developments Report. December 2019
Macroeconomic Developments Report. December 2019Macroeconomic Developments Report. December 2019
Macroeconomic Developments Report. December 2019Latvijas Banka
 

Similar to Macroeconomic Developments Report. September 2022 (20)

Macroeconomic Developments Report. March 2021
Macroeconomic Developments Report. March 2021Macroeconomic Developments Report. March 2021
Macroeconomic Developments Report. March 2021
 
WORLD ECONOMIC OUTLOOK UPDATE JULY 2022
WORLD ECONOMIC OUTLOOK UPDATE JULY 2022WORLD ECONOMIC OUTLOOK UPDATE JULY 2022
WORLD ECONOMIC OUTLOOK UPDATE JULY 2022
 
MNI Connect Video Conference
MNI Connect Video ConferenceMNI Connect Video Conference
MNI Connect Video Conference
 
Monetary policy sets the pace
Monetary policy sets the paceMonetary policy sets the pace
Monetary policy sets the pace
 
Economy in check due to global risks
Economy in check due to global risksEconomy in check due to global risks
Economy in check due to global risks
 
Impact of Russia`s invasion of Ukraine on Latvia`s economic growth and fiscal...
Impact of Russia`s invasion of Ukraine on Latvia`s economic growth and fiscal...Impact of Russia`s invasion of Ukraine on Latvia`s economic growth and fiscal...
Impact of Russia`s invasion of Ukraine on Latvia`s economic growth and fiscal...
 
Romain Duval. IMF Regional Economic Outlook for Europe
Romain Duval. IMF Regional Economic Outlook for EuropeRomain Duval. IMF Regional Economic Outlook for Europe
Romain Duval. IMF Regional Economic Outlook for Europe
 
WORLD ECONOMIC OUTLOOK INTERNATIONAL MONETARY FUND UPDATE
WORLD ECONOMIC OUTLOOK INTERNATIONAL MONETARY FUND UPDATEWORLD ECONOMIC OUTLOOK INTERNATIONAL MONETARY FUND UPDATE
WORLD ECONOMIC OUTLOOK INTERNATIONAL MONETARY FUND UPDATE
 
Ukraine Monthly Economic Review, December 2016
Ukraine Monthly Economic Review, December 2016Ukraine Monthly Economic Review, December 2016
Ukraine Monthly Economic Review, December 2016
 
Prévisions de la Commission européenne été 2020
Prévisions de la Commission européenne été 2020Prévisions de la Commission européenne été 2020
Prévisions de la Commission européenne été 2020
 
Prévisions de la Commission européenne été 2020
Prévisions de la Commission européenne été 2020Prévisions de la Commission européenne été 2020
Prévisions de la Commission européenne été 2020
 
Ukraine Monthly Economic Review, June 2017
Ukraine Monthly Economic Review, June 2017  Ukraine Monthly Economic Review, June 2017
Ukraine Monthly Economic Review, June 2017
 
Impact of Russia`s invasion of Ukraine on Latvia`s economic growth
Impact of Russia`s invasion of Ukraine on Latvia`s economic growthImpact of Russia`s invasion of Ukraine on Latvia`s economic growth
Impact of Russia`s invasion of Ukraine on Latvia`s economic growth
 
EY Price Point Q3 2022
EY Price Point Q3 2022EY Price Point Q3 2022
EY Price Point Q3 2022
 
Macroeconomic Developments Report, December 2017
Macroeconomic Developments Report, December 2017Macroeconomic Developments Report, December 2017
Macroeconomic Developments Report, December 2017
 
Latvia's Macro Profile. September 2022
Latvia's Macro Profile. September 2022Latvia's Macro Profile. September 2022
Latvia's Macro Profile. September 2022
 
Ukraine Monthly Economic Review, August 2017
Ukraine Monthly Economic Review, August 2017Ukraine Monthly Economic Review, August 2017
Ukraine Monthly Economic Review, August 2017
 
Macroeconomic Developments Report. December 2018
Macroeconomic Developments Report. December 2018Macroeconomic Developments Report. December 2018
Macroeconomic Developments Report. December 2018
 
2023 At the crossroads Círculo de Empresarios February 2023
2023 At the crossroads Círculo de Empresarios February 20232023 At the crossroads Círculo de Empresarios February 2023
2023 At the crossroads Círculo de Empresarios February 2023
 
Macroeconomic Developments Report. December 2019
Macroeconomic Developments Report. December 2019Macroeconomic Developments Report. December 2019
Macroeconomic Developments Report. December 2019
 

More from Latvijas Banka

Ekspertu sarunas prezentācija 2024. gada 13. marts
Ekspertu sarunas prezentācija 2024. gada 13. martsEkspertu sarunas prezentācija 2024. gada 13. marts
Ekspertu sarunas prezentācija 2024. gada 13. martsLatvijas Banka
 
Latvijas cilvēkkapitāls ekonomikas mainīgajos apstākļos
Latvijas cilvēkkapitāls ekonomikas mainīgajos apstākļosLatvijas cilvēkkapitāls ekonomikas mainīgajos apstākļos
Latvijas cilvēkkapitāls ekonomikas mainīgajos apstākļosLatvijas Banka
 
Human capital as the key to economic development
Human capital as the key to economic developmentHuman capital as the key to economic development
Human capital as the key to economic developmentLatvijas Banka
 
Ekspertu saruna Latvijas Bankā 19.10.2023.
Ekspertu saruna Latvijas Bankā 19.10.2023.Ekspertu saruna Latvijas Bankā 19.10.2023.
Ekspertu saruna Latvijas Bankā 19.10.2023.Latvijas Banka
 
Makroekonomisko Norišu Pārskats. 2023. gada septembris
Makroekonomisko Norišu Pārskats. 2023. gada septembrisMakroekonomisko Norišu Pārskats. 2023. gada septembris
Makroekonomisko Norišu Pārskats. 2023. gada septembrisLatvijas Banka
 
Latvijas tautsaimniecības makroekonomiskā attīstība | Septembris 2023
Latvijas tautsaimniecības makroekonomiskā attīstība | Septembris 2023Latvijas tautsaimniecības makroekonomiskā attīstība | Septembris 2023
Latvijas tautsaimniecības makroekonomiskā attīstība | Septembris 2023Latvijas Banka
 
Digitālo finanšu drošība
Digitālo finanšu drošībaDigitālo finanšu drošība
Digitālo finanšu drošībaLatvijas Banka
 
Darba tirgus apskats un aktualitātes 2023
Darba tirgus apskats un aktualitātes 2023Darba tirgus apskats un aktualitātes 2023
Darba tirgus apskats un aktualitātes 2023Latvijas Banka
 
Nodokļu politika un tās iespējas 2023
Nodokļu politika un tās iespējas 2023Nodokļu politika un tās iespējas 2023
Nodokļu politika un tās iespējas 2023Latvijas Banka
 
Procentu likmju celšana inflācijas mazināšanai
Procentu likmju celšana inflācijas mazināšanaiProcentu likmju celšana inflācijas mazināšanai
Procentu likmju celšana inflācijas mazināšanaiLatvijas Banka
 
Inflācijas ietekme uz personīgajām finansēm
Inflācijas ietekme uz personīgajām finansēmInflācijas ietekme uz personīgajām finansēm
Inflācijas ietekme uz personīgajām finansēmLatvijas Banka
 
Ekonomikas aktualitātes 2023
Ekonomikas aktualitātes 2023Ekonomikas aktualitātes 2023
Ekonomikas aktualitātes 2023Latvijas Banka
 
Makroekonomisko Norišu Pārskats. 2023. gada marts
Makroekonomisko Norišu Pārskats. 2023. gada martsMakroekonomisko Norišu Pārskats. 2023. gada marts
Makroekonomisko Norišu Pārskats. 2023. gada martsLatvijas Banka
 
Ekspertu saruna par finanšu pratību
Ekspertu saruna par finanšu pratībuEkspertu saruna par finanšu pratību
Ekspertu saruna par finanšu pratībuLatvijas Banka
 
Tautsaimniecības aktualitātes
Tautsaimniecības aktualitātesTautsaimniecības aktualitātes
Tautsaimniecības aktualitātesLatvijas Banka
 
Latvia`s Macro Profile 2023
Latvia`s Macro Profile 2023Latvia`s Macro Profile 2023
Latvia`s Macro Profile 2023Latvijas Banka
 
Kurā pusē sētai zāle zaļāka
Kurā pusē sētai zāle zaļākaKurā pusē sētai zāle zaļāka
Kurā pusē sētai zāle zaļākaLatvijas Banka
 
Latvijas tautsaimniecības makroekonomiskā attīstība | Marts 2023
Latvijas tautsaimniecības makroekonomiskā attīstība | Marts 2023Latvijas tautsaimniecības makroekonomiskā attīstība | Marts 2023
Latvijas tautsaimniecības makroekonomiskā attīstība | Marts 2023Latvijas Banka
 

More from Latvijas Banka (20)

Ekspertu sarunas prezentācija 2024. gada 13. marts
Ekspertu sarunas prezentācija 2024. gada 13. martsEkspertu sarunas prezentācija 2024. gada 13. marts
Ekspertu sarunas prezentācija 2024. gada 13. marts
 
MNI Connect
MNI Connect MNI Connect
MNI Connect
 
Latvijas cilvēkkapitāls ekonomikas mainīgajos apstākļos
Latvijas cilvēkkapitāls ekonomikas mainīgajos apstākļosLatvijas cilvēkkapitāls ekonomikas mainīgajos apstākļos
Latvijas cilvēkkapitāls ekonomikas mainīgajos apstākļos
 
Human capital as the key to economic development
Human capital as the key to economic developmentHuman capital as the key to economic development
Human capital as the key to economic development
 
Ekspertu saruna Latvijas Bankā 19.10.2023.
Ekspertu saruna Latvijas Bankā 19.10.2023.Ekspertu saruna Latvijas Bankā 19.10.2023.
Ekspertu saruna Latvijas Bankā 19.10.2023.
 
Makroekonomisko Norišu Pārskats. 2023. gada septembris
Makroekonomisko Norišu Pārskats. 2023. gada septembrisMakroekonomisko Norišu Pārskats. 2023. gada septembris
Makroekonomisko Norišu Pārskats. 2023. gada septembris
 
Latvijas tautsaimniecības makroekonomiskā attīstība | Septembris 2023
Latvijas tautsaimniecības makroekonomiskā attīstība | Septembris 2023Latvijas tautsaimniecības makroekonomiskā attīstība | Septembris 2023
Latvijas tautsaimniecības makroekonomiskā attīstība | Septembris 2023
 
Digitālo finanšu drošība
Digitālo finanšu drošībaDigitālo finanšu drošība
Digitālo finanšu drošība
 
Darba tirgus apskats un aktualitātes 2023
Darba tirgus apskats un aktualitātes 2023Darba tirgus apskats un aktualitātes 2023
Darba tirgus apskats un aktualitātes 2023
 
Nodokļu politika un tās iespējas 2023
Nodokļu politika un tās iespējas 2023Nodokļu politika un tās iespējas 2023
Nodokļu politika un tās iespējas 2023
 
Procentu likmju celšana inflācijas mazināšanai
Procentu likmju celšana inflācijas mazināšanaiProcentu likmju celšana inflācijas mazināšanai
Procentu likmju celšana inflācijas mazināšanai
 
Inflācijas ietekme uz personīgajām finansēm
Inflācijas ietekme uz personīgajām finansēmInflācijas ietekme uz personīgajām finansēm
Inflācijas ietekme uz personīgajām finansēm
 
Ekonomikas aktualitātes 2023
Ekonomikas aktualitātes 2023Ekonomikas aktualitātes 2023
Ekonomikas aktualitātes 2023
 
Makroekonomisko Norišu Pārskats. 2023. gada marts
Makroekonomisko Norišu Pārskats. 2023. gada martsMakroekonomisko Norišu Pārskats. 2023. gada marts
Makroekonomisko Norišu Pārskats. 2023. gada marts
 
MNI Connect
MNI ConnectMNI Connect
MNI Connect
 
Ekspertu saruna par finanšu pratību
Ekspertu saruna par finanšu pratībuEkspertu saruna par finanšu pratību
Ekspertu saruna par finanšu pratību
 
Tautsaimniecības aktualitātes
Tautsaimniecības aktualitātesTautsaimniecības aktualitātes
Tautsaimniecības aktualitātes
 
Latvia`s Macro Profile 2023
Latvia`s Macro Profile 2023Latvia`s Macro Profile 2023
Latvia`s Macro Profile 2023
 
Kurā pusē sētai zāle zaļāka
Kurā pusē sētai zāle zaļākaKurā pusē sētai zāle zaļāka
Kurā pusē sētai zāle zaļāka
 
Latvijas tautsaimniecības makroekonomiskā attīstība | Marts 2023
Latvijas tautsaimniecības makroekonomiskā attīstība | Marts 2023Latvijas tautsaimniecības makroekonomiskā attīstība | Marts 2023
Latvijas tautsaimniecības makroekonomiskā attīstība | Marts 2023
 

Recently uploaded

High Class Call Girls Nashik Maya 7001305949 Independent Escort Service Nashik
High Class Call Girls Nashik Maya 7001305949 Independent Escort Service NashikHigh Class Call Girls Nashik Maya 7001305949 Independent Escort Service Nashik
High Class Call Girls Nashik Maya 7001305949 Independent Escort Service NashikCall Girls in Nagpur High Profile
 
VIP Kolkata Call Girl Serampore 👉 8250192130 Available With Room
VIP Kolkata Call Girl Serampore 👉 8250192130  Available With RoomVIP Kolkata Call Girl Serampore 👉 8250192130  Available With Room
VIP Kolkata Call Girl Serampore 👉 8250192130 Available With Roomdivyansh0kumar0
 
government_intervention_in_business_ownership[1].pdf
government_intervention_in_business_ownership[1].pdfgovernment_intervention_in_business_ownership[1].pdf
government_intervention_in_business_ownership[1].pdfshaunmashale756
 
Log your LOA pain with Pension Lab's brilliant campaign
Log your LOA pain with Pension Lab's brilliant campaignLog your LOA pain with Pension Lab's brilliant campaign
Log your LOA pain with Pension Lab's brilliant campaignHenry Tapper
 
letter-from-the-chair-to-the-fca-relating-to-british-steel-pensions-scheme-15...
letter-from-the-chair-to-the-fca-relating-to-british-steel-pensions-scheme-15...letter-from-the-chair-to-the-fca-relating-to-british-steel-pensions-scheme-15...
letter-from-the-chair-to-the-fca-relating-to-british-steel-pensions-scheme-15...Henry Tapper
 
BPPG response - Options for Defined Benefit schemes - 19Apr24.pdf
BPPG response - Options for Defined Benefit schemes - 19Apr24.pdfBPPG response - Options for Defined Benefit schemes - 19Apr24.pdf
BPPG response - Options for Defined Benefit schemes - 19Apr24.pdfHenry Tapper
 
Attachment Of Assets......................
Attachment Of Assets......................Attachment Of Assets......................
Attachment Of Assets......................AmanBajaj36
 
OAT_RI_Ep19 WeighingTheRisks_Apr24_TheYellowMetal.pptx
OAT_RI_Ep19 WeighingTheRisks_Apr24_TheYellowMetal.pptxOAT_RI_Ep19 WeighingTheRisks_Apr24_TheYellowMetal.pptx
OAT_RI_Ep19 WeighingTheRisks_Apr24_TheYellowMetal.pptxhiddenlevers
 
20240417-Calibre-April-2024-Investor-Presentation.pdf
20240417-Calibre-April-2024-Investor-Presentation.pdf20240417-Calibre-April-2024-Investor-Presentation.pdf
20240417-Calibre-April-2024-Investor-Presentation.pdfAdnet Communications
 
Q3 2024 Earnings Conference Call and Webcast Slides
Q3 2024 Earnings Conference Call and Webcast SlidesQ3 2024 Earnings Conference Call and Webcast Slides
Q3 2024 Earnings Conference Call and Webcast SlidesMarketing847413
 
Financial institutions facilitate financing, economic transactions, issue fun...
Financial institutions facilitate financing, economic transactions, issue fun...Financial institutions facilitate financing, economic transactions, issue fun...
Financial institutions facilitate financing, economic transactions, issue fun...Avanish Goel
 
SBP-Market-Operations and market managment
SBP-Market-Operations and market managmentSBP-Market-Operations and market managment
SBP-Market-Operations and market managmentfactical
 
VIP High Class Call Girls Saharanpur Anushka 8250192130 Independent Escort Se...
VIP High Class Call Girls Saharanpur Anushka 8250192130 Independent Escort Se...VIP High Class Call Girls Saharanpur Anushka 8250192130 Independent Escort Se...
VIP High Class Call Girls Saharanpur Anushka 8250192130 Independent Escort Se...Suhani Kapoor
 
Stock Market Brief Deck for 4/24/24 .pdf
Stock Market Brief Deck for 4/24/24 .pdfStock Market Brief Deck for 4/24/24 .pdf
Stock Market Brief Deck for 4/24/24 .pdfMichael Silva
 
Instant Issue Debit Cards - School Designs
Instant Issue Debit Cards - School DesignsInstant Issue Debit Cards - School Designs
Instant Issue Debit Cards - School Designsegoetzinger
 
High Class Call Girls Nagpur Grishma Call 7001035870 Meet With Nagpur Escorts
High Class Call Girls Nagpur Grishma Call 7001035870 Meet With Nagpur EscortsHigh Class Call Girls Nagpur Grishma Call 7001035870 Meet With Nagpur Escorts
High Class Call Girls Nagpur Grishma Call 7001035870 Meet With Nagpur Escortsranjana rawat
 
Vip B Aizawl Call Girls #9907093804 Contact Number Escorts Service Aizawl
Vip B Aizawl Call Girls #9907093804 Contact Number Escorts Service AizawlVip B Aizawl Call Girls #9907093804 Contact Number Escorts Service Aizawl
Vip B Aizawl Call Girls #9907093804 Contact Number Escorts Service Aizawlmakika9823
 

Recently uploaded (20)

High Class Call Girls Nashik Maya 7001305949 Independent Escort Service Nashik
High Class Call Girls Nashik Maya 7001305949 Independent Escort Service NashikHigh Class Call Girls Nashik Maya 7001305949 Independent Escort Service Nashik
High Class Call Girls Nashik Maya 7001305949 Independent Escort Service Nashik
 
VIP Kolkata Call Girl Serampore 👉 8250192130 Available With Room
VIP Kolkata Call Girl Serampore 👉 8250192130  Available With RoomVIP Kolkata Call Girl Serampore 👉 8250192130  Available With Room
VIP Kolkata Call Girl Serampore 👉 8250192130 Available With Room
 
government_intervention_in_business_ownership[1].pdf
government_intervention_in_business_ownership[1].pdfgovernment_intervention_in_business_ownership[1].pdf
government_intervention_in_business_ownership[1].pdf
 
Monthly Economic Monitoring of Ukraine No 231, April 2024
Monthly Economic Monitoring of Ukraine No 231, April 2024Monthly Economic Monitoring of Ukraine No 231, April 2024
Monthly Economic Monitoring of Ukraine No 231, April 2024
 
Log your LOA pain with Pension Lab's brilliant campaign
Log your LOA pain with Pension Lab's brilliant campaignLog your LOA pain with Pension Lab's brilliant campaign
Log your LOA pain with Pension Lab's brilliant campaign
 
Commercial Bank Economic Capsule - April 2024
Commercial Bank Economic Capsule - April 2024Commercial Bank Economic Capsule - April 2024
Commercial Bank Economic Capsule - April 2024
 
letter-from-the-chair-to-the-fca-relating-to-british-steel-pensions-scheme-15...
letter-from-the-chair-to-the-fca-relating-to-british-steel-pensions-scheme-15...letter-from-the-chair-to-the-fca-relating-to-british-steel-pensions-scheme-15...
letter-from-the-chair-to-the-fca-relating-to-british-steel-pensions-scheme-15...
 
🔝+919953056974 🔝young Delhi Escort service Pusa Road
🔝+919953056974 🔝young Delhi Escort service Pusa Road🔝+919953056974 🔝young Delhi Escort service Pusa Road
🔝+919953056974 🔝young Delhi Escort service Pusa Road
 
BPPG response - Options for Defined Benefit schemes - 19Apr24.pdf
BPPG response - Options for Defined Benefit schemes - 19Apr24.pdfBPPG response - Options for Defined Benefit schemes - 19Apr24.pdf
BPPG response - Options for Defined Benefit schemes - 19Apr24.pdf
 
Attachment Of Assets......................
Attachment Of Assets......................Attachment Of Assets......................
Attachment Of Assets......................
 
OAT_RI_Ep19 WeighingTheRisks_Apr24_TheYellowMetal.pptx
OAT_RI_Ep19 WeighingTheRisks_Apr24_TheYellowMetal.pptxOAT_RI_Ep19 WeighingTheRisks_Apr24_TheYellowMetal.pptx
OAT_RI_Ep19 WeighingTheRisks_Apr24_TheYellowMetal.pptx
 
20240417-Calibre-April-2024-Investor-Presentation.pdf
20240417-Calibre-April-2024-Investor-Presentation.pdf20240417-Calibre-April-2024-Investor-Presentation.pdf
20240417-Calibre-April-2024-Investor-Presentation.pdf
 
Q3 2024 Earnings Conference Call and Webcast Slides
Q3 2024 Earnings Conference Call and Webcast SlidesQ3 2024 Earnings Conference Call and Webcast Slides
Q3 2024 Earnings Conference Call and Webcast Slides
 
Financial institutions facilitate financing, economic transactions, issue fun...
Financial institutions facilitate financing, economic transactions, issue fun...Financial institutions facilitate financing, economic transactions, issue fun...
Financial institutions facilitate financing, economic transactions, issue fun...
 
SBP-Market-Operations and market managment
SBP-Market-Operations and market managmentSBP-Market-Operations and market managment
SBP-Market-Operations and market managment
 
VIP High Class Call Girls Saharanpur Anushka 8250192130 Independent Escort Se...
VIP High Class Call Girls Saharanpur Anushka 8250192130 Independent Escort Se...VIP High Class Call Girls Saharanpur Anushka 8250192130 Independent Escort Se...
VIP High Class Call Girls Saharanpur Anushka 8250192130 Independent Escort Se...
 
Stock Market Brief Deck for 4/24/24 .pdf
Stock Market Brief Deck for 4/24/24 .pdfStock Market Brief Deck for 4/24/24 .pdf
Stock Market Brief Deck for 4/24/24 .pdf
 
Instant Issue Debit Cards - School Designs
Instant Issue Debit Cards - School DesignsInstant Issue Debit Cards - School Designs
Instant Issue Debit Cards - School Designs
 
High Class Call Girls Nagpur Grishma Call 7001035870 Meet With Nagpur Escorts
High Class Call Girls Nagpur Grishma Call 7001035870 Meet With Nagpur EscortsHigh Class Call Girls Nagpur Grishma Call 7001035870 Meet With Nagpur Escorts
High Class Call Girls Nagpur Grishma Call 7001035870 Meet With Nagpur Escorts
 
Vip B Aizawl Call Girls #9907093804 Contact Number Escorts Service Aizawl
Vip B Aizawl Call Girls #9907093804 Contact Number Escorts Service AizawlVip B Aizawl Call Girls #9907093804 Contact Number Escorts Service Aizawl
Vip B Aizawl Call Girls #9907093804 Contact Number Escorts Service Aizawl
 

Macroeconomic Developments Report. September 2022

  • 2. MACROECONOMIC DEVELOPMENTS REPORT September 2022 MACROECONOMIC DEVELOPMENTS REPORT September 2022, No 35 © Latvijas Banka, 2022 The source is to be indicated when reproduced. Latvijas Banka K. Valdemāra iela 2A, Riga, LV-1050, Latvia Tel.: +371 67022300 info@bank.lv https://www.bank.lv; https://www.macroeconomics.lv
  • 3. 2 MACROECONOMIC DEVELOPMENTS REPORT September 2022 CONTENTS Contents Abbreviations 3 Additional information 3 Topical issues in brief 4 1. External Demand 5 2. Financial Conditions 10 2.1 Decisions of the ECB and other major central banks 10 2.2 Global financial market developments 13 2.3 Financing conditions in the Latvian economy 15 3. Sectoral Development 20 3.1 Manufacturing 20 3.2 Construction 21 3.3 Real estate sector 22 3.4 Trade 23 3.5 Transport 23 3.6 Energy 24 4. GDPAnalysis from the Demand Side 26 4.1 Domestic demand 26 4.2 Government consumption 27 4.3 Trade balance 28 5. Labour Market, Costs and Prices 31 Box 1. Which sectors will be most affected by the increase in the minimum wage? 32 Box 2. Inflation differences across the Baltics and other euro area countries 35 6. Conclusions and Forecasts 40 7. Analysis of Scenarios 42 7.1 Assessment of the impact of government support provided during the energy price crisis 42 7.2 Impact of restrictions on the availability of natural gas on Latvia's economy 44
  • 4. 3 MACROECONOMIC DEVELOPMENTS REPORT September 2022 ABBREVIATIONS Abbreviations €STR – euro short-term rate AS – joint stock company EC – European Commission ECB – European Central Bank EONIA – euro overnight index average EU – European Union EURIBOR – Euro Interbank Offered Rate FRS – US Federal Reserve System GDP – Gross Domestic Product HICP – Harmonised Index of Consumer Prices IMF – International Monetary Fund SEA – State Employment Agency US – United States of America VAT – value added tax Additional information Unless specified otherwise, the cut-off date for the information used in the publication Macroeconomic Developments Report (September 2022, No 35) is 12 September 2022. The cut-off date for the information used in the forecasts is 12 September 2022, and 15 August for the information used in some technical assumptions. Data sources for charts are Bloomberg (Charts 1 and 5–9), Refinitiv (Charts 2, 10 and 14), the EC (Charts 3, 4, 20, 27–29, 33, 36 and 2.1–2.7), Latvijas Banka (Charts 5, 11–16, 18, 20, 23, 25–28, 1.1, 33–35, 2.3–2.5, 2.7 and 37–41), the Central Statistical Bureau (Charts 12, 15, 18–20, 22–26, 28 and 30–32), the Treasury (Chart 17), SIAARCO REAL ESTATE (Chart 21), the State Unified Computerised Land Register (Chart 21), the World Trade Organisation (Chart 29), Brent (Chart 34), Title Transfer Facility (Chart 35), the ECB (Chart 2.4) as well as the Ministries of Economics, Welfare and Finance (Chart 37). Statistical data are available at: https://www.bank.lv/en/statistics/stat-data/key-macroeconomic- indicators.
  • 5. 4 MACROECONOMIC DEVELOPMENTS REPORT September 2022 Topical issues in brief TOPICAL ISSUES IN BRIEF The rise in energy and food prices triggered by the war, as well as the disruption of gas supply in Europe have led to sharp inflation hikes. Hence, the inflation forecast for Latvia has also been revised upwards. The high inflation dampens growth across the world, including Latvia. As the population's purchasing power and consumption decline, a short-lived recession is impending. Central banks, including the ECB, are on the way to removing monetary policy accommodation. Inflation in Latvia exceeds the euro area average, reflecting a higher share of food and energy in consumption, a sharper increase in their prices as well as in wages. Exports are constrained by weaker demand, falling wood prices and large stocks of raw materials. The tight labour market will mitigate the impact of the crisis on unemployment and maintain wage increases in companies even in the context of rising energy costs. Government support and spending of household savings will partly absorb the effects of the energy price crisis on the economy. The issues of energy independence and energy efficiency have become more relevant.
  • 6. 5 MACROECONOMIC DEVELOPMENTS REPORT September 2022 1. EXTERNAL DEMAND 1. External Demand High inflation has become the main downside risk to growth. Lower imports of natural gas from Russia and record-high prices create uncertainty about both prospects for economic activity and the heating season in Europe. Meanwhile, limited exports of agricultural commodities from Russia and Ukraine contribute to food price inflation. High energy and food prices limit household consumption and create an undesirable risk of de-anchoring of inflation expectations, forcing central banks to tighten their monetary policy. According to the IMF, significant downside risks to growth also include China's zero-Covid policy and the crisis in China's real estate sector, as well as a higher risk of default in developing countries, driven both by high food prices and higher interest rates due to tighter monetary policy of major central banks. The war in Ukraine and the escalated relations between the US and China pose significant geopolitical risks that may result in further adjustments to the development of the global economy. According to the latest forecast of the IMF1 published in July 2022, global growth will reach 3.2% this year, i.e. 0.4 percentage points less than projected in April. It will slow down further to 2.9% in 2023 (a negative revision of 0.7 percentage point). Meanwhile inflation could reach 8.3% in 2022 and 5.7% in 2023 (0.9 percentage point higher than projected in April). In emerging market and developing economies, where energy and food expenditure accounts for a larger share of the consumption basket, inflation is expected to be higher in 2022 and 2023 than in developed countries. Energy and food prices remain stubbornly high. Although the price of natural gas on the Dutch TTF trading point stabilised around EUR 80–100 per MWh in May and June, later it rose rapidly, reaching even more than EUR 300 per MWh. The main reason for these fluctuations is the growing concerns about the ability of European countries to fill sufficient gas reserves for the upcoming heating season, with Russia constantly reducing supply volumes. These concerns reached another turning point in early September, when Russia completely stopped supplies via Nord Stream 1 pipeline and announced that the resumption of supplies is possible only if the EU sanctions put in place after the beginning of the war were lifted. The current level of natural gas prices is about 18 times higher compared to September 20192 , although it is also characterised by a very high volatility in response to the incoming information on the sufficiency and availability of natural gas. Chart 1 WHEAT AND MAIZE PRICES ON EURONEXT EXCHANGE euro/t) ( Wheat Maize 0 50 100 150 200 250 300 350 400 450 500 0 50 100 150 200 250 300 350 400 450 500 1 2 2016 2020 2021 3 4 2022 2017 2018 2019 3 1 2 4 3 1 2 4 3 1 2 4 3 1 2 4 3 1 2 4 3 1 2 In the oil market, however, the situation is much less dramatic. Consumer sentiment there was more positive on account of the oil prices falling to pre-war levels (around USD 90 per barrel), driven by the rising global economic recession expectations. This happened despite the agreement reached by the EU countries to ban Russia's oil imports by sea at the end of 2022. Lower oil prices are reflected in cheaper fuels, easing inflationary pressures. As Ukraine's grain exports partly resumed, wheat and maize prices also fell, but they remained high at around 14% above pre-war levels. 1 International Monetary Fund. World Economic Outlook Update, July 2022. 2 Based on monthly averages (in 2022, from 1 to 8 September inclusive).
  • 7. 6 MACROECONOMIC DEVELOPMENTS REPORT September 2022 Chart 2 GAS PRICES ON DUTCH TTF TRADING POINT AND BRENT CRUDE OIL ACTUALAND FUTURE PRICES euro/MWh; US dollars/barrel) ( Gas price (euro) Gas futures contracts 0.0 0.2 0.4 0.6 0.8 1.0 1.2 0 50 100 150 200 250 300 350 0 20 40 60 80 100 120 140 2020 2022 2023 2024 2021 2020 2022 2023 2024 2021 0 20 40 60 80 100 120 140 Crude oil price of Brent (US dollars) Oil futures contracts The US economy continues to be underpinned by sustained demand and strong labour market; at the same time, it is also experiencing high inflation. Although the US is not directly dependent on Russia's natural gas, the increase in consumer prices reached its highest level over the last 40 years in June (9.1% in annual terms) and fell to 8.5% in July. The economic growth rate was negative in both the first and the second quarter (–0.4% and –0.2% quarter-on-quarter3 ), but on its own this indicator may provide an incomplete picture of the dynamics of the real economy. Private consumption increased by 0.5% and 0.4% quarter-on-quarter respectively, while investment grew by 1.2% and –3.5%. Changes in inventories and external balance also play a role. Changes in inventories have been negative in both quarters of this year, reducing GDP growth rates by 0.1 and 0.5 percentage points respectively. This could be explained both by supply chain disruptions (unfinished goods are not included in inventories) and by strong restocking in the last quarters of 2021. Instead of GDP growth, the FRS in its comments refers more frequently to the strong labour market data: the unemployment rate remained historically very low (3.7%) and employment continued to grow in August. High inflation and a strong labour market have enabled the FRS to increase the federal funds rate cumulatively by 225 basis points this year. Further hikes are expected. The IMF forecasts that the US GDP will increase by 2.3% in 2022 and 1.0% in 2023. China's zero-Covid policy, challenges in the real estate sector and relatively low inflation allow its monetary policy to move in the opposite direction from the one prevailing globally. The People's Bank of China has decided to cut its interest rates. This could be explained both by the crisis in the real estate sector, which started in 2021 when the largest real estate developer Evergrande had difficulties covering its liabilities, and the ongoing Covid-19 outbreaks that lead to mass testing and local lockdowns. This, in turn, leads to a decline in manufacturing output and hinders the functioning of global supply chains. Covid-19 had a particularly strong impact on growth in the second quarter of 2022, when GDP increased by only 0.4% year on year (–2.6% quarter on quarter). Retail trade turnover in April and May was 11.1% and 6.7% lower than a year ago respectively, but with a gradual improvement of the epidemiological situation in July the annual growth reached 2.7%. China's economy grew by 2.5% in the first half of 2021 year on year, and most analysts 3 In the United States, the quarterly growth rates are officially published in annual terms. To improve comparability with showings of other countries, all quarterly growth rates in the US have been recalculated from annual terms to quarterly terms. This report presents all quarterly growth rates in quarterly terms. 1. EXTERNAL DEMAND
  • 8. 7 MACROECONOMIC DEVELOPMENTS REPORT September 2022 1. EXTERNAL DEMAND believe that China will not achieve the government's 5.5% yearly GDP growth target this year (the IMF's June forecast for China is an increase of 3.3%). Economic difficulties in China significantly slow down the growth of the global economy through a weaker supply. Japan's recovery after the pandemic is more stable but at the same time more temperate. The GDP remained almost unchanged in the first quarter of 2022, but in the second quarter it increased by 0.9% quarter on quarter. Private consumption increased by 0.3% and 1.2% respectively, while the external sector did not provide a significant support; this is partly explained by the slowdown in China. Both in Japan and China, inflation remains much lower than in the rest of the world. Weaker consumption and cultural background do not allow producers to raise prices faster; therefore, the annual consumer price inflation was only 2.6% in Japan and 2.7% in China. In the euro area, strong recovery in the first half of the year is overshadowed by recession expectations. Despite the geographical proximity of the war, the euro area economy convincingly expanded after the easing of Covid-19 restrictions, rising by 0.7% and 0.8% quarter on quarter in the first two quarters of 2022. In the first three months, trade balance provided the largest contribution to growth (0.65 percentage point). This was mainly due to a very large surplus in Ireland, where exports of multinational corporations have a strong impact. In the second quarter, growth was much more evenly distributed across Member States, with private consumption accounting for 0.6 percentage point. Deferred consumption as Covid-19 restrictions eased provided an additional boost to inflation, consumer prices being 8.9% higher in July than a year ago. 4 percentage points of this figure were driven by energy, 2 percentage points by food and the rest – by goods and services. Core inflation also accelerated, reaching 4%. Concerns about high energy bills and geopolitical instability are the main reasons why the Consumer Uncertainty Sub-Index reached its historic peak in March and continues to grow also in August. On the other hand, economic sentiment indicators have declined significantly.4 So far, the only substantial evidence of slower expected growth in the third quarter is provided by the Purchasing Managers' Index (PMI) fallen below 50 in July and August, pointing to a decline in economic activity month-on-month (keeping in mind that part of the PMI is still constituted by the sentiment assessment). In response to the high inflation, the ECB raised its policy rates by a total of 125 basis points at its July and September meetings. In the latest projections published in September, the ECB forecasts the GDP increase of 3.1% in 2022, 0.9% in 2023 and 1.9% in 2024. Inflation is expected to reach 8.1%, 5.5% and 2.3% respectively. Compared to the June forecast, the annual growth rate of 2022 has been revised upwards by 0.3 percentage points (due to a faster-than-expected growth in the first half of the year), but lowered in 2023 (–1.2 percentage points) and 2024 (–0.2 percentage point) due to high inflationary pressures weighing on consumption, disruptions in supply chains and gas supplies, and a weak sentiment. At the same time, inflation is projected to be higher than expected in June by 1.3, 2.0 and 0.2 percentage point respectively, with energy and food exerting longer-persisting pressures on prices, with spillovers to other sectors. The ECB has also prepared a downside scenario, which assumes almost a full cut-off from Russia's gas supply and inability to replace it with other supplies, an extremely cold winter and limiting industrial capacity to save energy, as well as significantly higher energy and food prices. This scenario expects a drop in output in 2023 (–0.9% year on year) and expansion in 2022 and 2024 (2.8% and 1.9%). 4 Business and Consumer Survey (August 2022).
  • 9. 8 MACROECONOMIC DEVELOPMENTS REPORT September 2022 Chart 3 GDP Manufacturing output Retail trade turnover EURO AREA GDP, MANUFACTURING OUTPUT AND RETAIL TRADE TURNOVER ( ) annual changes; % –30 –20 –10 0 10 20 30 40 –30 –20 –10 0 10 20 30 40 2020 2021 2022 2019 1 2 4 3 1 2 4 3 1 2 4 Inflation in the Baltic countries, the highest in the EU, weakens economic activity to the point of recession5 . After the first quarter of 2022, Lithuania's relatively strong economic growth declined in the second quarter. In Estonia, the weakening of the economy has already been evident since the beginning of the year. This was determined by the impact of the war initiated by Russia, with the decrease in trade with Russia as well as the rise in energy prices, leading to very high inflation, which is significantly higher in the Baltic States than in the rest of the EU. At the end of the year, an economic recession is projected in both Estonia and Lithuania, reducing the growth of the two Baltic States in 2022. Although in the year as a whole growth is observed due to the successful first half of the year, it is significantly lower than previously. Significantly more pessimistic growth is projected for 2023, with a decelerating growth rate in the first half of the year. Inflation in the Baltic countries is projected to decline in 2023 and a gradual normalisation of fossil fuel prices will facilitate the recovery towards the end of the year. The high energy prices and the deteriorating sentiment of economic agents suggest a recession also in other major trade partner countries in the second half of 2022. In the first quarter, the economic growth of Germany was slightly above the rate projected previously, but already in the second quarter it fell slightly below the forecasts of the Deutsche Bundesbank, with the economy growing only marginally quarter on quarter. As a result of rising energy prices, Germany, which has largely depended on Russia's natural gas, recorded a deficit in its external trade balance for the first time. Both the high energy prices and a weaker global demand scale down production, thus leading to a decline in exports. At the same time, imports will also weaken due to the high energy prices, along with a decreasing domestic demand. ECONOMIC SENTIMENT INDICATOR long-term average = 100) ( Euro area Latvia Estonia Lithuania Germany Sweden Poland 50 80 90 100 110 130 60 70 2019 III VI IX XII 2020 2021 120 III VI IX XII III VI IX 2022 XII 50 80 90 100 110 130 60 70 120 Chart 4 III VI Sweden has sustained its economic growth in the first two quarters of 2022. In the second quarter, it grew faster than previously expected, with a slight improvement in the annual GDP growth forecast, while 2023 is expected to be worse. The beginning of 2022 has marked a recovery from the pandemic in the economy, along with an increase in demand. Given that the supply, in part, falls short of demand due to rising energy prices and disruptions in supply chains, like elsewhere in Europe, higher than expected price increases 5 In the preparation of the analysis of economic growth in Latvia's trade partner countries, the forecasts of the central banks were used. 1. EXTERNAL DEMAND
  • 10. 9 MACROECONOMIC DEVELOPMENTS REPORT September 2022 have been observed. Sweden's economy is facing a recession in the future, with a recovery expected in the second half of 2023. The UK is experiencing challenges similar to the rest of Europe, with the GDP falling slightly in the second quarter after rising at the beginning of the year. The trade volume is declining, while the value of exports and imports increases on account of prices. As the real income and demand dwindle, a recession is expected at the end of the year, significantly deteriorating the GDP forecast for 2023, and economic recovery is not expected until 2024. Russia's economy is experiencing a more moderate downturn instead of the projected huge decline. With the continuation of the war in Ukraine initiated by Russia and the introduction of sanctions, Russia's trade with Western countries is encumbered in many product groups, however, the value of energy exports has increased significantly. The high prices and the dependence of European countries on Russia's natural gas, which cannot be easily replaced in the short term, suggest that trade in energy is still ongoing. Trade in other product groups also has not stopped completely; for example, Latvia's exports to Russia have even increased slightly. In the future, however, the trade volumes will decrease when reaching the deadlines for the full entry into force of sanctions and gradually replacing Russia's products with imports from other countries. This will reduce the income of Russia. Economic downturn is also projected in 2023, with a slight economic recovery in 2024, but not returning to pre-war levels for a long time ahead. 1. EXTERNAL DEMAND
  • 11. 10 MACROECONOMIC DEVELOPMENTS REPORT September 2022 2. FINANCIAL CONDITIONS 2. Financial Conditions In response to the soaring inflation, major central banks have begun rapidly removing their previously particularly accommodative monetary policies since the end of March. The FRS and the Bank of England continued to raise their policy rates. After the end of net asset purchases, the ECB also increased its monetary policy rates. At the same time, despite the skyrocketing global commodity and energy prices, the Bank of Japan does not expect inflation in Japan to stay high for long and continues with its particularly accommodating monetary policy. 2.1 Decisions of the ECB and other major central banks The Governing Council of the ECB has continued with decisive normalisation of its monetary policy since the end of March. Net asset purchases under the Asset Purchase Programme (APP) ended at the beginning of July. The Governing Council decided on the lift-off of the key ECB interest rates, implementing a 50 basis points raise at the July meeting, in line with its previous signals and forward guidance, yet at a faster rate than priced in by financial markets. This decision was made seeing that inflation rates continue to reach new peaks. In September, the Governing Council increased the key ECB interest rates by a further 75 basis points. Consequently, the interest rate on the deposit facility, the main refinancing operations and the marginal lending facility have reached 0.75%, 1.25% and 1.50% respectively. The Governing Council also notified that it would continue to raise interest rates over the next several meetings, yet any future decisions on the scale would follow a meeting-by-meeting approach. In addition to that, a new non-standard monetary policy instrument, the Transmission Protection Instrument (TPI), was also announced at the July meeting, which will ensure a smooth transmission of the monetary policy stance across all euro area countries during the monetary policy normalisation. From the Governing Council's point of view, singleness of its monetary policy is a precondition for the ECB to be able to deliver on its medium-term price stability mandate. The TPI is an addition to the Governing Council's toolkit and can be activated to counter unwarranted, disorderly market dynamics that pose a serious threat to the transmission of monetary policy across the euro area. The scale of TPI asset purchases depends on the severity of the risks facing monetary policy transmission. Purchases are not restricted ex ante. In any event, the flexibility in reinvestments of redemptions coming due in the pandemic emergency purchase programme (PEPP) portfolio remains the first line of defence to counter risks to the transmission mechanism related to the pandemic. After the Governing Council's September meeting, ECB's President Christine Lagarde indicated that, while buoyant tourism has been supporting economic growth during the third quarter, the economy can be expected to slow down substantially over the remainder of this year. There are four main reasons behind this. First, high inflation is dampening spending and production throughout the economy, and these headwinds are reinforced by gas supply disruptions. Second, the strong rebound in demand for services that came with the reopening of the economy will lose steam in the coming months. Third, the weakening in global demand, also in the context of tighter monetary policy in many major economies, and the worsening terms of trade will mean less support for the euro area economy. Fourth, uncertainty remains high, and household and business confidence is falling sharply. With regard to risks to the growth of the euro area economy, it is noted that, in the context of the slowing global economy, risks to growth are primarily on the downside, in particular in the near term. At the same time, the risks to the inflation outlook are primarily on the upside. In the same way as for growth, the major risk in the short term is a further disruption of energy supplies. Analysts forecast that the interest rate on the ECB's deposit facility could rise to 1.50% in early 2023 and the main refinancing rate could climb to 2.00%.
  • 12. 11 MACROECONOMIC DEVELOPMENTS REPORT September 2022 2. FINANCIAL CONDITIONS At the same time, in early September financial markets priced in a potential rise to 2.30% over the next 12 months for the ECB's main refinancing rate. Chart 5 Pre-pandemic situation, prior to the fall in the financial markets (19 February 2020) March (31 March 2022) Day before th last ECB Governing Council's e meeting on interest rates (7 September 2022) September (9 September 2022) MARKET-IMPLIED PATH OF THE ECB'S DEPOSIT FACILITY RATE ( ) % –1.0 0.0 0.5 1.0 1.5 2.0 2.5 3.0 –0.5 –1.0 0.0 0.5 1.0 1.5 2.0 2.5 3.0 –0.5 2022 2023 2024 1 2 3 4 3 1 2 4 3 4 Chart 6 EURO MONEY MARKET RATES (%) EONIA €STR 3-month EURIBOR 6-month EURIBOR 12-month EURIBOR –1.0 –0.5 0.0 0.5 1.0 1.5 2.0 2.5 –1.0 –0.5 0.0 0.5 1.0 1.5 2.0 2.5 2019 2021 2020 2022 The FRS continued to raise the target range for the federal funds rate. At its May meeting, it increased the target range by 50 basis points, and at June and July meetings by further 75 basis points each (to 2.25%–2.50%). In addition, in early May, the FRS published detailed information on the expected balance sheet reduction. It indicated that the balance sheet reduction would primarily take place by adjusting the amounts reinvested and much more aggressively than previously expected. As of 1 June, for the FRS reinvestments of the principals of maturing US Treasury securities, the cap was set at 30 billion US dollars per month, whereas for agency debt and agency mortgage-backed securities, the cap was set at 17.5 billion US dollars per month. In September, these caps were increased to 60 billion US dollars and 35 billion US dollars respectively. The FRS also notes that, to ensure a smooth transition to the level the FRS judges to be appropriate to the financial market needs, it intends to slow and then stop the decline in the size of the balance sheet. At the same time, it is prepared to adjust any of the details of its approach to reducing the size of the balance sheet in light of economic and financial developments. With regard to the US economy, the FRS notes that the incoming data show a weakening of consumption and output. At the same time, job creation has continued to be healthy in recent months and unemployment remains low. Inflation has remained elevated, reflecting the mismatch between supply and demand linked to the pandemic, high energy and food prices, as well as broader upward price pressures. In addition, at the end of the summer at Jackson Hole's economic forum, the Chair of the FRS Jerome Powell pointed out that the FRS should continue on its course aimed at bringing inflation down to the FRS target level. He also suggested that a successful reduction in inflation is likely to result in lower economic growth, but for inflation to be normalised, policy rates should remain restrictive for some time. On 7 September, financial markets expected the FRS target range to peak after 6 months within the current rate-hike cycle. At the same time, financial markets also expect it to be the first of the major central banks to start lowering interest rates, with the first reduction of the target range expected already after 12 months.
  • 13. 12 MACROECONOMIC DEVELOPMENTS REPORT September 2022 US (March 2022) UK (March 2022) Japan (March 2022) US (September 2022) UK (September 2022) Japan (September 2022) Chart 7 MARKET-IMPLIED CENTRAL BANK POLICY RATES (%) –0.5 0.0 0.5 1.0 1.5 2.0 2.5 3.0 3.5 4.0 4.5 2022 2023 2024 –0.5 0.0 0.5 1.0 1.5 2.0 2.5 3.0 3.5 4.0 4.5 2025 Like the FRS, the Bank of England continued to raise its Bank Rate. At each of its meetings in early May and mid-June, the Monetary Policy Committee (MPC) decided to increase the Bank Rate by 25 basis points, but, as inflation continued to reach new peaks, at the August meeting it decided to step up and to raise the Bank Rate by 50 basis points, to 1.75%. In its August Monetary Policy Report, the Bank of England points out that the upward inflationary pressures in the United Kingdom have intensified in the summer months. This is mainly due to the wholesale price of natural gas, which has risen sharply due to Russia's restrictions on supply. As the high wholesale prices feed through to retail energy prices, it will exacerbate the fall in the households' real incomes and further increase inflation in the near term. Inflation could remain elevated throughout 2023, before returning to the Bank of England's 2% target in a two years' time. The economic activity is slowing. The latest rise in natural gas prices has led to significant deterioration in the outlook for activity, and the UK is projected to enter into a recession in the fourth quarter of 2022. Financial markets have priced in that the Bank of England's Bank Rate could reach 4.5% over the next 12 months, representing the highest level in this policy rate hiking cycle. The Bank of Japan is maintaining the short-term policy interest rate at –0.1% and the target level of 10-year government bond yields at around 0.0%, thereby continuing its yield curve control policy. According to the Bank of Japan, the economy is likely to continue recovering, with the impact of Covid-19 and supply-side constraints waning. At the same time, the negative effects of the downward pressure stemming from a rise in commodity prices is also noted. Financial markets expect that the Bank of Japan's target rate could be increased to 0.1% over the next 12 months, yet the management of the Bank of Japan points out that no revision of the rates is foreseen for the time being and it is committed to keeping the rates at the current level. Chart 8 CENTRAL BANK ASSETS (relative to GDP; %) 0 20 40 60 80 100 120 140 160 0 20 40 60 80 100 120 140 160 United Kingdom US Euro area Japan 2006 2008 2010 2012 2014 2016 2018 2020 2022 2. FINANCIAL CONDITIONS
  • 14. 13 MACROECONOMIC DEVELOPMENTS REPORT September 2022 2. FINANCIAL CONDITIONS 2.2 Global financial market developments The increase in the interest rates of the major central banks was reflected in a substantial rise in government bond yields. As inflation rates continue to grow and are increasingly moving away from the targets of the major central banks, thereby increasing the risk of inflation expectations becoming unanchored, the rhetoric and actions of the major central banks aimed at containing inflation and avoiding second-round inflation effects have also become more resolute. As a result, the yields on government bonds of developed countries also rose significantly, with only a few episodes of decline, when the market participants' sentiment was clouded by concerns that the sharp increase in interest rates could lead to a slowdown in economic growth. This contributed to higher volatility in government bond markets, also affecting the deterioration of the liquidity. The yield on German ten- year government bonds increased by 109 basis points, to 1.63%, during the review period (31 March–6 September), temporarily rising even above 1.77% in mid-June and reaching the historical levels of the end of 2013. The yields on ten-year government bonds in France, Spain, Greece and Italy rose by 125 basis points, 138 basis points, 157 basis points and 194 basis points respectively. A higher increase in debt security yields in Spain, Italy as well as Greece compared to that in Germany could be explained by a more prudent investors' assessment of the sovereign debt sustainability in a context of rising interest rates. The political turmoil in Italy also contributed to an increase in the yields on its government securities. At the same time, the flexible approach to reinvesting the maturing principals of the PEPP portfolio to the benefit of the southern countries as well as the announcement of TPI prevented uncontrolled increases in the yields of the government securities in these countries. The yields on US Treasury debt securities rose more slowly this time, given that in the past they increased faster than those on German debt securities. The future evolution of the government bond yields will largely depend on the overall inflation and economic developments and on the central banks' monetary policy stance in response to these changes. Chart 9 7-YEAR GOVERNMENT BOND SPREADS RELATIVE TO GERMAN GOVERNMENT BOND YIELDS ( s) basis point France Spain Italy Latvia 0 50 100 150 200 250 300 0 50 100 150 200 250 300 2019 2021 2020 2022 2 3 4 1 2 3 4 1 2 3 4 1 2 1 The yields on corporate debt securities also increased as well as their spreads relative to the risk-free rates. The yields in the euro area and US corporate debt securities markets generally moved in line with the sovereign bond yields. They increased significantly both for investment-grade corporate debt securities and high-yield debt securities, thus further increasing the financing costs of businesses, which in turn contributed to an increase in spreads relative to the risk-free rates, especially for high-yield debt securities. The soaring commodity prices, especially those on natural gas, also contributed to the widening of spreads in Europe. However, the borrower's default rate remains very low. With central banks winding down their government bond purchases and the yields on government bonds rising, investors' appetite for higher-risk and higher-yield corporate debt declined, which was also reflected in the rise in the yields on corporate debt securities. Moreover, the increase in yields was more pronounced in the high-yield debt securities market and it was observed across all high-yield credit rating categories. Despite the rising corporate yields, investment-grade companies continued to issue new debt securities, while the riskier high- yield companies were very reluctant to raise new market-based financing. In the coming
  • 15. 14 MACROECONOMIC DEVELOPMENTS REPORT September 2022 months, the yields on corporate debt securities will remain dependent on the pace of the central banks' monetary policy normalisation, overall economic growth and commodity price developments as well as the sectoral outlook, and most likely will also remain sensitive to the incoming inflation data. Stock markets fell, with the sharpest price declines experienced by the technologies and the health care sectors which had gained most during the Covid-19 pandemic. Following a small episode of calm in mid-summer, stock markets continued to fall. Particularly, the hawkish stance of the FRS in containing the inflation, with the policy rate lift-off on 16 March and further rapid normalisation of its monetary policy, had a negative impact on stock market sentiment. Market concerns about the rapid rise in interest rates potentially leading to an economic downturn were coupled by expectations of a gradual containment of inflation. In addition, the high energy prices, especially in Europe, exerted an additional downward pressure on stock prices. However, the fall was slowed down by the still solid earnings of the second quarter. Stock valuations in both the euro area and the United States continued to decline. The US technology industry repeatedly suffered the biggest losses. The NASDAQ-100 index characterising the US tech stock market fell by 19.1% between 31 March and 6 September. The persistently high oil prices, the uncertainty caused by the war in Ukraine and the new outbreaks of Covid-19 in China also had a negative impact on the overall sentiment and contributed to investors turning away from stocks. Stock markets remained highly volatile, with the mood swinging in a broad range within a day and the sell-off episodes replaced by price increases during the next trading sessions. The implied volatility indices, both the European VSTOXX and the US VIX, developed in opposite directions. While the European VSTOXX index declined by 1.6 percentage points compared to its spike at the end of February, the US VIX index rose by 6.4 percentage points. The EuroStoxx index characterising the euro area stock market has declined by 10.9%, whereas S&P 500 index characterising the US stock market contracted even more sharply, by 13.7%. During the period under review, only the stock prices of energy sector companies rose in the euro area (by 5.0%). The technology sector (by 16.4%), the health care sector (by 14.3%) and the insurance sector (by 13.4%) experienced the biggest decline in their stock prices. Looking at the euro area stock market at a country level, it appears that the decrease in the Italian FTSE MIB index, the German DAX index and the French CAC 40 index (by 14.2%, 10.7% and 8.3% respectively) were larger than that of the Spanish IBEX 35 index (by 7.1%). Further developments in the stock markets will continue to largely depend on the pace of economic development and on the ability of policy makers to balance decisions and measures, so that to contain the rising inflation without leading to a significant economic downturn and subsequent revaluation of financial assets. The supply of natural gas during the heating season in Europe and the possible need for coercive energy saving measures, as well as the level of the natural gas price, will also have a significant impact on the further development of stock prices. A more aggressive US monetary policy and the natural gas price shock in Europe are putting downward pressure on the euro. From the beginning of March to 6 September, the euro depreciated further by 10.5% against the US dollar, trading below parity and reaching 0.9904 US dollars per euro. The main developments that contributed to the weakening of the euro were a faster normalisation of US monetary policy than in the euro area, leading to a widening of the difference between the two policy rates, and the exceptionally rapid increase in natural gas prices in Europe. The war in Ukraine and political problems in Italy also contributed to the depreciation of the euro. Sell-off episodes in high-risk investments (stocks) contributed to the demand for US dollars, thus weakening the euro. Analysts expect the euro to gradually appreciate to 1.03 against the US dollar by the end of March 2023. Future developments in the euro exchange rate will depend on the dynamics of the monetary policy decisions of the FRS and the ECB and future outlooks. The uncertainty and consequences of the Russian-Ukraine war on the development of the euro area and the 2. FINANCIAL CONDITIONS
  • 16. 15 MACROECONOMIC DEVELOPMENTS REPORT September 2022 global economy, in particular the future of gas supply in Europe, will undoubtedly also have an impact on the future prospects of the euro exchange rate. Chart 10 EURO EXCHANGE RATE AGAINST US DOLLAR AND FUTURE MARKET EXPECTATIONS EUR/USD EUR/USD (future expectations; September 2022) 0.95 1.00 1.05 1.10 1.15 1.20 1.25 2019 III VI IX XII 2020 2021 III VI IX XII III VI IX 2023 XII III VI IX XII III 2022 0.95 1.00 1.05 1.10 1.15 1.20 1.25 2.3 Financing conditions in the Latvian economy The decline in the sentiment caused by the hostilities, soaring inflation and the lift-off of the euro base rates will have a negative impact on Latvia's financing conditions and long-term borrowing; the prevailing high uncertainty has already discouraged businesses from borrowing in the long term. Lending was dominated by short-term loans related to energy shortages and preparations for the heating season. Consequently, the increase in the corporate loan portfolio was driven by short-term loans to companies in the energy sector. At the same time, the growth of household loans for house purchase and consumer credit continued to be robust. The domestic loan portfolio (excluding loans to the general government) increased by 4.8% in March–July 2022, driven by both growth in household loans (by 2.6%, including a 2.4% rise in loans for house purchase and a 7.4% increase in consumer credit) and loans to non-financial corporations (by 5.5%, including a 27.6% increase in short-term loans). The adjusted annual growth rate of domestic loans (excluding loans to general government) increased to 4.3% in July, the highest level since early 2017, with the annual growth of loans to non-financial corporations (1.1%) becoming positive and the annual growth in household loans reaching 4.5% (5.0% for loans for house purchase). Chart 11 DOMESTIC LOANS ( ) outstanding amounts; annual changes*; % –10 –8 –6 –4 –2 0 2 4 8 Residents total (excluding government) Non-financial corporations Households * For the sake of comparability, the effects related to the restructuring of the banking sector and one-off factors have been excluded. 6 –10 –8 –6 –4 –2 0 2 4 8 6 2019 III VI IX XII 2020 2021 III VI IX XII III VI IX XII III VI 2022 Chart 12 Q1 2021 Q2 2021 Q3 2021 Q4 2021 Q1 2022 Q2 2022 15.5 14.3 13.0 1.5 36.0 0 5 10 15 20 25 30 35 40 45 0 5 10 15 20 25 30 35 40 45 Household loans Loans to non-financial corporations Loans for house purchase Consumer credit Aggregate loans DOMESTIC LOANS ( ) outstanding amounts; % of GDP 2. FINANCIAL CONDITIONS
  • 17. 16 MACROECONOMIC DEVELOPMENTS REPORT September 2022 Nominal GDP growth continued to weigh on the already low ratio of domestic loans to GDP, pushing it down to 36.0% in the second quarter (37.8% in 2021). Chart 13 NEW DOMESTIC LOANS ( ) flows; millions of euro Households Non-financial corporations 0 50 100 150 200 250 300 350 400 0 50 100 150 200 250 300 350 400 2019 III VI IX XII 2020 2021 III VI IX XII III VI IX 2022 XII III VI The interest rate on corporate loans remained broadly unchanged from February to July: after falling at the beginning of the period under review, with the ECB gradually normalising its monetary policy, it returned to the previous level. The interest rate on new corporate loans in euro remained broadly unchanged (2.9% in both February and July), as it was affected by countervailing factors. On the one hand, the rising corporate demand of short-term loans for inventories and working capital had a downward effect on the interest rate on loans to enterprises. Credit institutions granted more short-term corporate loans with an interest rate lower than the long-term lending rate, including to a number of large companies with low credit risk. For example, in May 2022, AS Latvenergo concluded two short-term loan agreements for the financing of current assets and liquidity management for a total amount of 200 million euro. On the other hand, the increasing euro money market indices had an upward effect on the corporate lending rates. The uncertainty related to the Russian war in Ukraine contributed to a slight increase in the credit risk premium for long-term corporate loans during the reporting period. In 2022 and 2023, corporate loans are at a high risk of rising interest rates. As the majority of corporate loans have been issued at a variable rate, the September decision of the ECB's Governing Council on a 75 basis points increase of the key ECB interest rates and the financial market expectations of further rate increases will quickly be reflected in the interest rates on new corporate loans and, after the next regular revision of lending rates, also in the rates on existing loans. At the same time, the negative impact of the soaring energy prices caused by the Russian military aggression may strengthen if the development or sales prospects of the Latvian economy, individual sectors or enterprises weakens and the risk tolerance of credit institutions decreases. The interest rate on household loans for house purchase tended to rise as money market indices increased and the composition of lending flows changed. The interest rate on new household loans for house purchase in euro gradually increased from 2.3% in February to 2.7% in July. Since the start of spring, in the housing loan segment, mainly the interest rates on unsecured loans, usually provided for housing repairs and improvements, increased, and the overall lending composition was also influenced by the rising demand for measures to improve the energy efficiency of housing. Loans of this type often carry a higher interest rate than traditional mortgage-backed housing loans. At the end of the period under review, as money market indices of different maturities gradually turned positive, their upward effect on interest rates on housing loans strengthened. Interest rates on housing loans will continue to rise in the near future, mainly due to further ECB's monetary policy normalisation. In a context of soaring inflation, as households' real purchasing power declines and their credit risk grows, the priced in credit risk and credit risk premiums may increase. The interest rates on consumer credit and other lending to households declined as a result of stronger competition between credit institutions and changes in the composition 2. FINANCIAL CONDITIONS
  • 18. 17 MACROECONOMIC DEVELOPMENTS REPORT September 2022 2. FINANCIAL CONDITIONS of lending flows. The weighted average interest rate on consumer credit and other lending to households declined gradually over most of the period under review (down from 11.1% in February to 10.9% in June), with an exceptional fall to 8.9% in July. Stronger competition among credit institutions, as well as households giving preference to credit institutions offering more favourable interest rates contributed to the rate reduction in this lending segment. During the period under review, the conclusion of study and student loan agreements had a downward impact on interest rates in the particular lending segment. Despite a fall in the past six months, the interest rate on consumer credit and other lending to households could rise in the coming year if inflation continues to undermine households' purchasing power and increases credit risk. Chart 14 INTEREST RATES ON NEW CREDIT INSTITUTION LOANS IN EURO AND 3-MONTH EURIBOR (%) Loans to enterprises Loans to households for house purchase 3-month EURIBOR Consumer credit and other lending to households (right-hand scale) –4 0 4 8 12 16 –1 0 1 2 3 4 2020 2021 2022 III VI IX XII III VI IX XII III VI IX XII III VI 2019 High inflation significantly increased household spending, mostly depleting the savings accumulated during the pandemic. Not only has the upward trend in household deposits observed for two years slowed down, but it has reversed even in nominal terms in recent months. With annual inflation above 20% in July, consumer spending also reduced the total stock of domestic deposits. The annual growth rate of deposits is only 7%, and the real decline in savings is accelerating: for example, in July, the real decline in deposits has been at least 2% in monthly terms and more than 10% year on year. The fall in real incomes of the population, as wage growth lags behind inflation, is no longer allowing a large part of households to build up precautionary savings, although several factors (e.g. expected record- high utility payments in the winter period and the impact of the expected recession) could encourage them to do so. As a result, the annual growth rate has slowed more for household deposits but has been volatile with no visible downward trend for corporate deposits. In July, the annual growth rate of domestic household deposits stood at 7.2%, whereas that of corporate deposits was 6.9% (including a 10.9% rise for deposits by non-financial corporations). In nominal terms, the growth of deposits in the five months from March to July stood at 2.8% (5.7% and 1.3% rise in deposits by non-financial corporations and household deposits respectively, including a 5.5% fall in fixed term deposits). This indicates that at least part of the population had to tap into the savings made for a rainy day. The expected recession in autumn and winter will reduce the overall income level, so the stock of deposits will decrease. Chart 15 Total deposits of domestic enterprises and households Deposits of non-financial corporations Household deposits Annual inflation DOMESTIC DEPOSITS AND INFLATION ( ) outstanding amounts; annual changes; % –5 0 5 10 15 20 25 –5 0 5 10 15 20 25 2020 2021 2022 VI IX XII III VI IX XII III VI IX XII III VI 2019 III
  • 19. 18 MACROECONOMIC DEVELOPMENTS REPORT September 2022 Higher money market indices have been poorly reflected in interest rates on deposits. The overall weighted average interest rate on euro deposits remained close to zero, although the rate on corporate demand deposits turned positive. At the same time, the interest rate on new fixed-term deposits of households and enterprises in euro even decreased, as the flow of new business in credit institutions offering relatively higher interest rates declined (from 0.2% in February to 0.1% in July). In the future, however, the growth of deposits and interest rates on new fixed term deposits will be supported by a faster increase in money market indices. Households also spend their cash savings accumulated during the Covid-19 pandemic for consumption needs in a context of rising inflation. As a result, the net issuance of cash decreased from 101 million euro to 12 million euro between the end of March and the beginning of September. The population was able to spend public support received during the peak of the pandemic. Chart 16 NET ISSUANCE OF EURO BANKNOTES BY LATVIJAS BANKA ( ) millions of euro 2022 XII 2021 III VI IX –500 –400 –300 –200 –100 0 100 200 –500 –400 –300 –200 –100 0 100 200 XII III VI IX III VI IX 2020 Government financing conditions also deteriorated due to the rising interest rates. On the secondary market, Latvia's government bond yields increased, following the overall trend of the euro area sovereigns. The average yield on 9-year bonds increased from 1.34% at the end of March to 2.69% on 6 September. The spread vis-á-vis the German government bonds of an equivalent maturity widened from 86 basis points to 115 basis points. This can be explained by a higher vulnerability of the Baltic economies and the border with Russia. At the same time, the Latvian government continued to place its securities that were previously released on international markets on the domestic market (same ISIN for securities launched on both the domestic and international markets). 11 auctions were held in April–August, where due to higher interest rates the supply in recent months was lower than in spring. The total supply was 540 million euro, whereas the bids amounted to 1179 million euro, resulting in full allotment of the supply. 2 to 6-year bonds were offered at the auctions. Chart 17 AUCTIONS OF GOVERNMENT SECURITIES (millions of euro) –0.5 0.0 0.5 1.0 1.5 2.0 2.5 0 100 200 300 400 500 600 700 800 Supply (millions of euro) Bids (millions of euro) Allotment (millions of euro) 2–4-year bond yield (%; right-hand scale) 5–7-year bond yield (%; right-hand scale) 8–10-year bond yield (%; right-hand scale) 2021 2022 I II III IV V VI VII VIII IX X XI XII I II III IV V VI VII VIII Since March, all three leading international credit rating agencies affirmed the previous Latvian credit ratings and maintained a stable outlook. Agencies (Moody's, S&P Global Ratings, Fitch Ratings) stressed that Latvia is reducing its energy dependence on Russia, the country has a moderate level of sovereign debt, as well as stability is ensured by its NATO and EU membership. Consequently, the impact of the Russian-induced war in Ukraine on the Latvian economy as well as the fiscal situation will be relatively limited. 2. FINANCIAL CONDITIONS
  • 20. 19 MACROECONOMIC DEVELOPMENTS REPORT September 2022 Despite the expectations of rising interest rates, private sector debt issuers have been able to raise financing. AS Latvenergo issued 5-year green bonds in the amount of 100 million euro at a fixed annual interest rate of 2.42%, rolling over the previous issue. BluOr Bank AS issued 7-year unsecured subordinated bonds at a fixed annual interest rate of 7% and an issue amount of 4.9 million euro. The self-service coffee service provider in the Baltic States, SIA Coffee Address Holding, in cooperation with Signet Bank AS, carried out the issue of unsecured bonds in the amount of 5 million euro. Signet Bank AS, in cooperation with its subsidiary car leasing company AS Primero Finance, carried out the first securitisation issue in Latvia. The Bank helped its subsidiary to issue asset-backed securities in the amount of 9.5 million euro. AS Conexus Baltic Grid announced its intention to issue and list unsecured bonds of up to 80 million euro on the stock exchange this year. The investment management company IPAS Indexo raised the planned 7.5 million euro in the initial public offering of stock. These stocks were listed on Main List of the stock exchange AS Nasdaq Riga. Online building materials and lifestyle goods trader prof.lv, SIA and car wash network AS Puto plan to list their stocks on the stock exchange and concluded agreements with the Central Finance and Contracting Agency on attracting EU co-financing for this purpose. The decrease in stock prices and indices was determined by the war in Ukraine, which negatively affected the cooperation of Latvian companies with partners in Ukraine, Russia and Belarus, as well as by changes in the business environment. On the Latvian stock market, the stock price index OMXR decreased by 2.9% on 6 September 2022 compared to the end of March 2022 and the Baltic stock price index OMXBBGI decreased by 7.7%. These developments were similar to those on the major global stock markets when the risks of the global recession increased. An increase in stock prices of AS DelfinGroup by 7.1% and a rise in the stock prices of AS Virši-A by 2.3% are worth a special mention. At the same time, the stock prices decreased for AS MADARA Cosmetics (by 25.2%), AS Latvijas Gāze (by 13.0%) and IPAS Indexo (by 3.8%). AS DelfinGroup announced that it is forecasting stable development in the next three years, and its revenue increased by 46% in the second quarter compared to the corresponding period of the previous year. AS Virši-A acquired 20% of the stock of AS Skulte LNG Terminal. AS MADARA Cosmetics reduced its future growth goals, whereas AS Latvijas Gāze will most likely have to undergo reorganisation. 2. FINANCIAL CONDITIONS
  • 21. 20 MACROECONOMIC DEVELOPMENTS REPORT September 2022 3. Sectoral Development6 The rise in energy prices and the impact of sanctions imposed on Russia have already started to erode economic growth. The lifting of restrictions related to the Covid-19 pandemic in the second quarter helped the sectors like accommodation and food service activities, art, culture and entertainment services as well as air transport services to recover substantially from a low level. While higher demand for many services already contributed to price hikes, consumers' purchasing power was partly supported by their savings accumulated during the pandemic. The actual ties of economic cooperation with the aggressor countries were not severed immediately, thus enabling build-up of inventories and delaying or slowing down the decline in activity in a number of sectors (e.g. industry, construction, transport). However, activities of certain companies (including wholesale companies) were already restricted by the sanctions imposed on their owners because of the war in Ukraine. At the same time, the current and expected cost increases caused many economic operators to act with more caution, which materialised gradually until July in household real spending (affecting development of retail trade), industry and energy. According to EC survey data, several services sectors have witnessed the optimism related to the expectations of lifting pandemic restrictions wane and pessimism strengthen in relation to the development outlook over the next three months, albeit not reaching the lows seen during the pandemic. Chart 18 VALUE ADDED AND GDP IN THE SECOND QUARTER OF 2022 (changes; %; in brackets: contribution of the sector to GDP in 2021) Q2 2022 compared to the pre-pandemic level (Q4 2019) Q2 2022 quarter on quarter –20 –15 –10 –5 10 0 5 25 15 35 20 30 GDP Financial and insurance activities (3.0) Trade (13.4) Construction (5.4) Health and social care (4.7) Real estate activities (9.7) Public administration (7.0) Mining, energy, water supply (2.7) Education (4.4) Manufacturing (11.8%) Transportation and storage (6.3%) Agriculture, forestry (4.0) Information and communication services (5.1) Accommodation and food service activities (0.9) Arts, entertainment and recreation, other services (2.0) Professional, scientific and technical activities (7.1) 3.1 Manufacturing The slowdown in the development of manufacturing is mainly driven by the decline in the wood industry owing to decreasing demand and profitability. In manufacturing, a monthly drop was increasingly observed during the second quarter. Although prices and demand for wood products remain higher than before the pandemic, after a period of high growth the wood industry experiences a decline affecting the overall performance of manufacturing. A more significant decline is exhibited by the export value where construction-related wood products prevail. With construction activity decreasing, demand for these products is also shrinking. The sharp drop in demand and prices is also driven by overstocked warehouses in Europe. The desire to fill up warehouses was caused by supply chain disruptions during the pandemic, and it was further amplified by the upcoming sanctions on wood products originating in Belarus and Russia, as well as by concerns regarding the shortage of fuel wood. The fuel wood segment, which accounts for a higher share domestically, remains strong and is also projected to be robust in the coming years. The main source of concern regarding further development of both the wood industry and other manufacturing sectors pertains to energy costs. Production was already ceased in many companies when the high electricity prices reached the peaks. With profitability following a downward path and savings accumulated in previous periods shrinking, 6 This chapter analyses GDP and sectoral activity at constant prices, using seasonally and calendar adjusted data (unless otherwise specified). 3. SECTORAL DEVELOPMENT
  • 22. 21 MACROECONOMIC DEVELOPMENTS REPORT September 2022 the situation will deteriorate further. State support helps, but it will not succeed in fully addressing the problems. The increase in energy costs affects every producer, but there are also other areas of concern in each sector. Engineering industries experience easing in metal prices and, out of concern for its availability, they find alternatives to metal supplies (concerning future transactions, currently warehouse stocks are increasingly used) or replacement of this material following the collapse of Russian imports. Building materials are still in demand, but the decline in construction activity in the region raises concerns about future demand. Demand for food production is more resilient, but costs (also those of grain, including feed grain) are growing and the issue of competitiveness is becoming more acute. Productivity of fragmented and relatively small firms is lower than that of rivals, and vulnerability is higher. Overall, manufacturing is expected to contract further in the second half of the year. Chart 19 MANUFACTURING (2019 = 100) average Production output Total turnover* Turnover in domestic market* Non-domestic turnover* 85 95 * At current prices. 115 125 135 145 155 85 95 105 115 125 135 145 155 2022 XII 2021 III XII III VI IX III VI IX 2020 VI 3.2 Construction The price hikes of commodities and construction materials have significantly increased the costs of ongoing construction projects. This led to a fall in real volume in the construction sector and financial losses to builders. The performance of the construction sector was weaker than expected in the first half of 2022. Value added in the construction sector continued to decline in the second quarter of 2022 and decreased by 3.3% quarter on quarter. Risks related to climbing prices and costs continued to weigh on the construction sector. The increase in construction costs, challenges as regards access to construction input materials and supply chains have been affected by both the Covid-19 pandemic and the Russian war in Ukraine. In the second quarter, the overall level of construction costs increased by 22% year on year. This is mainly due to a sharp increase in prices of building materials (metal, cement, glass, thermal insulation materials, expanded polystyrene, polymers). The mounting prices of building materials have been beneficial to their producers whose production volumes and turnover have increased notably, but the turnover of other sectors of the construction industry has been adversely affected by rising construction costs. Therefore, construction activity and volumes continued to decline also in the second quarter, significantly hampering the sector's growth, including the implementation of public sector projects. The upward trend in construction costs has had a negative impact not only on investors' interest in making new investments but also on the execution of the existing contracts and the implementation of the ongoing construction projects, leading to a significant risk that construction merchants might unilaterally terminate works contracts and withdraw from them. As a result, buildings will not be completed and/or they will be frozen. The government has approved rules on standard contracts in relation to public construction projects and guidelines for assessing the rising costs of building materials, but unfortunately these indexation mechanisms have not been fully used by the sector. The building permits issued in the second quarter reveal that the size of the areas intended for construction continued to contract, and this also offers no hope of rebound in construction activity in the coming quarters. 3. SECTORAL DEVELOPMENT
  • 23. 22 MACROECONOMIC DEVELOPMENTS REPORT September 2022 3. SECTORAL DEVELOPMENT The Rail Baltica multi-annual project, demand and the need to renew the housing stock, as well as the available financial resources in the form of various EU funds for the implementation of public sector projects (the Recovery and Resilience Facility funding and the European structural funds within the multi-annual budget) provide opportunities for the construction sector to boost its growth, while the drop in real construction volumes for the fourth consecutive quarter raises concerns that the construction sector may lack sufficient capacity for the delivery of the available investments and acceleration of growth. Chart 20 CONSTRUCTION SECTOR'S INDICATORS ( ) 2019 average = 100; sentiment – net responses Production output Number of the employed Construction costs Manufacture of non-metallic mineral products Sentiment (right-hand scale) 2 3 4 5 6 7 8 80 85 90 95 100 105 110 115 120 125 130 2019 2021 2020 2022 2 3 4 1 2 3 4 1 2 3 4 1 2 1 3 3.3 Real estate sector Inflation and the soaring energy costs have contributed to changes in the real estate market: the share of transactions involving energy efficient housing is constantly growing. In the second quarter of 2022, the value added of the real estate market sector, following a minor increase registered at the beginning of the year, decreased by 0.8% quarter on quarter. Although the real estate market experiences price stabilisation (the average price of standard apartments was 973 euro/m² in July), transaction dynamics have been put on a declining path compared with the last year. This was driven by price hikes and the decrease in household savings. In the first eight months of this year, the number of transactions registered with the Land Register recorded a decline of 4.7% in Latvia but an increase of 3.2% in Riga. The secondary market witnessed changes in summer compared to the situation at the beginning of the year. In 2021 (during the Covid-19 pandemic), business class housing was more preferred, and transactions with land and private houses in Pieriga picked up driven by the need to perform remote work from home. Meanwhile, with energy prices surging in 2022, the supply of standard apartments took an upward trend in Riga in summer months as the population, in anticipation of the new heating season, started to look more actively for possibilities to change the existing housing to a new one – smaller and more energy efficient. Demand for housing remains above supply. In the segment of new projects, the supply and choice also continue to decrease, as an uptrend in construction costs leads to the postponement of residential projects, reducing very substantially the number of new project proposals. Chart 21 AVERAGE PRICE OF STANDARD APARTMENTS IN RIGAAND THE NUMBER OF CONTRACTS REGISTERED WITH THE LAND REGISTER Purchase contract in Latvia s Purchase contracts in Riga Average price (euro/m ; SIAARCO REAL 2 ESTATE; right-hand scale) 973 0 200 400 600 800 1000 1200 0 1000 2000 3000 4000 5000 6000 2020 2021 2022 VI IX XII III VI IX XII III VI IX XII III VI 2019 III It is expected that the real estate market will continue to face a number of problems in the second half of 2022: the increase in borrowing interest rates and prices of energy
  • 24. 23 MACROECONOMIC DEVELOPMENTS REPORT September 2022 3. SECTORAL DEVELOPMENT resources (higher expenditure on heating and electricity) and inflation, which will reduce the population's savings and, consequently, the possibility to purchase new housing. 3.4 Trade The decline in trade was driven both by the impact of sanctions on wholesale and by more cautious household spending on retail goods. The development of the trade sector deteriorated significantly in the second quarter of 2022. This was partly due to the normalisation of retail trade volumes observed already in April following the post-pandemic shopping boom in March, when consumers made pent-up purchases. However, the effects of the rising price levels also gradually translated into the fall in real spending, and these effects continue to take their toll in the third quarter, as evidenced by both retail trade data until July and card payment data for most of the weeks of the third quarter. The fall in specialised wholesale and belonging of the wholesale companies owned by sanctioned owners to this subsector suggest that these could be the factors contributing to the decline in the trading sector observed in the second quarter. As a result of these factors, the total value added of the trade sector was 7.3% lower than in the previous quarter. On the other hand, car sales saw a pickup in the second quarter, and this increase could have been driven by pent-up spending during the pandemic. At the same time, the number of newly registered cars is no longer increasing. Despite the availability of government support to compensate the exceptional increase in energy prices, the decline in real purchasing power and the soaring housing maintenance costs will likely continue to limit household spending on retail goods. Recovery of wholesale dented by the sanctions is not expected either. Thus, the trade sector is still expected to experience a decline in the coming quarters. Chart 22 TRADE TURNOVER IN SUBSECTORS ( ) 2019 average = 100 Wholesale Trade and repair of motor vehicles Retail trade 50 60 70 80 90 100 110 120 130 50 60 70 80 90 100 110 120 130 2020 2021 2022 VI IX XII III VI IX XII III VI IX XII III VI 2019 III 3.5 Transport The transport sector has managed to avoid the worst case scenario for the time being, but the sector's future development will no longer be so positive. In the first half of 2022, the transport sector saw a steady increase in freight traffic by rail and in volumes of cargoes loaded and unloaded at Latvia's ports, as well as a significant uptrend in air passenger flows at Riga Airport. Although the worst case scenario for freight transport has not materialised following the Russian invasion of Ukraine, freight transport activity is expected to decline in the second half of the year. Geopolitical tensions continue to raise concerns about the future dynamics of the transport sector. The slowdown in the road transport sector was driven by both the restrictions introduced on the Russian market and the new mobility package conditions for freight transport in Europe. In the first half of the year when road freight transport decreased significantly, affecting primarily international transport flows, the total freight circulation fell by 7.3% year on year. Road transport flows to Russia are expected to continue on a downward trend in the second half of the year, but the role of the region in Latvia's road transport structure has been gradually declining since 2014 (currently less than 10% of total freight turnover).
  • 25. 24 MACROECONOMIC DEVELOPMENTS REPORT September 2022 3. SECTORAL DEVELOPMENT The volumes of cargoes loaded and unloaded at ports and rail freight showed a surprisingly good performance, contrary to concerns about retaliatory sanctions or even general cargo blockade from the Russian side. The volume of cargoes loaded and unloaded at ports increased by 15.3% in the first half of the year, while rail freight turnover increased by about 21% year on year. This can be explained by the desire of companies to get their cargoes out of Russia as quickly as possible after the Russian invasion of Ukraine for fear of possible sanctions and safety of their cargoes in the territory of Russia. The volume of coal cargoes from Kazakhstan has also increased. This has been driven by the growing demand for cheaper fuels in Europe as a result of soaring energy prices. While coal transit volumes are expected to climb at the end of the year, other cargo segments will inevitably see a drop in cargo volumes as the transitional period during which goods subject to EU sanctions could be imported from or exported to Russia under earlier contracts has expired. The transitional period for transportation of iron, steel and ferrous metals ended in June, while that for transportation of wood, potassium-containing fertilisers and cement – in July, and the ban on coal and other fossil fuels entered into force in August. The consequent drop in freight volume is expected to unfold in the second half of the year, and the rail transport, where the share of Russian origin cargoes accounts for about half of all cargoes transported, will be most affected. In addition, a further decline in cargo volumes will be supported by the ban on imports of Russian oil and oil products to Europe, which will enter into force at the beginning of next year. The expansion of demand was driven by buoyant growth in air transport, but the industry has failed yet again to reach the pre-pandemic levels. In the first half of the year, the number of passengers transported by Latvian airlines multiplied by around four year on year. It is important to note that the availability of labour currently substantially limits the ability of the air transport sector to meet the rapidly growing demand for flights, the number of which the sector had to reduce during the pandemic. The air cargo industry performed not so well, as it was severely affected by the ban on international flights over the Russian airspace. In the first half of the year, the volumes of cargoes transported by Latvian airlines reached about 11 thousand tons (a year-on-year decrease of 11%). Chart 23 FREIGHT TURNOVER IN MAIN TYPES OF FREIGHT TRAFFIC ( ne in tonne-kilometres; at ports – in ton s; annual changes; %) Road transport Railway Ports –60 –50 –40 –30 –20 –10 0 10 20 30 40 –60 –50 –40 –30 –20 –10 0 10 20 30 40 2021 2020 2022 2 3 4 1 2 3 4 1 2 1 3.6 Energy The energy sector is gradually embarking on austerity. According to industrial statistics, output of the energy sector increased slightly in the second quarter, albeit this rise was driven solely by the indicators achieved in April. Over the following months (May–July), the output of electricity, particularly in cogeneration plants, decreased notably, and the production volume of the electricity and natural gas supply sector, measured at constant prices, was also historically low if a comparison is made of the respective months in the longer term. These dynamics are in line with the high prices of fossil fuels (natural gas) and the ongoing search for alternative supply channels and thus the need to save these resources. The high energy prices faced by final consumers and uncertainty regarding the supply of fossil resources will encourage economic agents, at least during the current heating season, to curb
  • 26. 25 MACROECONOMIC DEVELOPMENTS REPORT September 2022 3. SECTORAL DEVELOPMENT energy consumption both in dwellings and companies, thus reducing energy demand and significantly limiting the sector's growth. Chart 24 ENERGY SECTOR INDICATORS ( ) May–July Total gross electricity generation (TWh) Including at cogeneration plants (TWh) Electricity and gas supply (production volume; May–July 2015 = 100; right-hand scale) 85 90 95 100 105 110 115 120 125 0 200 400 600 800 1000 1200 1400 1600 2006 2008 2010 2012 2014 2016 2018 2020 2022
  • 27. 26 MACROECONOMIC DEVELOPMENTS REPORT September 2022 4. GDP ANALYSIS FROM THE DEMAND SIDE 4. GDPAnalysis from the Demand Side7 4.1 Domestic demand Although the most challenging period – the heating season with high costs at the end of the year and the beginning of next year – is still ahead, spending is already being affected by precaution and high inflation. In the second quarter, GDP contracted by 1.0% quarter on quarter, maintaining a positive annual growth at 2.9%. The fall in the quarterly pace was determined by a decrease in private consumption and an increase in imports. The contraction in private consumption was affected by the decline in purchasing power and precaution. On the other hand, the increase in imports was driven by the uncertainty caused by the war, the expected restrictions imposed by sanctions, as well as price hikes. This has contributed to filling warehouses with raw materials and finished products: imports of all types of goods, particularly intermediate goods, have increased. Imports of capital goods for investment purposes have also followed an upward path. Chart 25 GDPAND DEMAND SIDE COMPONENTS (quarterly changes; %; demand side – percentage points) Imports of goods and services Exports of goods and services Changes in inventories Gross fixed capital formation Public consumption Private consumption GDP quarterly changes –25 –20 –15 –10 –5 0 5 10 15 20 –25 –20 –15 –10 –5 0 5 10 15 20 2020 2019 2022 2 3 4 1 2 3 4 1 2 2 3 4 1 2021 1 As a result of the heightened uncertainty prevailing since the beginning of the war and the rapid price rises, the population faces a decision-making dilemma: whether to spend the savings reduced by inflation or save more by way of precaution? Data for the second quarter reveal that private consumption has started to decline, as income and savings made during the previous periods do not fully offset spending of the population. While household deposits were still growing in nominal terms year on year and data from various surveys suggest that, in general, the population is cautious when it comes to spending, and this caution may also persist in the third quarter as the heating season is approaching, deposits have started to fall not only in real but also in nominal terms during recent months. However, behaviour of the population is not homogeneous: the mentioned frugality and the increasing desire to spend the savings due to their falling value as well as to implement travel plans after lifting the restrictions imposed during the pandemic (as evidenced by a sharp increase in consumer credit, mainly for travel purposes). Chart 26 INDICATORS DESCRIBING PRIVATE CONSUMPTION (Q 2019 = 100; %; sentiment – net response changes 4 , Q4 2019 = 0) Real wage fund Retail trade Private consumption Consumers sentiment (right-hand scale) –30 –25 –20 –15 –10 –5 0 5 10 15 70 75 80 85 90 95 100 105 110 115 2020 2021 2022 2 3 4 1 2 1 2 3 4 1 7 This chapter analyses GDPand demand components at constant prices, using seasonally and calendar adjusted data (unless otherwise specified).
  • 28. 27 MACROECONOMIC DEVELOPMENTS REPORT September 2022 4. GDP ANALYSIS FROM THE DEMAND SIDE Chart 27 CONSUMER CONFIDENCE AND UNDERLYING FACTORS ( ) net responses; percentage points Larger purchases planned in next 12 months the Country's economic outlook for the next 12 months Financial position of the household in the next 12 months Financial position of the household in the previous 12 months Consumer confidence –35 –30 –25 –20 –15 –10 –5 0 5 –40 –35 –30 –25 –20 –15 –10 –5 0 5 –40 2020 2021 2022 VI IX XII III VI IX XII III VI IX XII III VI 2019 III Investment was maintained by imports of capital goods – machinery and transport equipment. Investment in construction is hampered by both uncertainty and an increase in costs, in particular by rising prices of building materials, which have led to a review of already prepared or even launched investment plans. The rise in credit interest rates gradually pushes up costs, while the implementation of new investment projects is hampered by war-induced insecurity, weakening the attractiveness of the regions closest to the aggressor states. With the risks of the global recession increasing, private investment may fall, and public infrastructure projects will take over the key role of heating the economy. On the other hand, additions to vehicle (trains, planes) equipment and machinery dominate in the investment projects requiring imports of capital goods. Currently, alternative power supply equipment and energy efficient equipment to reduce energy costs, i.e. solar panels, heating boilers, heat pumps, allocators, thermostatic radiator heads, etc. are particularly sought after. Chart 28 INVESTMENT (2019 = 100) average 0 20 40 60 80 100 120 140 0 20 40 60 80 100 120 140 Gross fixed capital formation Construction of buildings Construction of engineering structures Imports of capital goods* * According to Latvijas Banka's estimates of capital goods for June. 2020 2021 2022 2 3 4 1 2 1 2 3 4 1 4.2 Government consumption Government support provided during the energy crisis by the end of the year will result in a larger budget deficit. Meanwhile, in the seven months of 2022, the general government deficit reached 98.2 million euro, significantly less in year-on-year terms. This was driven by higher budgetary revenues, mainly – by higher-than-expected tax revenue growth. However, in the second half of the year, the budget balance is expected to deteriorate due to both the weakening economic activity and the government spending to offset the increase in energy prices and mitigate the impact of inflation. The general government budget deficit for this year is estimated at 7.9% of GDP, increasing by 2.2 percentage points compared to the June projections. The budget deficit projections for 2023 and 2024 have been increased to 3.5% and 2.6% of GDP respectively, taking into account both the sluggish economic growth and additional measures promoted by the government on the expenditure side of the budget. The rapid increase in energy prices will reduce the real purchasing power of the population, which, as the heating season resumes, will have a negative impact on economic activity, and the growth rate of tax revenues will decline by the end of the year.
  • 29. 28 MACROECONOMIC DEVELOPMENTS REPORT September 2022 In the seven months of 2022, general government revenue increased by 11.5% year on year to around 8 billion euro. The increase was mainly driven by high tax revenues supported by the recovery of economic activity and the growth of private consumption (both owing to lifting the restrictions imposed during the Covid-19 pandemic), as well as the rising prices of goods and services, coupled with increases in employment and wages in the economy. In seven months, the consumer tax revenue grew by 17.1%, while the revenue from labour taxes – by 30.0% year on year. As a result of the decline in economic activity, overall tax revenue growth by the end of the year will moderate. Meanwhile, budget expenditure this year is driven by state support measures to mitigate the increase in energy prices, provide assistance to Ukraine and its people and strengthen defence and internal security. Overall, during the seven months of this year general government expenditure increased only by 0.7% year on year. Expenditure on social benefits declines, as support measures and investment linked to the Covid-19 pandemic have diminished. On the other hand, it has been intended to allocate more than 1 billion euro for energy crisis support measures between 2021 and 2023, with the largest share earmarked for the 2022–2023 heating season. The support package includes a number of consumption- enhancing measures: an earlier pension indexation, social support and compensation for part of the increase in heat supply and heating costs for households. The government support designed to partially compensate for the effects of the increase in energy prices is also intended for companies. Due to these measures and other steps, budget expenditure will increase faster in the second half of the year, exceeding 15% increase year on year at the end of the year. The rise in budget expenditure is expected to continue also in the coming years, including a significant increase to strengthen internal security and defence. With deadlines of the absorption of EU funds approaching, faster flows are expected, which will continue to boost overall government consumption and public investment. Despite the deterioration of the budget balance, the lower debt level is driven by GDP growth in nominal terms and by the liquidity accumulated so far. In 2022, the government debt level will reach 45.0% of GDP, falling by 1.5 percentage points compared to the June projections (46.5%). In 2023 and 2024, the government debt level will continue to decline gradually, while in the coming years, a more moderate economic growth will keep government debt at 44.4% and 42.9% of GDP respectively. 4.3 Trade balance The increase in the value of exports and imports in the first half of the year was already dominated by the price effect, and the approaching recession and contraction in demand will reduce both exports and imports. Contrary to the initial forecasts that foreign trade would weaken due to the sanctions, exports and imports of goods and services increased in the second quarter. Concerns about the shortage of certain raw materials and price rise intensified trade. Stocks in warehouses, which were already full due to the disruptions of supply chains caused by the pandemic, were replenished. As the pandemic-related restrictions were eased, the services sector also became more active. However, most of the increase was due to the price effect, while in real terms, exports of goods and services grew by 0.7% compared to the first quarter, with the volume of both goods and services increasing at a similar pace. Imports saw a faster increase in the volume of goods (goods and services in real terms constituted 1.7%) securing energy for the future and importing goods from Russia prior to the entry into force of the sanctions. In the second quarter, exports of goods continued to grow due to rising prices, with articles of wood, machinery and electrical equipment predominating. Export value of agricultural products and products of the chemical industry remained high. Due to the dominance of the price effect, the value of exports of mineral products doubled in the first half of 2022 year on 4. GDP ANALYSIS FROM THE DEMAND SIDE
  • 30. 29 MACROECONOMIC DEVELOPMENTS REPORT September 2022 year, with re-exports accounting for the bulk of it. However, as early as in June, the value of exports fell as wood prices decreased due to a shrinking external demand and deteriorating overall future outlook, thus signalling a turning point in exports. In the second quarter, imports of goods were dominated by mineral products whose value appreciation was driven by both high prices and efforts to secure natural gas reserves for the future. The increase in imports was also driven by machinery, electrical appliances and vehicles (mostly planes), as well as wood whose imports slightly picked up in April and May before the sanctions against Russia and Belarus came into force. In the second quarter, exports and imports of services rose well above the pre-pandemic levels. Most of these exports and imports are made up of various business services and information and communication services. Travel exports also recovered in May and June. Overall, during the first half of the year, the increase in exports of goods and services has not been able to offset the import growth, thus creating a significant deficit in the trade balance of the first half of the year. Concerns about the future development of foreign trade are mainly related to the impending recession, the continuation of Russia's war in Ukraine and the energy price crisis. In the second half of the year, amid a weakening demand, both exports and imports of goods and services will decline in Latvia as well as in its trade partner countries. The export value of goods will be reduced by the decrease in wood prices, while the increase in natural gas prices, which has a more significant impact on the import side, is likely to persist for a longer period. However, the gas reserves already in place and the decline in domestic demand will significantly reduce the need for imports, to be reflected in a lower deficit in the trade balance in the second half of the year. In the second quarter, the terms of trade in goods that play a major role both in exports and imports, i.e. wood and mineral products respectively remained favourable. However, already in June when wood prices started to fall but energy prices continued on an upward path, there was a shift towards deteriorating trading conditions. As regards trade in services, the export side will also be weakened by the lack of development opportunities for rail freight. Export ties with Russia have not weakened since the outbreak of the war as previously expected. At the same time, imports from Russia have decreased significantly. A further decline in imports is expected in view of the entry into force of the sanctions and the end of contract execution. For example, imports of mineral products and base metals from Russia have already decreased which is reflected in lower re-export volumes. In general, imports from Russia have been partly replaced by products from other countries, e.g. other countries play a stronger role in imports of natural gas. The rapidly increasing energy and labour costs in Latvia may weaken competitiveness, particularly in non-EU countries. In the first half of 2022, an increase in the cost competitiveness indicator – the real effective exchange rate (REER), which includes 37 national currencies and is deflated by the unit labour costs (ULC) and the export price index, has slowed down, while the REER, deflated by the HICP and the GDP deflator, continues to increase. Latvia's share of exports in world imports is stable, and this share also shows a slight long-term growth trend and some seasonal fluctuations in imports of most of Latvia's major partner countries. Competitiveness analysis is also important from the point of view of government support provided during the energy crisis. The profitability level of the traditionally exporting sectors, i.e. manufacturing and agriculture, remains close to the pre-pandemic level (on average in 2017–2019). It should be noted that profitability in the manufacturing industry remained stable during the pandemic as the export structure was dominated by goods still in demand on export markets. The lifting of pandemic restrictions contributed to a rapid rebound in economic activity in a number of 4. GDP ANALYSIS FROM THE DEMAND SIDE
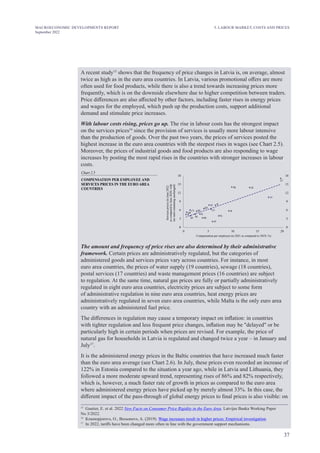
  • 31. 30 MACROECONOMIC DEVELOPMENTS REPORT September 2022 4. GDP ANALYSIS FROM THE DEMAND SIDE services sectors engaged in services exports (e.g. accommodation, catering, air transport); the production volume in catering services even exceeded the pre-pandemic levels. Meanwhile, the profitability level of these services continued to lag behind significantly, suggesting a sharp increase in costs. Chart 29 EXPORT MARKET SHARE AND REAL EFFECTIVE EXCHANGE RATE (2015 = 100) average 95 100 105 110 115 120 125 130 95 100 105 110 115 120 125 130 REER_unit labour costs. REER_HICP REER_GDP deflator REER_export prices Global market share of exports of goods (four-quarter moving average) 1 2 2015 2020 2021 3 4 2022 2017 2018 2019 3 1 2 4 3 1 2 4 3 1 2 4 3 1 2 4 3 1 2 4 1 2 3 4 1 2 2016
  • 32. 31 MACROECONOMIC DEVELOPMENTS REPORT September 2022 5. LABOUR MARKET, COSTS AND PRICES 5. Labour Market, Costs and Prices With unemployment declining after the Covid-19 pandemic, the labour market remains tight. In the second quarter of 2022, the unemployment rate in Latvia decreased to 6.6%, as did the unemployment rate registered with the State Employment Agency in August (to 5.8%). Although household concerns about the increasing rate of unemployment are lower than during the pandemic, they still remain relatively high8 . Following a leap at the beginning of the year after the end of the pandemic, employment expectations of businesses have stabilised. Labour shortage in manufacturing as a factor weighing on business activities has declined somewhat since the beginning of the year, while remaining at its elevated pre-pandemic level – it is still high in construction and even increased in the services sector. Chart 30 SHARE OF BUSINESSES REFERRING TO LABOUR SHORTAGES AS A MAJOR FACTOR WEIGHING ON BUSINESS ACTIVITIES ( ; %) seasonally and calendar adjusted data 0 10 20 30 40 0 10 20 30 40 Manufacturing Construction Services 1 2 2015 2020 2021 3 4 2022 2017 2018 2019 3 1 2 4 3 1 2 4 3 1 2 4 3 1 2 4 3 1 2 4 1 2 3 4 1 2 2016 3 Refugees from Ukraine continue to participate in Latvia's labour market, but they do not have a significant impact on the overall rate of unemployment or employment. According to the data from the State Employment Agency, approximately six thousand refugees from Ukraine (less than 1% of the number of employed persons) had found a job over the period from the outbreak of the war until the end of July. From the beginning of June to the end of July, the State Employment Agency received weekly about 300 applications for job vacancies from Ukrainian refugees, which is a relatively small fraction considering that the total number of unemployed persons exceeds 52 thousand. Moreover, labour demand is significantly higher – according to the data from the State Employment Agency, the total number of the current vacancies was 30 thousand in July 2022, with nine thousand new vacancies being registered in the same month. The rate of unemployment is expected to increase somewhat during the recession. In the first half of the year, a lower than previously anticipated rate of unemployment reduces the unemployment forecast for 2022 to 6.7% (–0.6 percentage point compared to the June forecast). The projected weakening of activities of several sectors will also find reflection in a minor increase in the rate of unemployment around the turn of the year. In the short run, the sharp rise in unemployment will be hampered by the high number of vacancies and, consequently, businesses might initially decide not to search for employees, without laying off the current employees. Therefore, unemployment would remain at the level of 2022 (6.7%; –0.4 percentage point) in 2023. The forecast scenario assumes a rebound in economic activity in the second half of the next year, which would be positively reflected in a slight decline in the unemployment rate (to 6.3%) in 2024 as also previously projected. The sectors with lower average wages are recovering from the pandemic crisis, which is a factor weighing on the average wage growth. In the first half of this year, the services sectors were recovering from the pandemic crisis, with the number of persons employed in these sectors increasing rapidly. This also affected the average wage in the country. A striking example is the accommodation and food service activities sector, where in the first half of 2022 the number of employed persons rose by 80% year on year. As wages in this 8 Unemployment expectations of households, employment expectations of businesses and the assessment of labour shortages based on the EC business and consumer survey. Available at Time series (europa.eu).
  • 33. 32 MACROECONOMIC DEVELOPMENTS REPORT September 2022 5. LABOUR MARKET, COSTS AND PRICES BOX 1. WHICH SECTORS WILL BE MOST AFFECTED BY THE INCREASE IN THE MINIMUM WAGE?9 In April 2022, the Ministry of Welfare proposed to raise the minimum wage to 640 euro per month as of 1 January 2023.10 This would imply that the minimum wage is likely to reach a level close to 60% of the median wage, slightly exceeding the OECD average. The raising of the minimum wage is one of the tools for a country to reduce poverty and income inequality among the employed. However, such a step may also have certain side effects. A higher minimum wage can reduce employment, especially among younger and low-paid employees. Namely, if employee productivity is below the minimum wage level, the employer has no economic justification for retaining the job (position). Latvijas Banka's calculations using the CGE and EUROMOD models show that, in the long term, the raising of the minimum wage contributes to lower inequality in income (as measured by the Gini index) and a minor increase in private consumption. Meanwhile, as 9 Prepared by Oļegs Tkačevs, economist of Latvijas Banka. 10 "Ministrija piedāvā no 2023. gada vismaz līdz 640 eiro celt minimālo algu cenu kāpuma dēļ", lsm.lv, 21.04.2022. sector are lower than the average in the country, this had a dampening effect on the average wage growth. In the second quarter of 2022, the average wage increase reached 8.3% year on year. The rise in prices was faster; therefore, the purchasing power of employed persons decreased already for the second consecutive quarter. The wage bill also declined in real terms in the second quarter. Chart 31 AVERAGE MONTHLY GROSS WAGE AND WAGE BILL ( ; %) annual changes Real wages Wages Wage bill Real wage bill –12 –8 –4 0 4 8 12 16 –12 –8 –4 0 4 8 12 16 2020 2021 2022 2019 1 2 3 1 2 4 3 1 2 4 3 1 2 4 Chart 32 FIVE SECTORS WITH THE HIGHEST AND LOWEST GROSS WAGE GROWTH RATES IN THE SECOND QUARTER OF 2022 ( ; %) annual changes Health and social care Other service activities Financial and insurance activities Electricity, gas, steam and air conditioning supply Professional, scientific and technical activities Transportation and storage Arts, entertainment and recreation Agriculture, forestry and fishing 0 2 4 6 8 10 12 14 16 Public administration and defence, compulsory social security Water supply, sewerage, waste management and remediation activities Inflation and labour market tightness will further increase the wage growth. Moreover, discussions on the increase in the minimum wage (16% of employed persons currently receive the minimum wage or less) are underway. At the beginning of the year, lower than expected wage growth contributes to a downward revision of the wage growth forecast for 2022 (up to 8.5% (–1.8 percentage points)). The major constraint to the wage increase is the steep rise in energy prices, which forces businesses to spend more on other production resources instead of the labour force. The increase projected for 2023 is 7.2% (+0.5 percentage point). In 2024, with the economy recovering, labour shortages will again be a factor contributing to wage growth (forecast for 2024 is 7.5%).
  • 34. 33 MACROECONOMIC DEVELOPMENTS REPORT September 2022 labour costs, especially the costs for low-skilled workers, pick up, labour is replaced by capital or a company does not cope with the competition and goes bankrupt. Moreover, the rise in labour costs worsens the competitiveness of businesses in external markets, leading to a decline in exports. The overall long-term impact on employment and GDP is estimated to be negative (for more details, see the study to be published soon). However, the impact on Latvia's economy overall masks significant differences in the breakdown of economic sectors. Chart 1.1 shows that the highest share of employees earning a wage below the set minimum might be recorded by the accommodation and food service activities (30.1%)11 , 500 640 500 640 1000 1500 2000 5000 500 640 1000 1500 2000 5000 1000 1500 2000 5000 500 640 1000 1500 2000 5000 500 640 1000 15002000 5000 500 640 1000 1500 2000 5000 4. (5.8%) Construction 7. Accommodation and food service (30.1%) activities 10. (21.6%) Real estate activities 500 640 1000 1500 2000 5000 500 640 1000 15002000 5000 500 640 1000 1500 2000 5000 500 640 1000 1500 2000 5000 500 640 1000 1500 2000 5000 500 640 1000 1500 2000 5000 Chart 1.1 GROSS MONTHLY WAGE IN 2021 (frequency; the share of employees who earn a monthly wage of less than 640 euro is given in ) brackets 1. (25.7%) Agriculture 2. (15.0%) Manufacturing 3. (11.5%) Electricity, gas and water supply 5. (22.9%) Wholesale and retail trade 6. (17.3%) Transportation 8. Information and communication (5.2%) services 9. (3.2%); Financial services 11. (11.0%) Professional services 12. Administrative and other service (16.8%) activities The wage level is 640 euro Gross monthly wage (frequency) 11 The share of employed persons per sector has been calculated using the wage statistics for 2021, i.e. excluding the wage increase in 2022. Assuming that the wage growth by sector will be even in 2022, the calculated share will be lower in 2023, with the indicated differences across sectors persisting. 5. LABOUR MARKET, COSTS AND PRICES