Ukraine Monthly Economic Review, September 2017
•
1 like•393 views

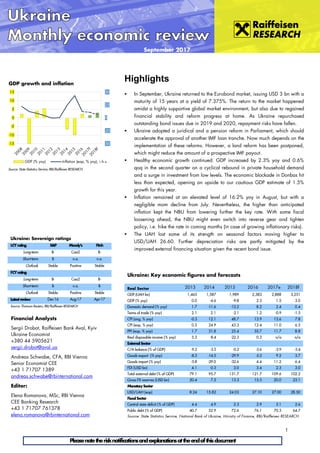
This document provides an economic overview and analysis of Ukraine. It discusses Ukraine's return to international bond markets in September 2017, raising $3 billion. Two key reforms were passed in October that should allow Ukraine to receive its next IMF loan tranche. GDP growth was estimated at 2.3% in Q2 2017 due to growth in household consumption and investment. Inflation remained high at 16.2% in August despite a seasonal decline in food prices. Producer price inflation accelerated to 23.6% in August.

Recommended
Recommended
More Related Content
What's hot
What's hot (20)
Similar to Ukraine Monthly Economic Review, September 2017
Similar to Ukraine Monthly Economic Review, September 2017 (20)
Recently uploaded
Recently uploaded (20)
Ukraine Monthly Economic Review, September 2017
- 1. 1 Pleasenotetherisknotificationsandexplanationsattheendofthisdocument September 2017 Ukraine: Sovereign ratings LCYrating S&P Moody's Fitch Long-term B- Caa2 B- Short-term B n.a. n.a. Outlook Stable Positive Stable FCYrating Long-term B- Caa2 B- Short-term B n.a. B Outlook Stable Positive Stable Latestreview Dec-16 Aug-17 Apr-17 Source: Thomson Reuters, RBI/Raiffeisen RESEARCH Ukraine: Key economic figures and forecasts Real Sector 2013 2014 2015 2016 2017e 2018f GDP (UAH bn) 1,465 1,587 1,989 2,383 2,888 3,251 GDP (% yoy) 0.0 -6.6 -9.8 2.3 1.5 3.0 Domestic demand (% yoy) 1.7 -11.6 -12.2 8.2 2.4 0.4 Terms of trade (% yoy) 2.1 2.1 -2.1 1.2 -0.9 -1.5 CPI (avg, % yoy) -0.3 12.1 48.7 13.9 13.6 7.8 CPI (eop, % yoy) 0.5 24.9 43.3 12.4 11.0 6.5 PPI (eop, % yoy) 1.7 31.8 25.4 35.7 11.7 8.8 Real disposable income (% yoy) 5.3 -8.4 -22.3 0.3 n/a n/a ExternalSector C/A balance (% of GDP) -9.2 -3.5 -0.2 -3.6 -3.9 -3.4 Goods export (% yoy) -8.3 -14.5 -29.9 -5.2 9.2 3.7 Goods import (% yoy) -5.8 -29.0 -32.6 4.4 11.2 6.4 FDI (USD bn) 4.1 0.3 3.0 3.4 2.3 3.0 Total external debt (% of GDP) 79.1 95.7 131.7 121.7 109.6 102.2 Gross FX reserves (USD bn) 20.4 7.5 13.3 15.5 20.0 23.1 MonetarySector USD/UAH (eop) 8.24 15.82 24.03 27.10 27.00 28.50 FiscalSector Central state deficit (% of GDP) 4.4 4.9 2.3 2.9 3.1 2.6 Public debt (% of GDP) 40.7 52.9 72.6 76.1 70.3 64.7 Source: State Statistics Service, National Bank of Ukraine, Ministry of Finance, RBI/Raiffeisen RESEARCH Highlights In September, Ukraine returned to the Eurobond market, issuing USD 3 bn with a maturity of 15 years at a yield of 7.375%. The return to the market happened amidst a highly supportive global market environment, but also due to regained financial stability and reform progress at home. As Ukraine repurchased outstanding bond issues due in 2019 and 2020, repayment risks have fallen. Ukraine adopted a juridical and a pension reform in Parliament, which should accelerate the approval of another IMF loan tranche. Now much depends on the implementation of these reforms. However, a land reform has been postponed, which might reduce the amount of a prospective IMF payout. Healthy economic growth continued: GDP increased by 2.3% yoy and 0.6% qoq in the second quarter on a cyclical rebound in private household demand and a surge in investment from low levels. The economic blockade in Donbas hit less than expected, opening an upside to our cautious GDP estimate of 1.5% growth for this year. Inflation remained at an elevated level of 16.2% yoy in August, but with a negligible mom decline from July. Nevertheless, the higher than anticipated inflation kept the NBU from lowering further the key rate. With some fiscal loosening ahead, the NBU might even switch into reverse gear and tighten policy, i.e. hike the rate in coming months (in case of growing inflationary risks). The UAH lost some of its strength on seasonal factors moving higher to USD/UAH 26.60. Further depreciation risks are partly mitigated by the improved external financing situation given the recent bond issue. Source: State Statistics Service, RBI/Raiffeisen RESEARCH GDP growth and inflation -50 -25 0 25 50 -15 -10 -5 0 5 10 15 GDP (% yoy) Inflation (eop, % yoy), r.h.s. Financial Analysts Sergii Drobot, Raiffeisen Bank Aval, Kyiv Ukraine Economist +380 44 5905621 sergii.drobot@aval.ua Andreas Schwabe, CFA, RBI Vienna Senior Economist CEE +43 1 71707 1389 andreas.schwabe@rbinternational.com Editor: Elena Romanova, MSc, RBI Vienna CEE Banking Research +43 1 71707 761378 elena.romanova@rbinternational.com
- 2. 2 Pleasenotetherisknotificationsandexplanationsattheendofthisdocument Ukraine Economic Policy In September, Ukraine returned to the market of international borrowings for the first time in 4 years. The new Eurobond issue amounted to USD 3 bn with final maturity in 15 years (on 25 September 2032), amortizing in four equal instalments on 25 March 2031, 25 September 2031, 25 March 2032 and 25 September 2032. The demand was surprisingly high – USD 9.5 bn with about 350 investors bidding. The bond’s interest rate amounted to 7.375% at placement. In order to lower debt burden in 2019-2020, the Ministry of Finance decided to use virtually half of the placement’s net proceeds to repurchase USD 1.2 bn of its notes due 2019 and USD 0.4 bn notes due 2020. Thus, Ukraine managed to reduce its peek debt payments in 2019-2020, which we view as a positive factor for financial stability improvement of the country, especially given the fact that 2019 is an election year. Nevertheless, the external debt payments stay high in the next few years, pressing for acceleration of reforms and on-going cooperation with the IMF. In the beginning of October, Ukraine proceeded with two reforms that should accelerate the approval of the next IMF tranche, in our view. First, the Parliament adopted a judicial reform, which is an important step in combating corruption. Moreover, the pension reform, which is within the core IMF requirements, was approved on October 3. In case the reforms will see an active start, we expect Ukraine to gain good chances to finalize the fourth review soon, after the next Fund’s technical mission to Kyiv. Initially, the volume of the upcoming tranche was planned at USD 1.9 bn. However, now given the significant delay due to a dilatory reforming process (it was planned in May) and a postponement of a land reform for the next review, we do not rule out the possibility of a reduction of the tranche sum. Real Sector According to the Ukrstat, Gross Domestic Product (GDP) increased by 2.3% yoy in Q2 after 2.5% yoy growth in Q1. With respect to the previous quarter, the economy posted a growth of 0.6% qoq. From the production side, manufacturing (+4.2% yoy, but -1.1% qoq), construction (+28.8% yoy or +7.8% qoq) and trade (+3.8% yoy or +2.6% qoq) were the major drivers of growth, benefitting from improvements in business environment and living standards. On the other hand, economic blockade in Donbas has hit the mining industry and energy sector, where the decline was, respectively, 5.7% yoy (-1.8% qoq) and 8.8% yoy (-2.6% qoq). Agricultural activity has posted a decline by 2.9% yoy (-1.5% qoq). Expenditure-based approach shows significant improvement in household consumption (from +2.8% yoy in Q1 to +6.9% yoy, or +1.9% qoq) on the back of growth in wages and much less volatile prices. The demand for capital investments also remains sanguine, in comparison with the previous crisis years. Investments increased by 23.7% yoy (+7.4% qoq). Exports fell by 2.1% yoy (-0.5% qoq) in real terms, while imports surged by 4.6% yoy (but -6.3% qoq). Thus, the contribution of net exports to GDP growth in Q2 was negative. We keep our GDP forecast at a level of +1.5% yoy in 2017, but see a possibility for a stronger GDP performance. For the second half of 2017, we expect that investments activity should cool down due to partially satisfied demand for investments. For 2018, we still expect 3% yoy growth. Industrial output dynamics improved well in August – from -2.6%Source: State Statistics Services, RBI/Raiffeisen RESEARCH Contributions to GDP by expenditures (pp) -15 -10 -5 0 5 10 15 Q2'16 Q3'16 Q4'16 Q1'17 Q2'17 Net exports Investments Government consumption Household consumption GDP, % yoy Source: State Statistics Services, RBI/Raiffeisen RESEARCH Contributions to GDP by sectors (pp) -4 -2 0 2 4 6 Q2'16 Q3'16 Q4'16 Q1'17 Q2'17 Trade Manufacturing Construction Mining Agriculture Energy Others GDP, % yoy * UKRAIN 7 3/4 09/01/27 Source: Bloomberg, RBI/Raiffeisen RESEARCH 10 year yield of Ukrainian Eurobond (%)* 7.0 7.5 8.0 8.5 9.0 9.5 10.0 10.5 11.0 Nov-15 Jan-16 Mar-16 May-16 Jul-16 Sep-16 Nov-16 Jan-17 Mar-17 May-17 Jul-17 Sep-17
- 3. 3 Pleasenotetherisknotificationsandexplanationsattheendofthisdocument Ukraine yoy in July to +1.2% yoy. In seasonally adjusted terms, industry showed an increase by 2.2% mom. Mining industry plunged by 6.8% yoy, but if compared to July, there was an improvement by 1.9% mom. Coal mining dropped by 24.8% yoy, which, as stated, was caused by the economic blockade of the Donbas (large coal mining region). Iron ores mining dropped by 3.1% yoy and oil/gas extraction fell by 2.3% yoy. On the other hand, manufacturing grew by 5.6% yoy (+2.6% mom). The leaders were chemical industry (+33% yoy), machinery (+10.4% yoy) and food production (+6% yoy). In contrast, coke production collapsed by 13.6% yoy because of the deteriorating supply from the mining industry. In turn, deficit of coal resulted in a decline in electricity production by thermal power plants. Thus, the energy production fell by 2.8% yoy, but still performed better than in July, with an improvement by +5.5% mom. In total, within January-August 2017, industrial output fell by 0.4% yoy, while in the same period last year it grew by 2.5% yoy. Retail sales dynamics improved in August – from +6.6% yoy to +9.7% yoy. As a result, we see 8.5% yoy growth in January-August 2017. In our view, the pension reform may provide an additional boost to retail sales, as soon as the first results of the reform would find their way to the consumers’ incomes. Inflation Seasonal decline in food prices resulted in a reduction of the Consumer Price Index (CPI) by 0.1% mom in August. However, annualized inflation growth rate accelerated a tad, from 15.9% yoy in July to 16.2% yoy due to base effect, as consumer prices dropped by 0.3% mom in August 2016. For the first time in 12 months, food prices declined (-0.6% mom) owing to a reduction in vegetable and fruit prices – by 21.5% mom and by 5.7% mom respectively. On the other hand, egg prices jumped by 18% mom because of a growing domestic market deficit (apparently, it was after the rise in exports to Europe following the scandal with poisoned eggs there). Alcohol and tobacco prices went up by 1.4% mom while prices for clothes fell by 2.4% mom on the back of seasonal sales and UAH revaluation. Communal payments increased by 0.3% mom in August due to a hike in tariffs for water supply (+1.7% mom), sewerage (+1.6% mom) and housing maintenance (+0.7% mom). Costs of transport services grew by 1.4% mom owing to increase in transportation fees by passenger road transport (+1.6% mom). Given the consumer prices dynamics in recent months, we see significant risks that the NBU target (8% +/-2 pp) could be missed this year. Thus, we change our inflation forecast from 9.5% yoy to 11% yoy eop in 2017. At the same time, we still expect inflation deceleration to 6.5% yoy in 2018. In August, producer prices went up by 0.4% mom. Mining industry was the major driver of growth (+4.7% mom) – prices in coal mining boosted by 6% mom, in iron ores mining by 6% mom and oil/gas extraction by 2.2% mom. As a result, prices in coke production and metallurgy grew by 2.9% mom and by 2.5% mom respectively. In addition, products of light industry became more expensive – by 3.6% mom. Generally, prices in manufacturing went up by 1.2% mom. Meanwhile, energy sector demonstrated price reduction by 3.7% mom due to lower tariffs for electricity (-4% mom). In August, growth of producer price index (PPI) accelerated from 23.3% yoy to 23.6% yoy. *Figures in parentheses are weights in the CPI basket in 2017 Source: State Statistics Services, RBI/Raiffeisen RESEARCH Contributions to CPI inflation* (pp) -10 0 10 20 30 40 50 60 70 Jan-15 Mar-15 May-15 Jul-15 Sep-15 Nov-15 Jan-16 Mar-16 May-16 Jul-16 Sep-16 Nov-16 Jan-17 Mar-17 May-17 Jul-17 Sep-17 Nov-17 Food and non-alcoholic beverages (42%) Alc./cig. (8%) Energy/utilities (8%) Transport (12%) Clothing (5%) Other components (25%) CPI inflation (% yoy) Source: State Statistics Services, RBI/Raiffeisen RESEARCH Industrial output growth by sector (% yoy) 2.5 0.1 4.1 0.8 1.2 2.8 2.3 14.4 2.7 6.2 9.9 8.9 0.3 -0.4 -6.5 3.8 -5.9 4.8 7.0 3.3-17.1 5.6 1.1 6.4 -2.2 8.1 -20 -10 0 10 20 Industrial production Mining Manufacuring (all) Utilities of manufacturing: Food Light industry Woodwork and paper Coke, refined products Chemical Pharmaceutical products Rubber, plastic and mineral… Metallurgy Machine building Jan-Aug 2016 to Jan-Aug 2015 Jan-Aug 2017 to Jan-Aug 2016 Source: State Statistics Services, RBI/Raiffeisen RESEARCH Inflation dynamics (% yoy) -10 0 10 20 30 40 50 60 70 Jan-12 Apr-12 Jul-12 Oct-12 Jan-13 Apr-13 Jul-13 Oct-13 Jan-14 Apr-14 Jul-14 Oct-14 Jan-15 Apr-15 Jul-15 Oct-15 Jan-16 Apr-16 Jul-16 Oct-16 Jan-17 Apr-17 Jul-17 CPI Food prices PPI
- 4. 4 Pleasenotetherisknotificationsandexplanationsattheendofthisdocument Ukraine Balance of Payments The Current Account (C/A) deficit contracted from USD 597 mn in July to USD 226 mn in August on the back of improving exports dynamics. Growth of goods’ export (in current prices) accelerated from 9.3% yoy to 12.8% yoy. Food exports increased by 17.5% yoy (+11.2% yoy in July) due to relatively high global prices and improved relations with some trade partners. High global prices and increased production pushed metallurgical exports up to 8.1% yoy (after +1.9% yoy previous month). By contrast, merchandise imports dynamics deteriorated in August (from +22% yoy to +10.4% yoy). Growth in imports of mineral products slowed down from 53.2% yoy to 32.7% yoy owing to the base effect – Ukraine intensified gas purchases in August 2016. Given the lower demand, imports of machinery products posted a 13.6% yoy growth in August, down from +28.6% yoy in the previous month. Imports of chemical products showed deteriorated growth dynamics too – from +16.7% yoy to +10.6% yoy. As a result, trade balance of goods posted a deficit of USD 874 mn. On the other hand, trade balance of services recorded a surplus of USD 309 mn (USD 181 mn in July) given high gas transit. Financial account showed a surplus of USD 743 mn in August (USD 305 mn in July). FDI inflow accelerated from USD 137 mn to USD 194 mn, and the lion’s share of it was directed to the real sector. Foreign currency outside the banking sector declined by USD 496 mn. Moreover, FX assets of banking sector fell by USD 300 mn due to the placement of foreign currency (FCY) government bonds in the domestic market. As a result, the Balance of Payments (BoP) recorded a surplus of USD 518 mn. In January-August 2017, the C/A deficit reached USD 2.1 bn which is USD 0.3 bn higher than in Jan-Aug 2016. Good’s export increased by 21% yoy, and imports rose by 22.1% yoy. Meanwhile, the Financial Account collected USD 3.4 bn. Thus, the BoP was reduced with a surplus of USD 1.3 bn in Jan- Aug. Monetary Policy and Exchange Rate Step-by-step Ukrainian hryvnia loses its value on the back of seasonal factor and deterioration of devaluation expectations. By the end of September, USD/UAH rate crossed the level of 26.60. From time to time, the regulator intervened the market in order to reduce volatility. Thus, the National Bank of Ukraine (NBU) sold USD 96.6 mn at the auctions. Despite the upward trending USD/UAH rate, we improved our forecast for the year- end 2017 from 28.00 to 27.00 on the back of strengthening of Ukraine’s financial stability after successful Eurobond release and restoration of FX reserves. Gross international reserves (GIR) reached the highest level since the early 2014, of USD 18 bn. There were two major sources of reserves replenishment in August. First, there were attracted USD 351.5 mn from the placement of FCY domestic bonds. Second, the NBU bought USD 234 mn from the market, in the frame of excess FCY supply. The major outflow was due to debt payments of USD 498.8 mn (USD 448.7 mn to IMF). As we expect the next IMF tranche to arrive before the end of 2017, we see the GIR to have a boost to the level of USD 20 bn by the end of 2017. The reduction of banking sector liquidity halted in September. In late-September, about UAH 5 bn returned to the market, and significant share Source: National Bank of Ukraine, RBI/Raiffeisen RESEARCH Balance of Payments (USD bn) -2 -1 0 1 2 Aug-15 Oct-15 Dec-15 Feb-16 Apr-16 Jun-16 Aug-16 Oct-16 Dec-16 Feb-17 Apr-17 Jun-17 Aug-17Current Account Financial Account Capital Account Balance of Payments Source: National Bank of Ukraine, RBI/Raiffeisen RESEARCH Gross international reserves 2 4 6 8 10 12 14 16 18 20 -3,500 -3,000 -2,500 -2,000 -1,500 -1,000 -500 0 500 1,000 Jun-14 Sep-14 Dec-14 Mar-15 Jun-15 Sep-15 Dec-15 Mar-16 Jun-16 Sep-16 Dec-16 Mar-17 Jun-17 USD mn USD bn NBU interventions/auctions Gross FX reserves, r.h.s. Source: National Bank of Ukraine, RBI/Raiffeisen RESEARCH Official USD/UAH rate 23.00 23.50 24.00 24.50 25.00 25.50 26.00 26.50 27.00 27.50 28.00 Jan Feb Mar Apr May Jun Jul Aug Sep Oct Nov Dec 2016 2017
- 5. 5 Pleasenotetherisknotificationsandexplanationsattheendofthisdocument Ukraine of liquidity moved from correspondent accounts to Certificate of Deposits (CDs). As a result, the balances on correspondent accounts dropped to UAH 42-43 bn, while CDs grew to UAH 38-39 bn. The money market rates went down on the back of stabilized UAH liquidity. Index of interbank rates (overnight) declined by about 50 bp to 11%. Growing risks for price stability forced the NBU to keep the key policy rate at 12.5% on 14 September. According to the regulator, inflation moves above the expected trajectory, and “the 2017 year-end inflation is projected to deviate more significantly from the mid-point of the target range (8% ± 2 pp for end-2017)”. The NBU sees the major risk for price stability in hike of budget spending and pension payments. Growing inflationary pressure may push the regulator to a tighter monetary policy and raise its key policy rate, we think. Banking Sector UAH deposits declined in August owing to seasonal factor. Household (PI) deposits in local currency (LCY) declined by 0.3% mom. UAH deposits of corporate sector (CO) dropped by 2.8% mom on the back of significant quarterly tax payments. By contrast, FCY savings went up in August – business increased its deposit portfolio by 1.8% mom, households’ portfolio went up by 0.6% mom. LCY lending continued to recover. CO LCY loans hiked by 1.3% mom, PI LCY loans increased by 4.1% mom. On the other hand, private individuals reduced their FCY debt by 1.3% mom. CO FCY portfolio remained at the level of July. In Jan-Aug, banking sector showed positive financial result of UAH 3.4 bn on the back of lower interest spending and provision costs. The non-performing loans (NPL) ratio stays very high in – at 56.9% in August. Government banks still has the worst loan portfolio – 71.6% of “bad” loans (mainly due to Privatbank that has 86.3% NPL ratio). NPL of foreign banks amounted to 47.1%, private Ukrainian banks – 25.6% (the latter occupy the smallest market share of total banking sector assets – 12.5%). Source: National Bank of Ukraine, RBI/Raiffeisen RESEARCH CO loans indexes, Dec-13 = 100 0 20 40 60 80 100 120 Dec-13 Mar-14 Jun-14 Sep-14 Dec-14 Mar-15 Jun-15 Sep-15 Dec-15 Mar-16 Jun-16 Sep-16 Dec-16 Mar-17 Jun-17 LCY CO loans FCY CO loans Source: National Bank of Ukraine, RBI/Raiffeisen RESEARCH PI loans indexes, Dec-13 = 100 0 20 40 60 80 100 120 Dec-13 Mar-14 Jun-14 Sep-14 Dec-14 Mar-15 Jun-15 Sep-15 Dec-15 Mar-16 Jun-16 Sep-16 Dec-16 Mar-17 Jun-17 LCY PI loans FCY PI loans
- 6. 6 Pleasenotetherisknotificationsandexplanationsattheendofthisdocument Ukraine Risk notifications and explanations Warnings Figures on performance refer to the past. Past performance is not a reliable indicator for future results and the development of a financial instrument, a financial index or a securities service. This is particularly true in cases when the financial instrument, financial index or securities service has been offered for less than 12 months. In particular, this very short comparison period is not a reliable indicator for future results. Performance of a financial instrument, a financial index or a securities service is reduced by commissions, fees and other charges, which depend on the individual circumstances of the investor. The return on an investment in a financial instrument, a financial or securities service can rise or fall due to exchange rate fluctuations. Forecasts of future performance are based purely on estimates and assumptions. Actual future performance may deviate from the forecast. Consequently, forecasts are not a reliable indicator for future results and the development of a financial instrument, a financial index or a securities service. Any information and recommendations designated as such in this publication which are contributed by analysts from RBI’s subsidiary banks or from Raiffeisen Centrobank (“RCB”) are disseminated unaltered under RBI’s responsibility. A description of the concepts and methods used in the preparation of financial analyses is available under: www.raiffeisenresearch.com/concept_and_methods Detailed information on sensitivity analyses (procedure for checking the stability of potential assumptions made in the context of financial analyses) is available under: www.raiffeisenresearch.com/sensitivity_analysis Disclaimer Financial Analysis Responsible for this publication: Raiffeisen Bank International AG („RBI“) RBI is a credit institution according to §1 Banking Act (Bankwesengesetz) with the registered office Am Stadtpark 9, 1030 Vienna, Austria. Raiffeisen RESEARCH is an organisational unit of RBI. Supervisory authority: As a credit institution (acc. to § 1 Austrian Banking Act; Bankwesengesetz) Raiffeisen Bank International AG is subject to the supervision by the Austrian Financial Market Authority (FMA, Finanzmarktaufsicht) and the National Bank of Austria (OeNB, Oesterreichische Nationalbank). Additionally, RBI is subject to the supervision by the European Central Bank (ECB), which undertakes such supervision within the Single Supervisory Mechanism (SSM), which consists of the ECB and the national responsible authorities (Council Regulation (EU) No 1024/2013 - SSM Regulation). Unless set out herein explicitly otherwise, references to legal norms refer to norms enacted by the Republic of Austria. This document is for information purposes and may not be reproduced or distributed to other persons without RBI’s permission. This document constitutes neither a solicitation of an offer nor a prospectus in the sense of the Austrian Capital Market Act (Kapitalmarktgesetz) or the Austrian Stock Exchange Act (Börsegesetz) or any other comparable foreign law. An investment decision in respect of a financial instrument, a financial product or an investment (all hereinafter “product”) must be made on the basis of an approved, published prospectus or the complete documentation for such a product in question, and not on the basis of this document. This document does not constitute a personal recommendation to buy or sell financial instruments in the sense of the Austrian Securities Supervision Act (Wertpapieraufsichtsgesetz). Neither this document nor any of its components shall form the basis for any kind of contract or commitment whatsoever. This document is not a substitute for the necessary advice on the purchase or sale of a financial instrument, a financial product or advice on an investment. In respect of the sale or purchase of one of the above mentioned products, your banking advisor can provide individualised advice suitable for investments and financial products. This analysis is fundamentally based on generally available information and not on confidential information which the party preparing the analysis has obtained exclusively on the basis of his/her client relationship to a person. Unless otherwise expressly stated in this publication, RBI deems all of the information to be reliable, but does not make any assurances regarding its accuracy and completeness. In emerging markets, there may be higher settlement and custody risk as compared to markets with established infrastructure. The liquidity of stocks/financial instruments may be influenced, amongst others, by the number of market makers. Both of these circumstances can result in elevated risk in relation to the safety of investments made in consideration of the information contained in this document. The information in this publication is current as per the latter's creation date. It may be outdated by future developments, without the publication being changed. Unless otherwise expressly stated (www.raiffeisenresearch.com/special_compensation) the analysts employed by RBI are not compensated for specific investment banking transactions. Compensation of the author or authors of this report is based (amongst other things) on the overall profitability of RBI, which includes, inter alia, earnings from investment banking and other transactions of RBI. In general, RBI forbids its analysts and persons reporting to the analysts from acquiring securities or other financial instruments of any enterprise which is covered by the analysts, unless such acquisition is authorised in advance by RBI’s Compliance Department. RBI has put in place the following organisational and administrative agreements, including information barriers, to impede or prevent conflicts of interest in relation to recommendations: RBI has designated fundamentally binding confidentiality zones. These are typically units within credit institutions, which are isolated from other units by organisational measures governing the exchange of information, because compliance-relevant information is continuously or temporarily handled in these zones. Compliance-relevant information may fundamentally not leave a confidentiality zone and is to be treated as strictly confidential in internal business operations, including interaction with other units. This does not apply to the transfer of information necessary for usual business operations. Such transfer of information is limited, however, to what is absolutely necessary
- 7. 7 Pleasenotetherisknotificationsandexplanationsattheendofthisdocument Ukraine (need-to-know principle). The exchange of compliance-relevant information between two confidentiality zones may only occur with the involvement of the Compliance Officer. SPECIAL REGULATIONS FOR THE UNITED KINGDOM OF GREAT BRITAIN AND NORTHERN IRELAND (UK): This document does not constitute either a public offer in the meaning of the Austrian Capital Market Act (Kapitalmarktgesetz; hereinafter „KMG“) nor a prospectus in the meaning of the KMG or of the Austrian Stock Exchange Act (Börsegesetz). Furthermore, this document does not intend to recommend the purchase or the sale of securities or investments in the meaning of the Austrian Supervision of Securities Act (Wertpapieraufsichtsgesetz). This document shall not replace the necessary advice concerning the purchase or the sale of securities or investments. For any advice concerning the purchase or the sale of securities of investments kindly contact your RAIFFEISENBANK. This publication has been either approved or issued by RBI in order to promote its investment business. Raiffeisen Bank International AG (“RBI”), London Branch is authorised by the Austrian Financial Market Authority and subject to limited regulation by the Financial Conduct Authority (“FCA”). Details about the extent of its regulation by the FCA are available on request. This publication is not intended for investors who are Retail Customers within the meaning of the FCA rules and shall therefore not be distributed to them. Neither the information nor the opinions expressed herein constitute or are to be construed as an offer or solicitation of an offer to buy (or sell) investments. RBI may have affected an Own Account Transaction within the meaning of FCA rules in any investment mentioned herein or related investments and/or may have a position or holding in such investments as a result. RBI may have been, or might be, acting as a manager or co-manager of a public offering of any securities mentioned in this report or in any related security. SPECIFIC RESTRICTIONS FOR THE UNITED STATES OF AMERICA AND CANADA: This document may not be transmitted to, or distributed within, the United States of America or Canada or their respective territories or possessions, nor may it be distributed to any U.S. person or any person resident in Canada, unless it is provided directly through RB International Markets (USA) LLC (“RBIM”), a U.S. registered broker-dealer, and subject to the terms set forth below. SPECIFIC INFORMATION FOR THE UNITED STATES OF AMERICA AND CANADA: This research document is intended only for institutional investors and is not subject to all of the independence and disclosure standards that may be applicable to research documents prepared for retail investors. This report was provided to you by RB International Markets (USA) LLC (RBIM), a U.S. registered broker-dealer, but was prepared by our non-U.S. affiliate Raiffeisen Bank International AG (RBI). Any order for the purchase or sale of securities covered by this report must be placed with RBIM. You can reach RBIM at 1177, Avenue of the Americas, 5th floor, New York, NY 10036, phone +1 212-600-2588. This document was prepared outside the United States by one or more analysts who may not have been subject to rules regarding the preparation of reports and the independence of research analysts comparable to those in effect in the United States. The analyst or analysts who prepared this research (i) are not registered or qualified as research analysts with the Financial Industry Regulatory Authority (“FINRA”) in the United States, and (ii) are not allowed to be associated persons of RBIM and are therefore not subject to FINRA regulations, including regulations related to the conduct or independence of research analysts. The opinions, estimates and projections contained in this report are those of RBI only as of the date of this report and are subject to change without notice. The information contained in this report has been compiled from sources believed to be reliable by RBI, but no representation or warranty, express or implied, is made by RBI or its affiliated companies or any other person as to the report’s accuracy, completeness or correctness. Securities which are not registered in the United States may not be offered or sold, directly or indirectly, within the United States or to U.S. persons (within the meaning of Regulation S under the Securities Act of 1933 [“the Securities Act”]), except pursuant to an exemption under the Securities Act. This report does not constitute an offer with respect to the purchase or sale of any security within the meaning of Section 5 of the Securities Act and neither shall this report nor anything contained herein form the basis of, or be relied upon in connection with, any contract or commitment whatsoever. This report provides general information only. In Canada it may only be distributed to persons who are resident in Canada and who, by virtue of their exemption from the prospectus requirements of the applicable provincial or territorial securities laws, are entitled to conduct trades in the securities described herein. EU REGULATION NO 833/2014 CONCERNING RESTRICTIVE MEASURES IN VIEW OF RUSSIA’S ACTIONS DESTABILISING THE SITUATION IN UKRAINE Please note that research is done and recommendations are given only in respect of financial instruments which are not affected by the sanctions under EU regulation no 833/2014 concerning restrictive measures in view of Russia's actions destabilising the situation in Ukraine, as amended from time to time, i.e. financial instruments which have been issued before 1 August 2014. We wish to call to your attention that the acquisition of financial instruments with a term exceeding 30 days issued after 31 July 2014 is prohibited under EU regulation no 833/2014 concerning restrictive measures in view of Russia's actions destabilising the situation in Ukraine, as amended from time to time. No opinion is given with respect to such prohibited financial instruments. INFORMATION REGARDING THE PRINCIPALITY OF LIECHTENSTEIN: COMMISSION DIRECTIVE 2003/125/EC of 22 December 2003 implementing Directive 2003/6/EC of the European Parliament and of the Council as regards the fair presentation of investment recommendations and the disclosure of conflicts of interest has been incorporated into national law in the Principality of Liechtenstein by the Finanzanalyse- Marktmissbrauchs-Verordnung. If any term of this Disclaimer is found to be illegal, invalid or unenforceable under any applicable law, such term shall, insofar as it is severable from the remaining terms, be deemed omitted from this Disclaimer. It shall in no way affect the legality, validity or enforceability of the remaining terms.
- 8. 8 Pleasenotetherisknotificationsandexplanationsattheendofthisdocument Ukraine Acknowledgements This report was prepared by Raiffeisen Bank Aval on 6 October 2017 Raiffeisen Bank Aval 9, Leskova Str., 01011 Kyiv, Ukraine Tel. +380 44 490 8888 Fax +380 44 285 32 31 Call center: 0 800 500 500 (free within Ukraine) www.aval.ua Market Analysis Sergii Drobot (+380 44 590 5621) Treasury Head: Vladimir Kravchenko (+380 44 4908808) FX, MM: Yuriy Grinenko (+380 44 4908988), Olexandr Varenytsia (+380 44 4954227), Nikolay Vysotsky (+380 44 4954226) Treasury Sales: Marina Lukashenko (+380 44 4954202), Alexander Korenev (+380 44 4954200), Tatiana Kornienko (+380 44 4954201) Securities: Oleg Klimas (+380 44 4908939), Alexey Evdokimov (+380 44 4954206), Daria Shatskykh (+380 44 4954204) Multinational Corporate Customers Head: Andreas Kettlgruber (+380 44 4954110) Relationship Managers: Anna Prydybailo (+380 44 2309981), Lesia Byba (+380 44 4954271) Raiffeisen Bank International CEE Research Team GLOBAL HEAD OF RESEARCH, RBI Peter Brezinschek (1517, FA*) HEAD OF ECONOMICS / FIXED INCOME /FX RESEARCH, RBI VIENNA Gunter Deuber (5707, FA*) CEE MACRO, FX AND FIXED INCOME, RBI VIENNA Wolfgang Ernst (FX Strategist, 1500, FA*) Stephan Imre (FI Strategist, 6757, FA*) Patrick Krizan (FI Strategist, 5644, FA*) Matthias Reith (Economist, 6741, FA*) Elena Romanova (Banking sector, 1378, FA*) Andreas Schwabe (Economist, 1389, FA*) Gintaras Shlizyhus (FI Strategist, 1343, FA*) CEE CREDIT COMPANY RESEARCH, RBI VIENNA Jörg Bayer (Head, 1909, FA*) Martin Kutny (Corporates, 2013, FA*) Ruslan Gadeev (RU Financials, 2216, FA*) RBI contacts: +43 1 71707 (+ extension); [name].[surname]@rbinternational.com *FA: Financial Analyst RBI NETWORK BANK CEE RESEARCH CENTRAL EUROPE (CE) CZ: Helena Horska (+420 234 40 1413, FA*), Raiffeisenbank a.s., Prague HU: Zoltán Török (+36 1 484 4843, FA*), Raiffeisen Bank Zrt., Budapest PL: Dorota Strauch (+48 22 585 2461, FA*), Raiffeisen Polbank, Warsaw SK: Robert Prega (+421 2 5919 1303, FA*), Tatra banka, a.s., Bratislava SOUTH EAST EUROPE (SEE) AL: Joan Canaj (+355 4 238 1000 1122, FA*), Raiffeisen Bank Sh.a., Tirana BA: Ivona Zametica; (+387 33 287 784, FA*), Raiffeisen BANK d.d., Sarajevo BG: Emil Kalchev (+359 2 91985 101, FA*), Raiffeisenbank (Bulgaria, FA*) Sole-owned JSC, Sofia HR: Zrinka Zivkovic-Matijevic (+385 1 6174 338, FA*), Raiffeisenbank Austria d.d., Zagreb RO: Ionut Dumitro (+40-730-222-953, FA*), Raiffeisen Bank S.A., Bucharest RS: Ljiljana Grubic (+381 11 2207178, FA*), Raiffeisenbank a.d., Belgrade EASTERN EUROPE (EE) BY: Natalya Chernogorova +375 17 289 9231, FA*), Priorbank JSC, Minsk RU: Anastasia Baykova (+7 495 225 9114, FA*), AO Raiffeisenbank Austria, Moscow UA: Sergii Drobot (+380 44 5905621, FA*), Raiffeisen Bank Aval , Kyiv COMPANY EQUITY RESEARCH: RAIFFEISEN CENTROBANK AG, VIENNA Bernd Maurer (Head, +43 1 51520-706, FA*)