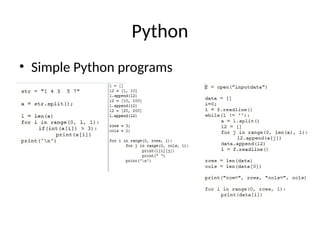
Python
• An objectoriented interpreter-based programming
language
• Basic essentials
– Data types are numbers, strings, lists, and dictionaries
(hash-tables)
– For loops and conditionals
– Functions
– Lists and hash-tables are references (like pointers in C)
– All variables are passed by value
Data science
• Datascience
– Simple definition: reasoning and making decisions from data
– Contains machine learning, statistics, algorithms,
programming, big data
• Basic machine learning problems
– Classification
• Linear methods
• Non-linear
– Feature selection
– Clustering (unsupervised learning)
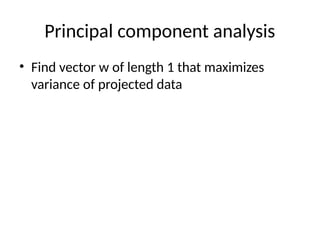
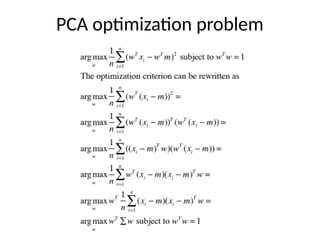
– Visualization with PCA
5.
Python scikit-learn
• Popularmachine learning toolkit in Python
http://scikit-learn.org/stable/
• Requirements
– Anaconda
– Available from
https://www.continuum.io/downloads
– Includes numpy, scipy, and scikit-learn (former two
are necessary for scikit-learn)
6.
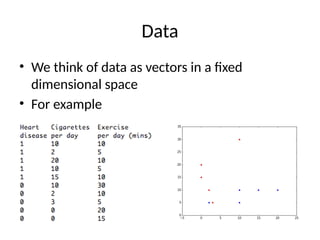
Data
• We thinkof data as vectors in a fixed
dimensional space
• For example
7.
Classification
• Widely usedtask: given data determine the
class it belongs to. The class will lead to a
decision or outcome.
• Used in many different places:
– DNA and protein sequence classification
– Insurance
– Weather
– Experimental physics: Higgs Boson determination
8.
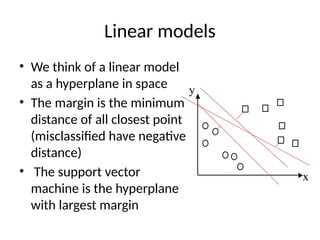
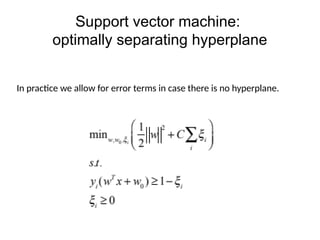
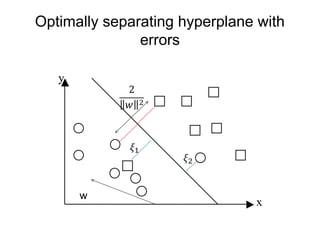
Linear models
• Wethink of a linear model
as a hyperplane in space
• The margin is the minimum
distance of all closest point
(misclassified have negative
distance)
• The support vector
machine is the hyperplane
with largest margin
y
x
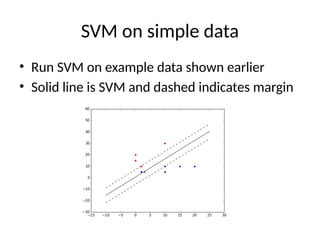
SVM on simpledata
• Run SVM on example data shown earlier
• Solid line is SVM and dashed indicates margin
12.
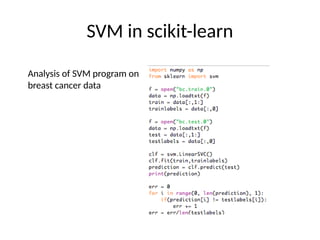
SVM in scikit-learn
•Dataset are taken from the UCI machine
learning repository
• Learn an SVM model on training data
• Which parameter settings?
– C: tradeoff between error and model complexity
(margin)
– max_iter: depth of the gradient descent algorithm
• Predict on test data
Non-linear classification
• Inpractice some datasets may not be classifiable.
• Remember this may not be a big deal because the
test error is more important than the train one
15.
Non-linear classification
• Neuralnetworks
– Create a new representation of the data where it
is linearly separable
– Large networks leads to deep learning
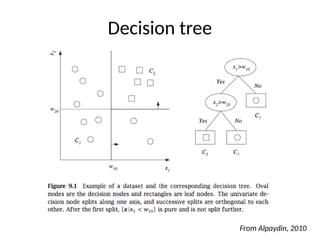
• Decision trees
– Use several linear hyperplanes arranged in a tree
– Ensembles of decision trees are state of the art
such as random forest and boosting
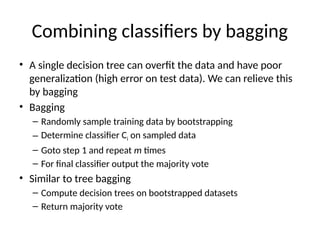
Combining classifiers bybagging
• A single decision tree can overfit the data and have poor
generalization (high error on test data). We can relieve this
by bagging
• Bagging
– Randomly sample training data by bootstrapping
– Determine classifier Ci on sampled data
– Goto step 1 and repeat m times
– For final classifier output the majority vote
• Similar to tree bagging
– Compute decision trees on bootstrapped datasets
– Return majority vote
18.
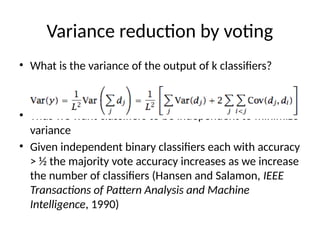
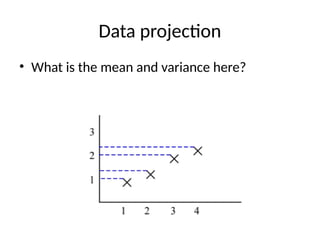
Variance reduction byvoting
• What is the variance of the output of k classifiers?
• Thus we want classifiers to be independent to minimize
variance
• Given independent binary classifiers each with accuracy
> ½ the majority vote accuracy increases as we increase
the number of classifiers (Hansen and Salamon, IEEE
Transactions of Pattern Analysis and Machine
Intelligence, 1990)
19.
Random forest
• Inaddition to sampling datapoints (feature
vectors) we also sample features (to increase
independence among classifiers)
• Compute many decision trees and output
majority vote
• Can also rank features
• Alternative to bagging is to select datapoints
with different probabilities that change in the
algorithm (called boosting)
20.
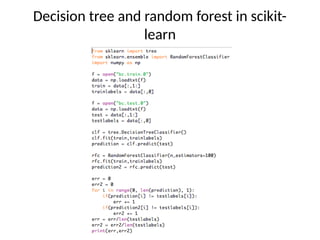
Decision tree andrandom forest in scikit-
learn
• Learn a decision tree and random forest on
training data
• Which parameter settings?
– Decision tree:
• Depth of tree
– Random forest:
• Number of trees
• Percentage of columns
• Predict on test data
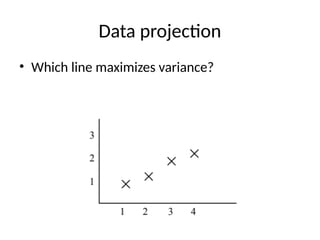
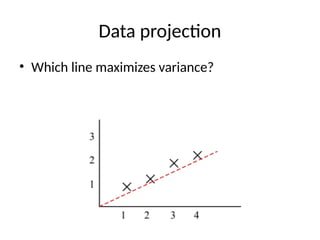
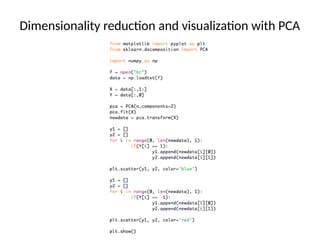
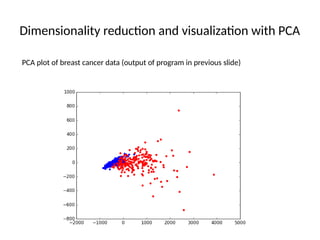
Dimensionality reduction andvisualization with PCA
PCA plot of breast cancer data (output of program in previous slide)
29.
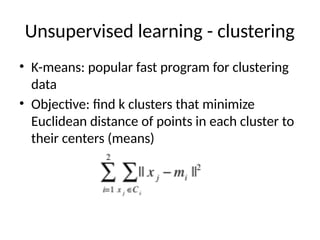
Unsupervised learning -clustering
• K-means: popular fast program for clustering
data
• Objective: find k clusters that minimize
Euclidean distance of points in each cluster to
their centers (means)
30.
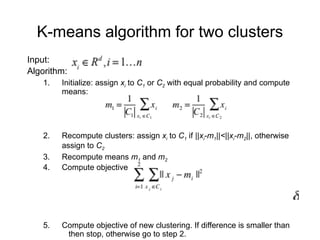
K-means algorithm fortwo clusters
Input:
Algorithm:
1. Initialize: assign xi to C1 or C2 with equal probability and compute
means:
2. Recompute clusters: assign xi to C1 if ||xi-m1||<||xi-m2||, otherwise
assign to C2
3. Recompute means m1 and m2
4. Compute objective
5. Compute objective of new clustering. If difference is smaller than
then stop, otherwise go to step 2.
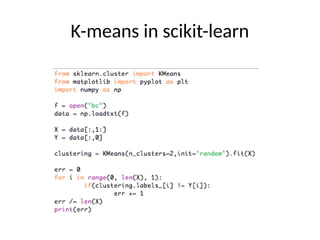
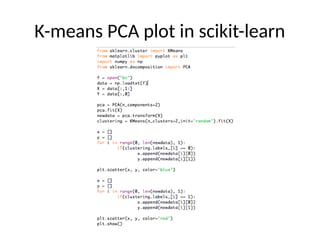
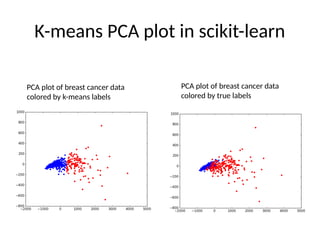
K-means PCA plotin scikit-learn
PCA plot of breast cancer data
colored by true labels
PCA plot of breast cancer data
colored by k-means labels
34.
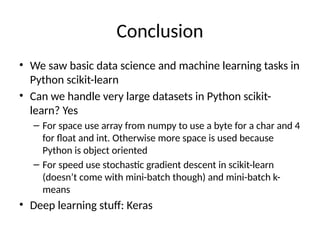
Conclusion
• We sawbasic data science and machine learning tasks in
Python scikit-learn
• Can we handle very large datasets in Python scikit-
learn? Yes
– For space use array from numpy to use a byte for a char and 4
for float and int. Otherwise more space is used because
Python is object oriented
– For speed use stochastic gradient descent in scikit-learn
(doesn’t come with mini-batch though) and mini-batch k-
means
• Deep learning stuff: Keras