Download to read offline

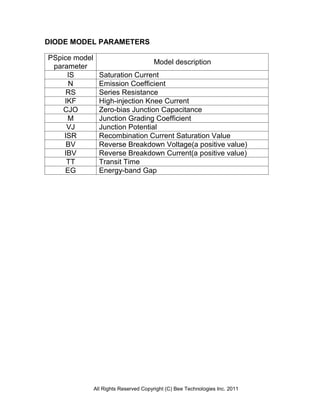
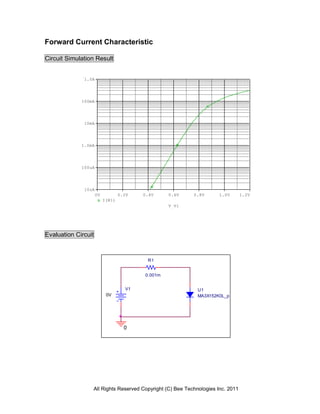
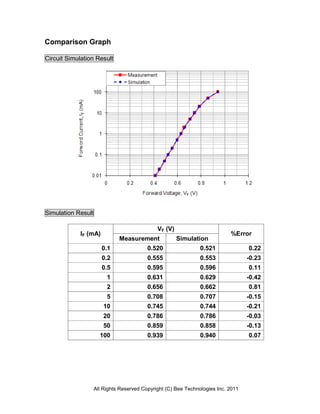
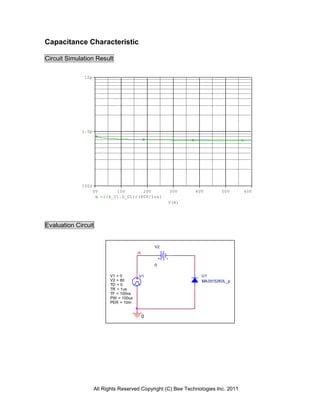
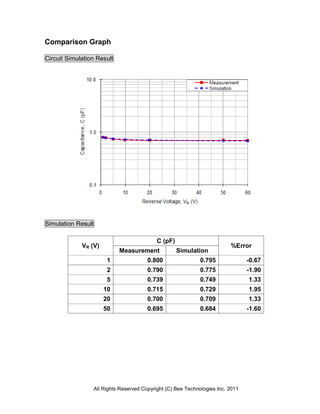
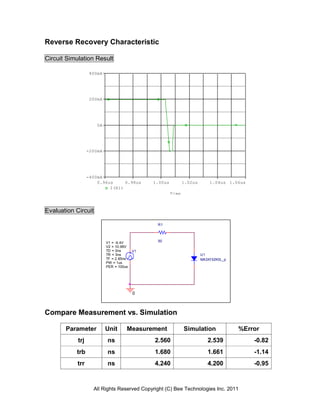
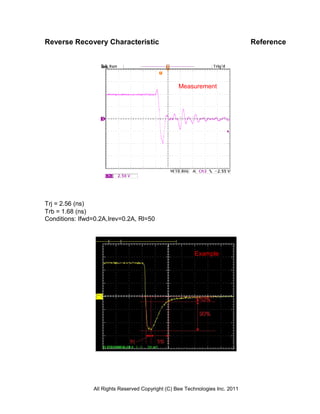

The document presents a device modeling report for the MA3X152K0L diode from Panasonic Bee Technologies Inc., detailing model parameters including saturation current, series resistance, and reverse breakdown voltage. It includes circuit simulation results for forward current characteristics, capacitance characteristics, and reverse recovery characteristics, with measurement comparisons highlighting simulation accuracy. All rights to the document are reserved by the manufacturer.


