Download to read offline


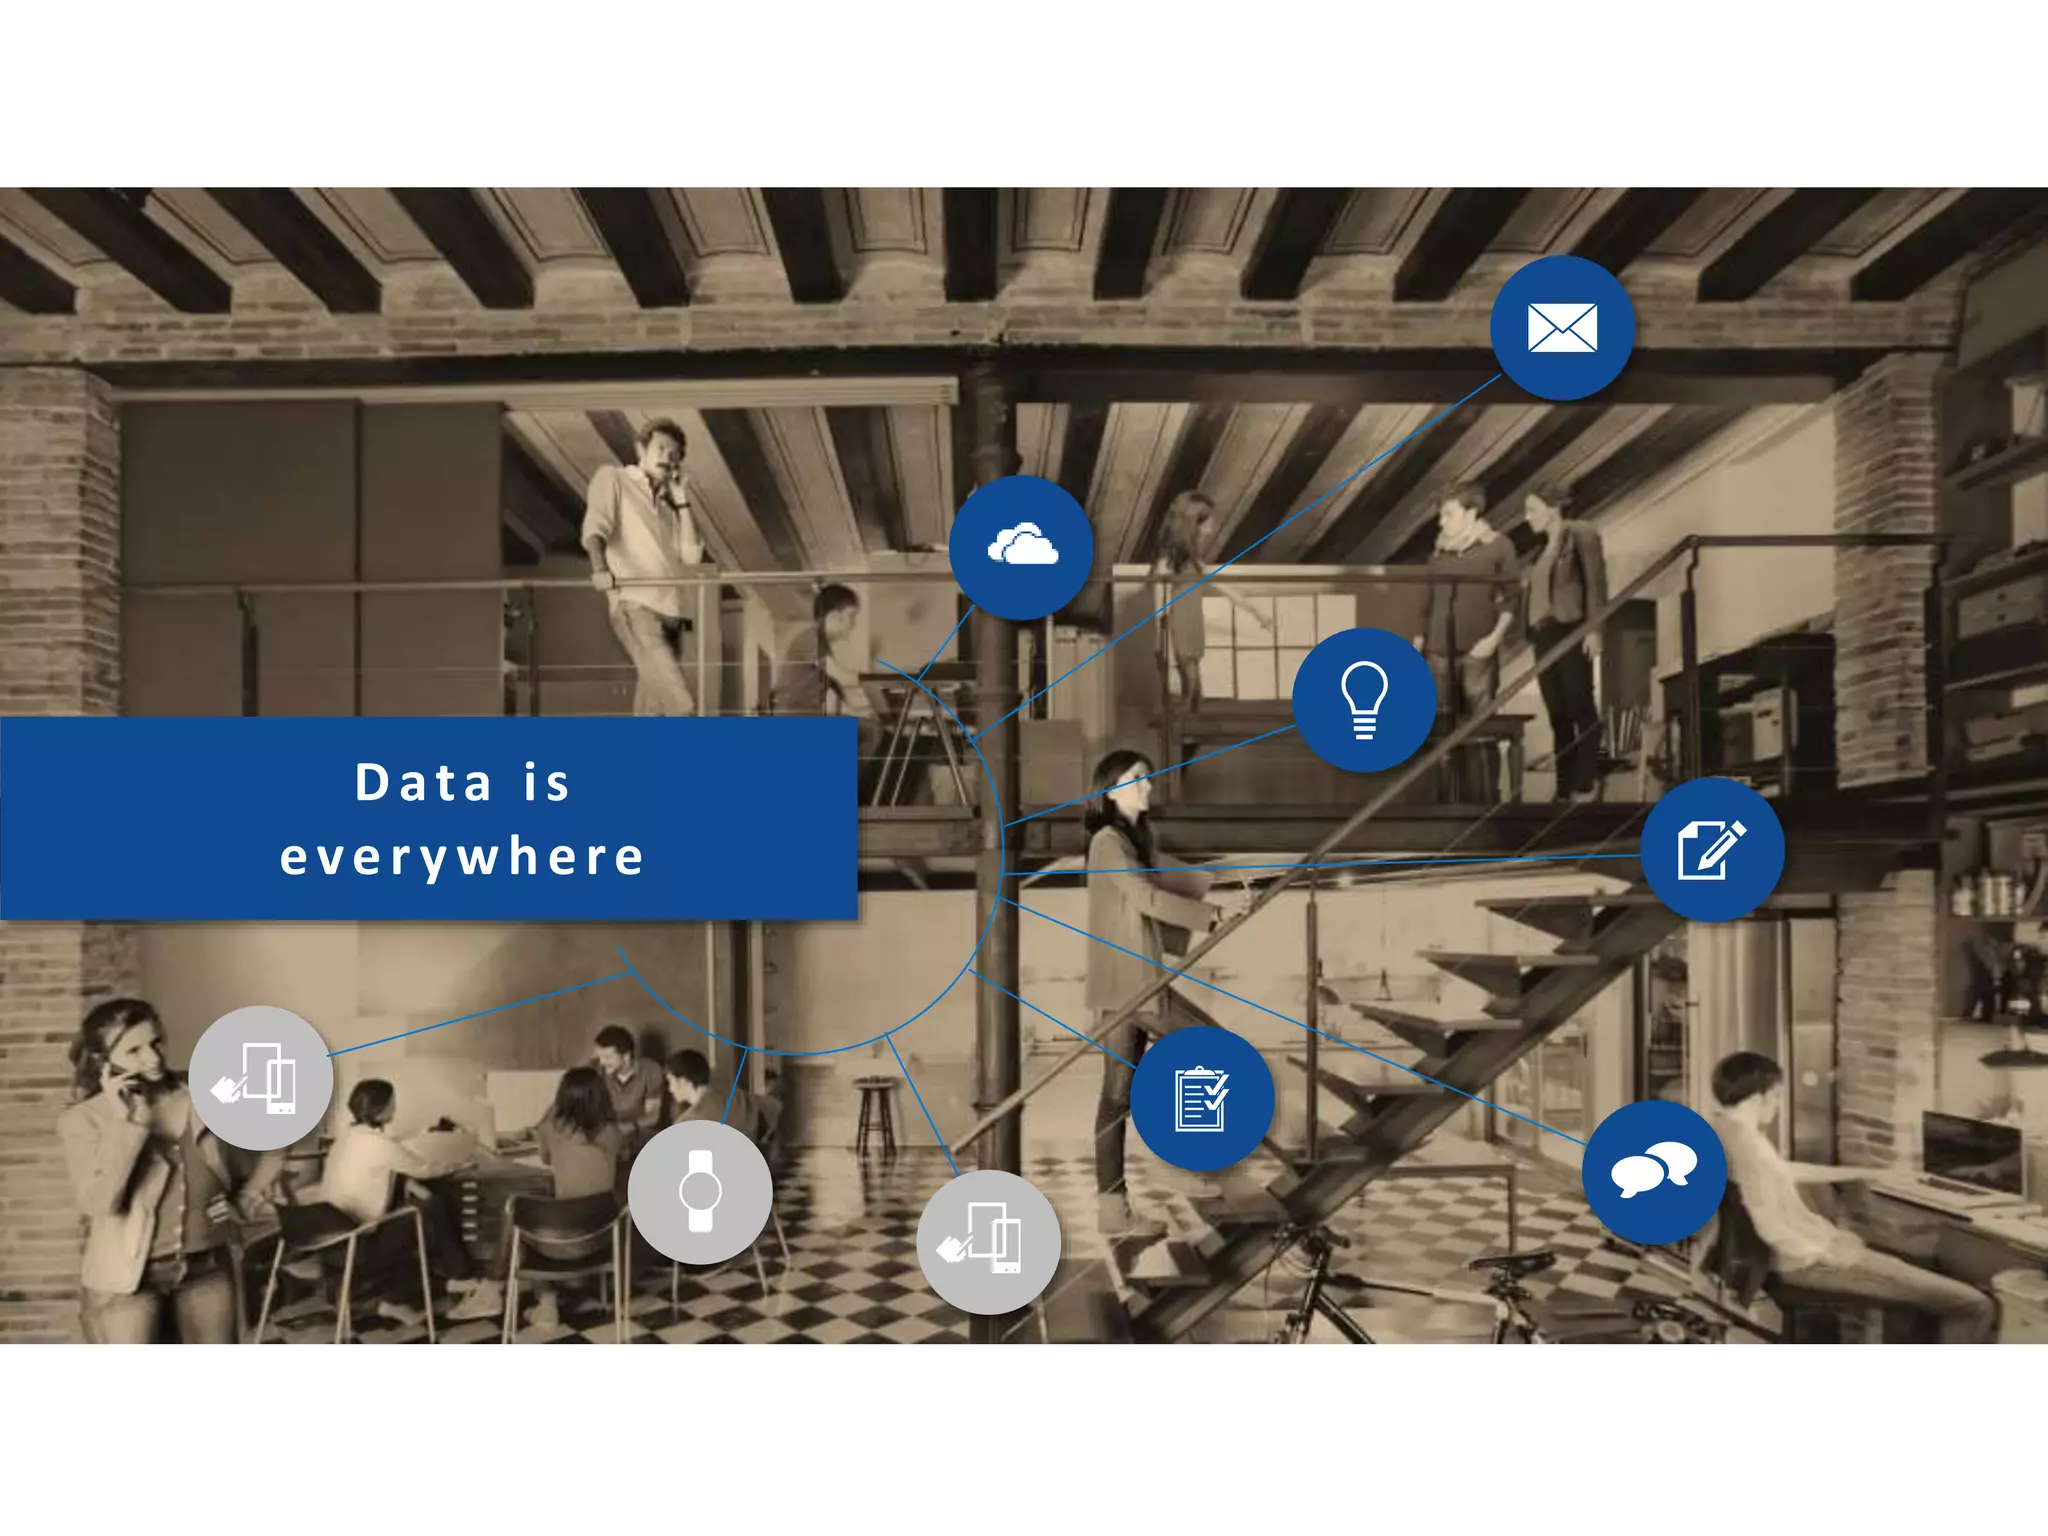
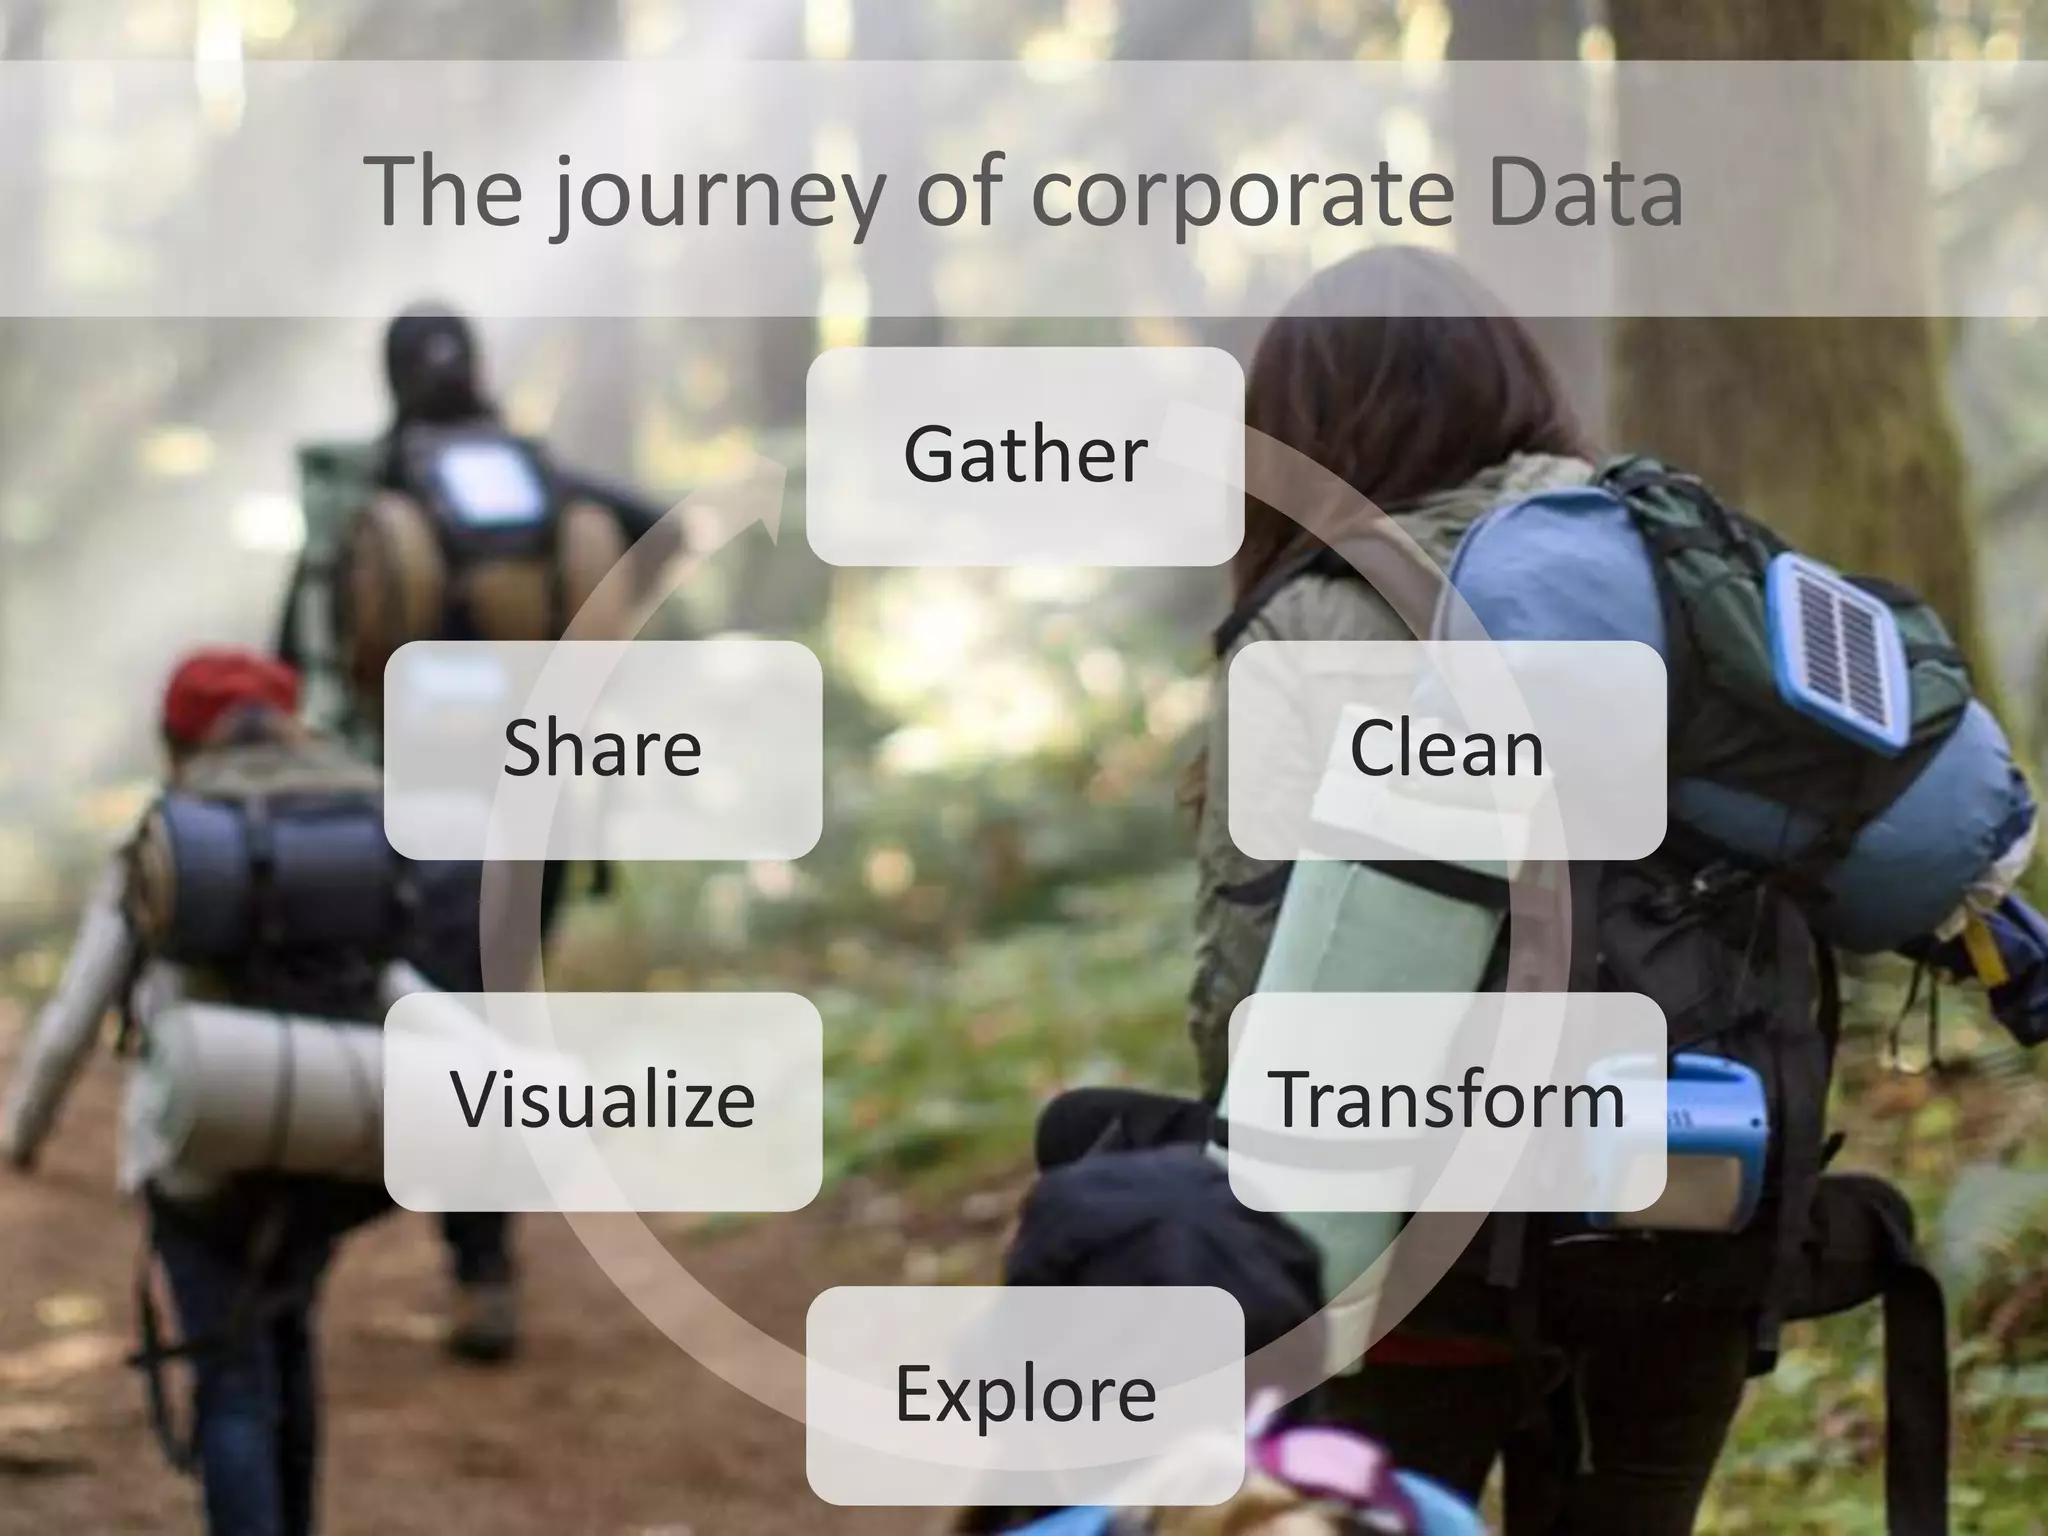


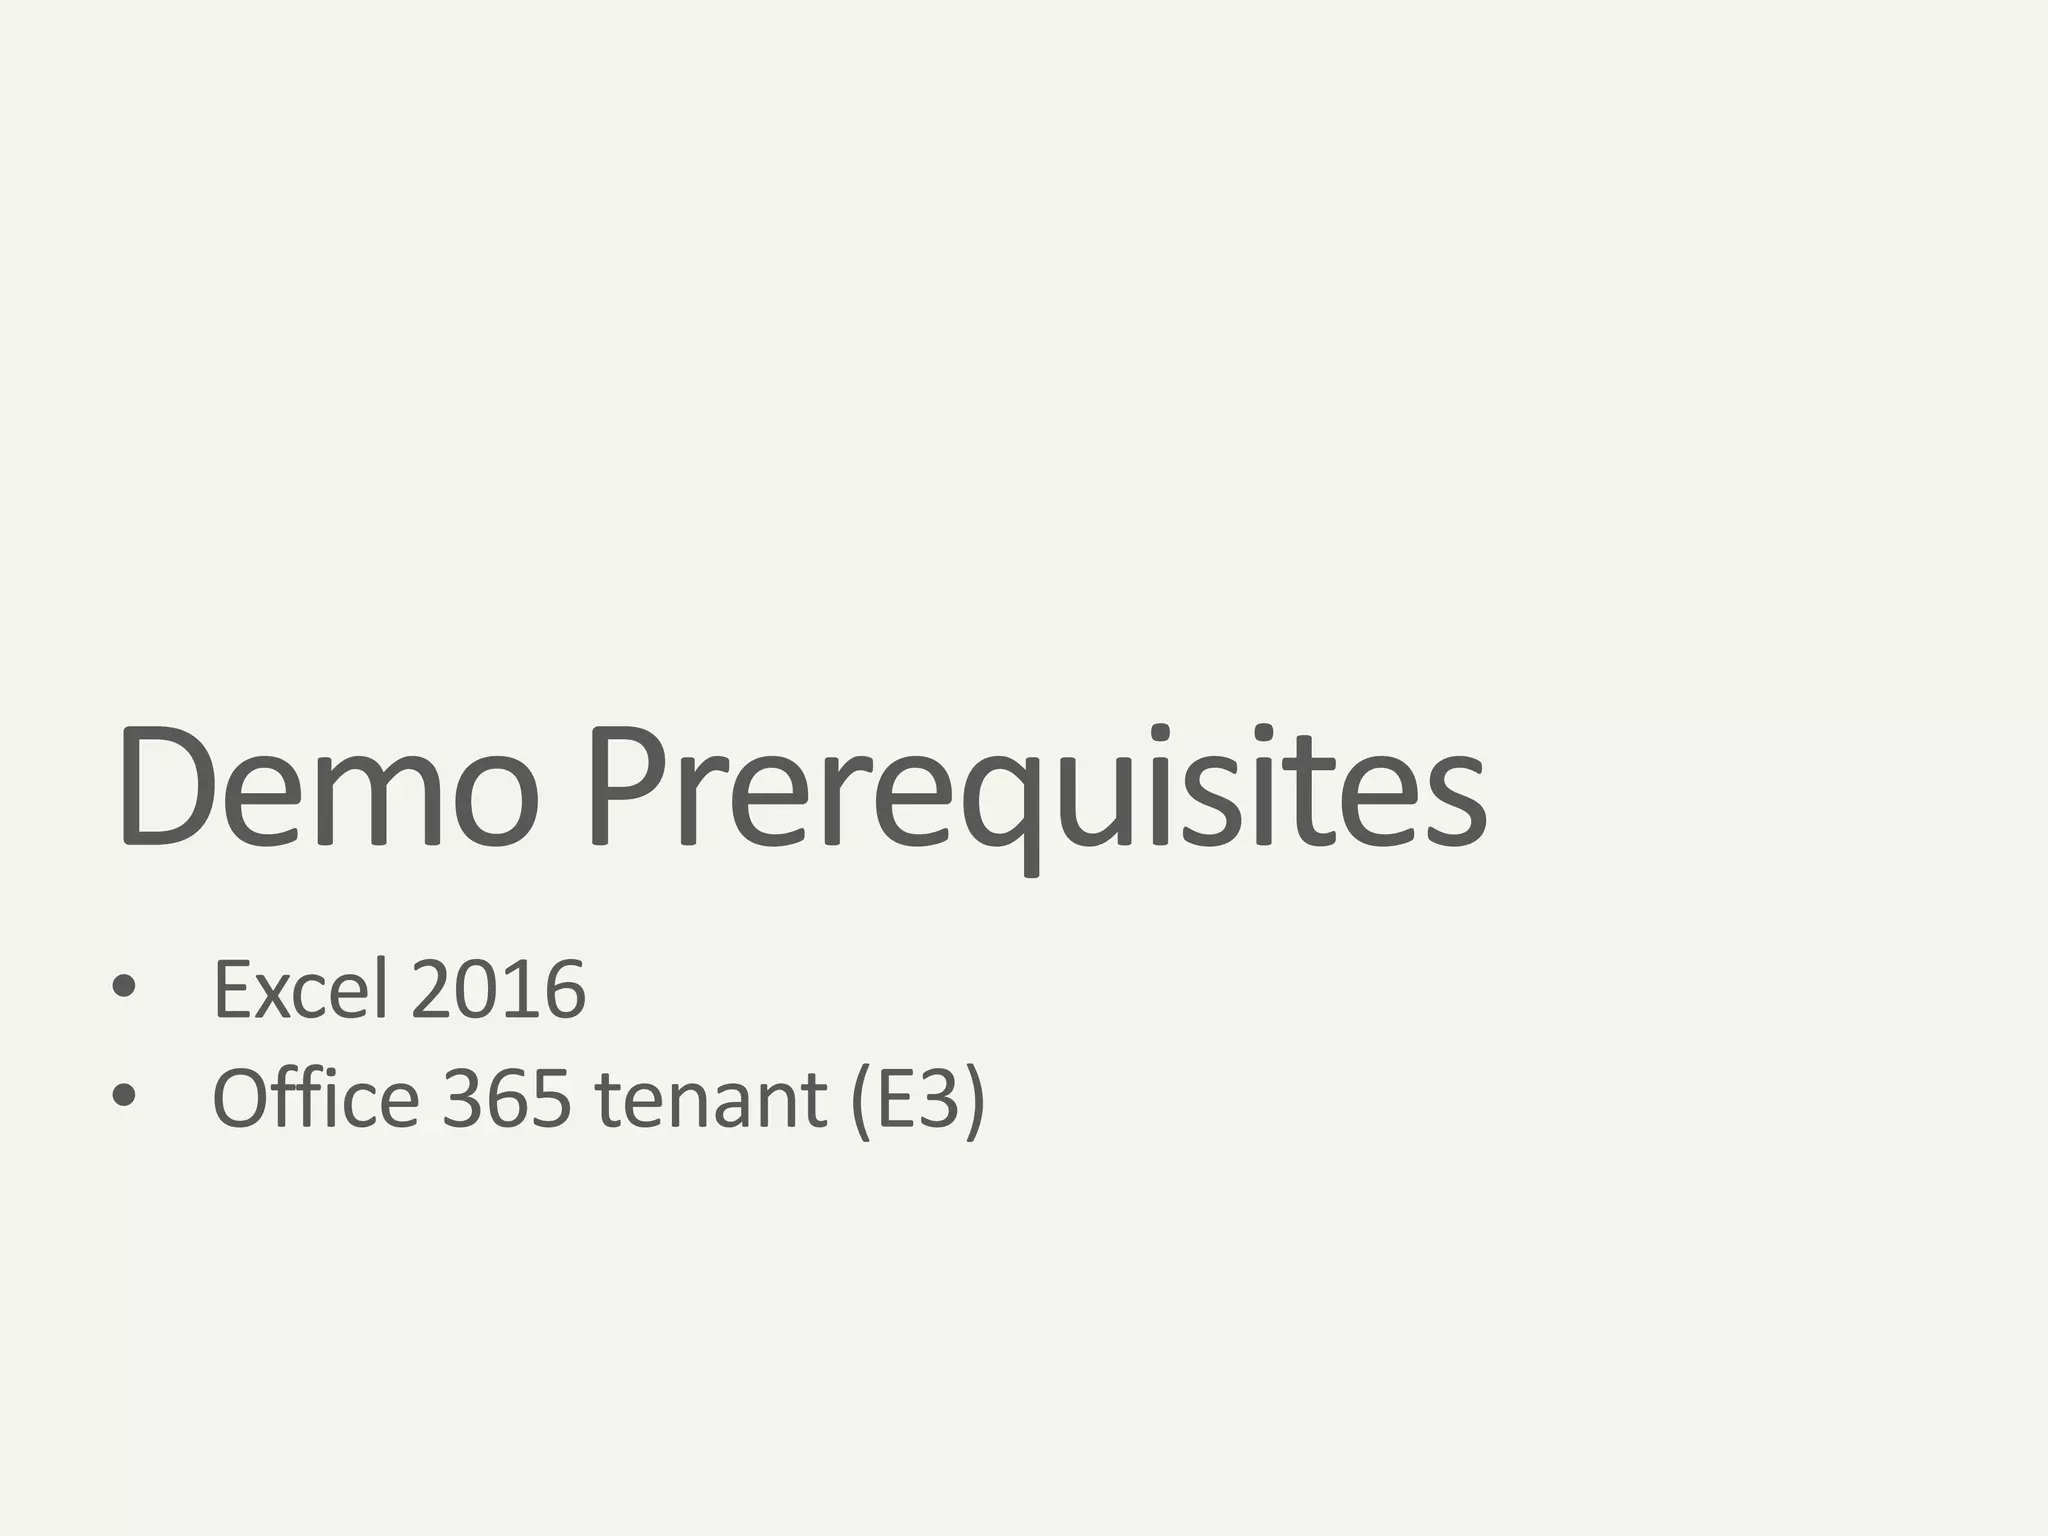


This document discusses creating appealing dashboards using Excel 2016 and SharePoint Online. It provides context on data and the journey of corporate data from gathering to cleaning, transforming, exploring, visualizing and sharing. It then demonstrates creating web part page dashboards, basic Excel dashboards, and Power View dashboards with prerequisites of Excel 2016 and an Office 365 tenant. The document concludes by advertising an event at the Observatory Student Pub including an experts' panel, prizes and giveaways, and a wrap-up SharePint session.