Download to read offline

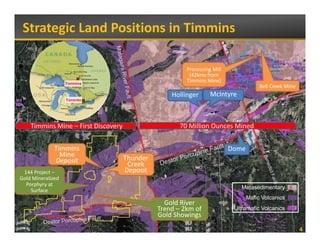
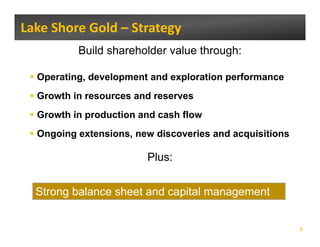
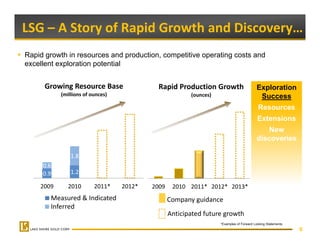
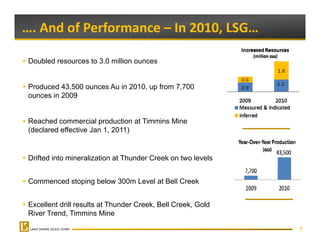
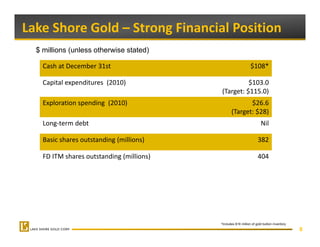
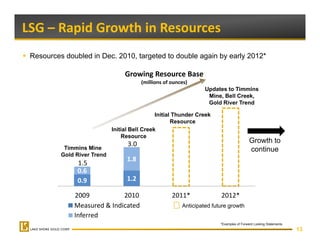
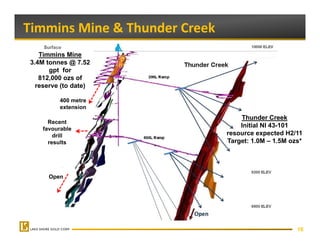
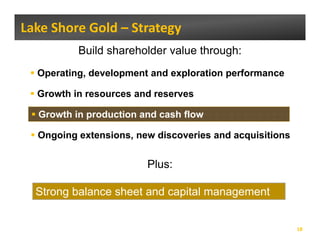
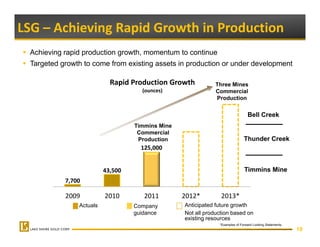
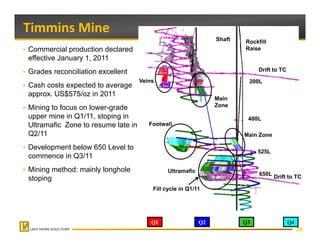
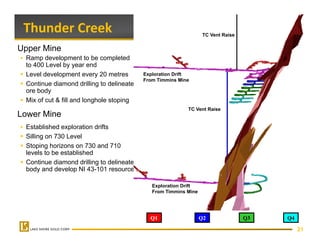
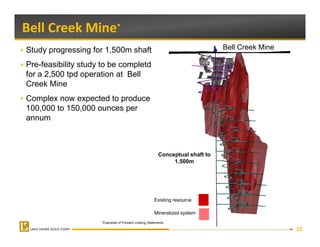
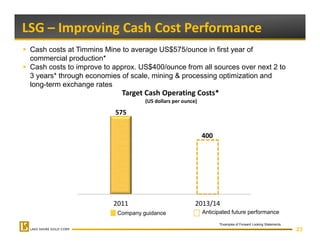


Lake Shore Gold held its annual general and special meeting on May 4, 2011 in Toronto, Ontario. The presentation discussed Lake Shore Gold's strategy of building shareholder value through operating, development and exploration performance, growth in resources and reserves, growth in production and cash flow, and ongoing extensions, new discoveries, and acquisitions. It also highlighted the company's strong financial position with $108 million in cash and no long-term debt. Lake Shore Gold is focused on rapidly growing its resource base and production at its Timmins Mine, Thunder Creek, Bell Creek, and other properties in Ontario.


