Download to read offline
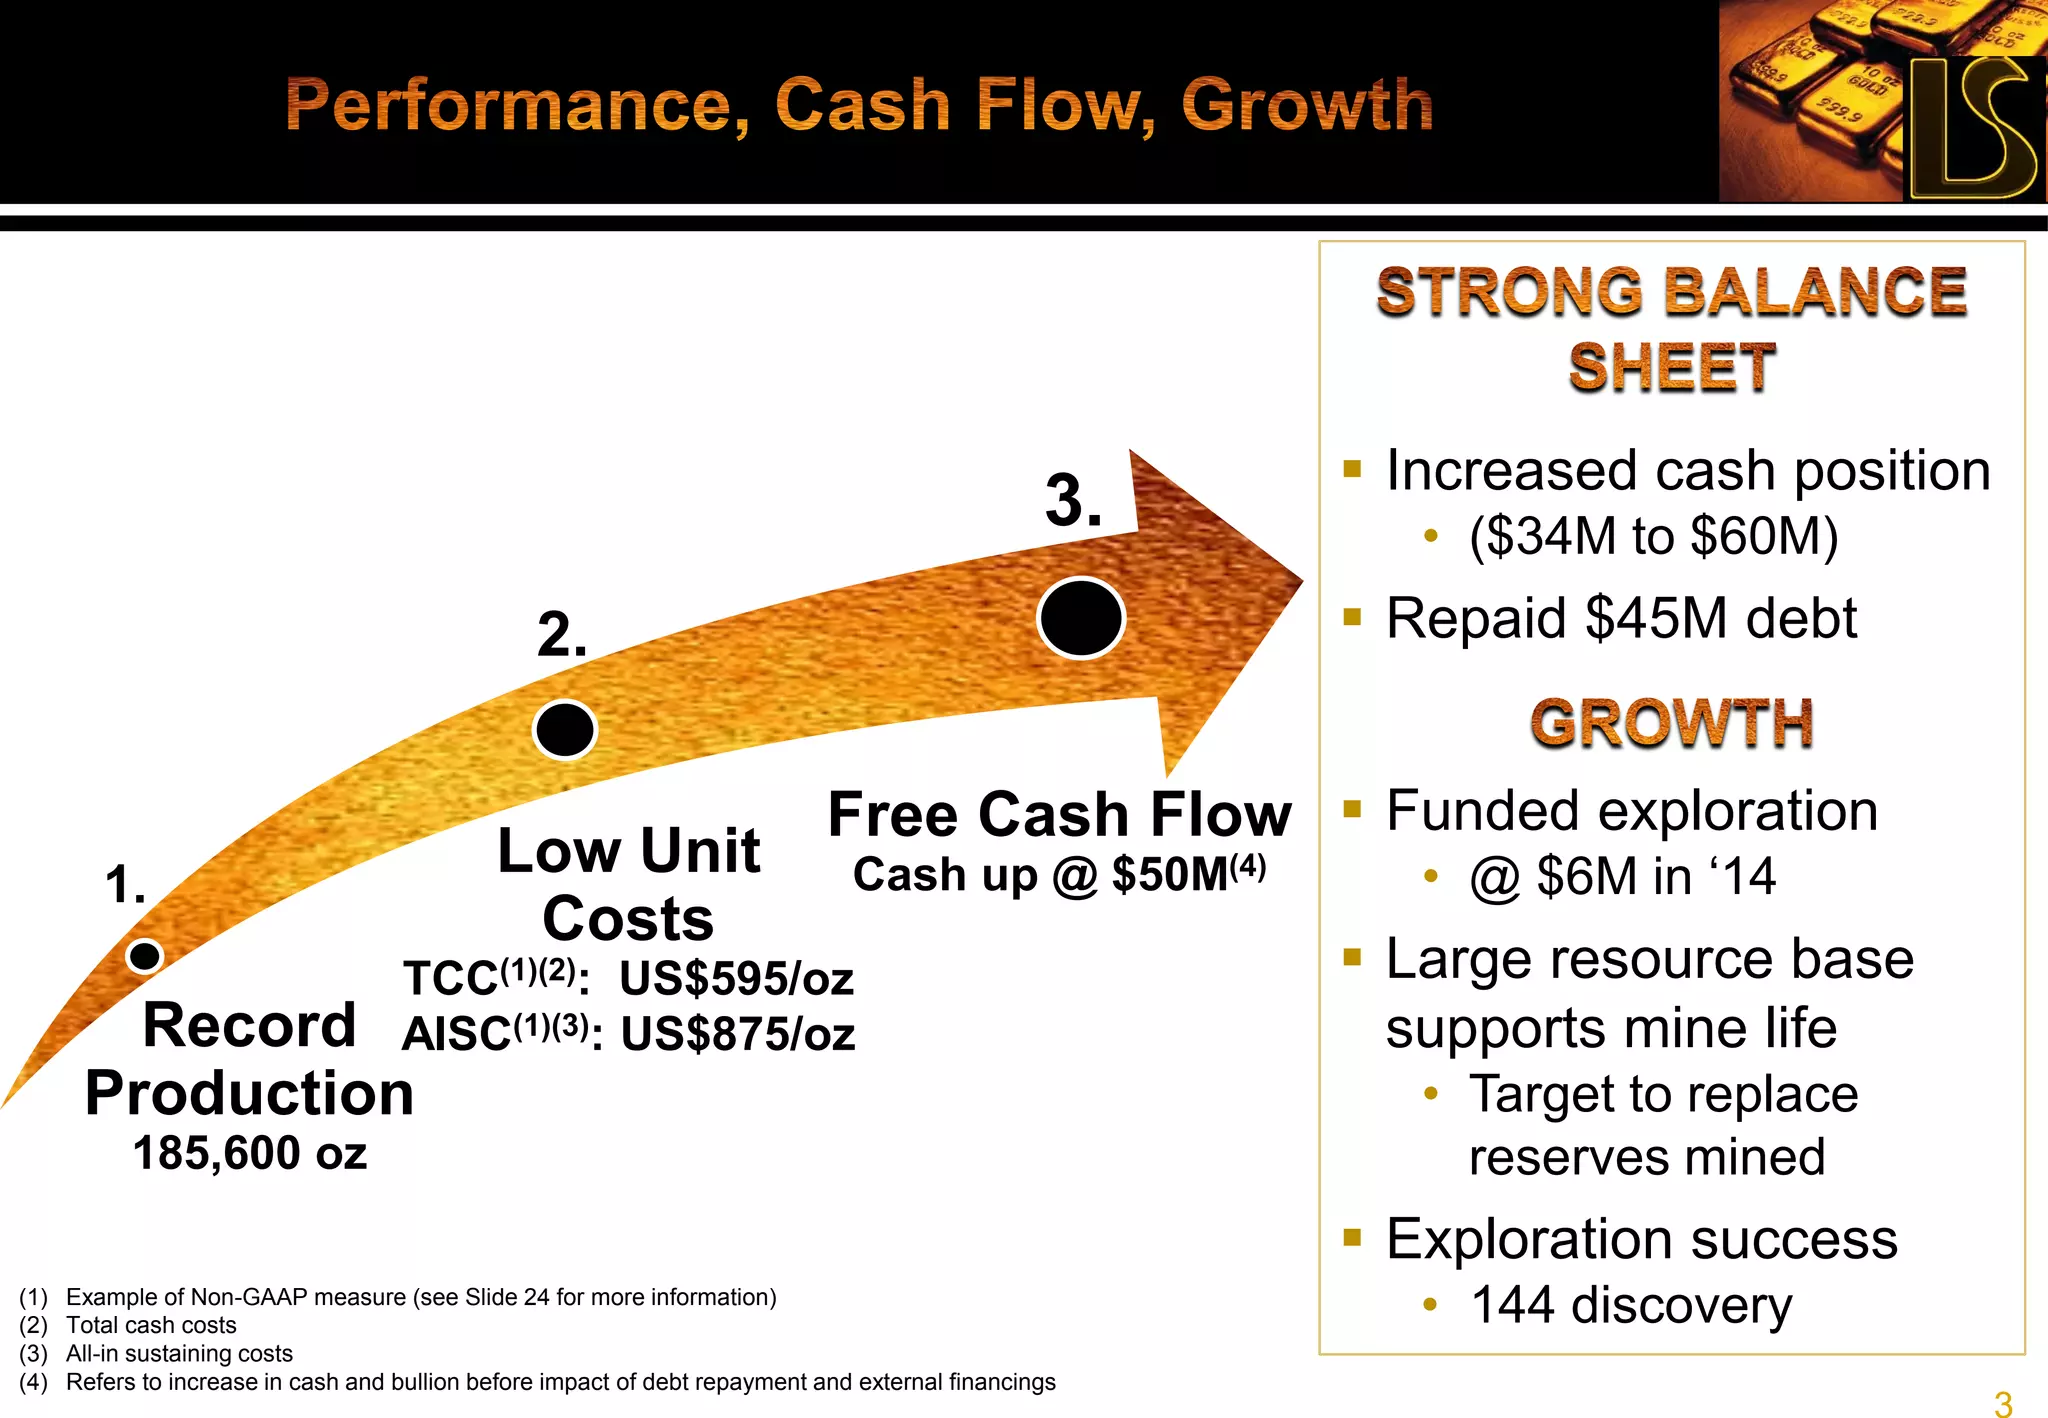
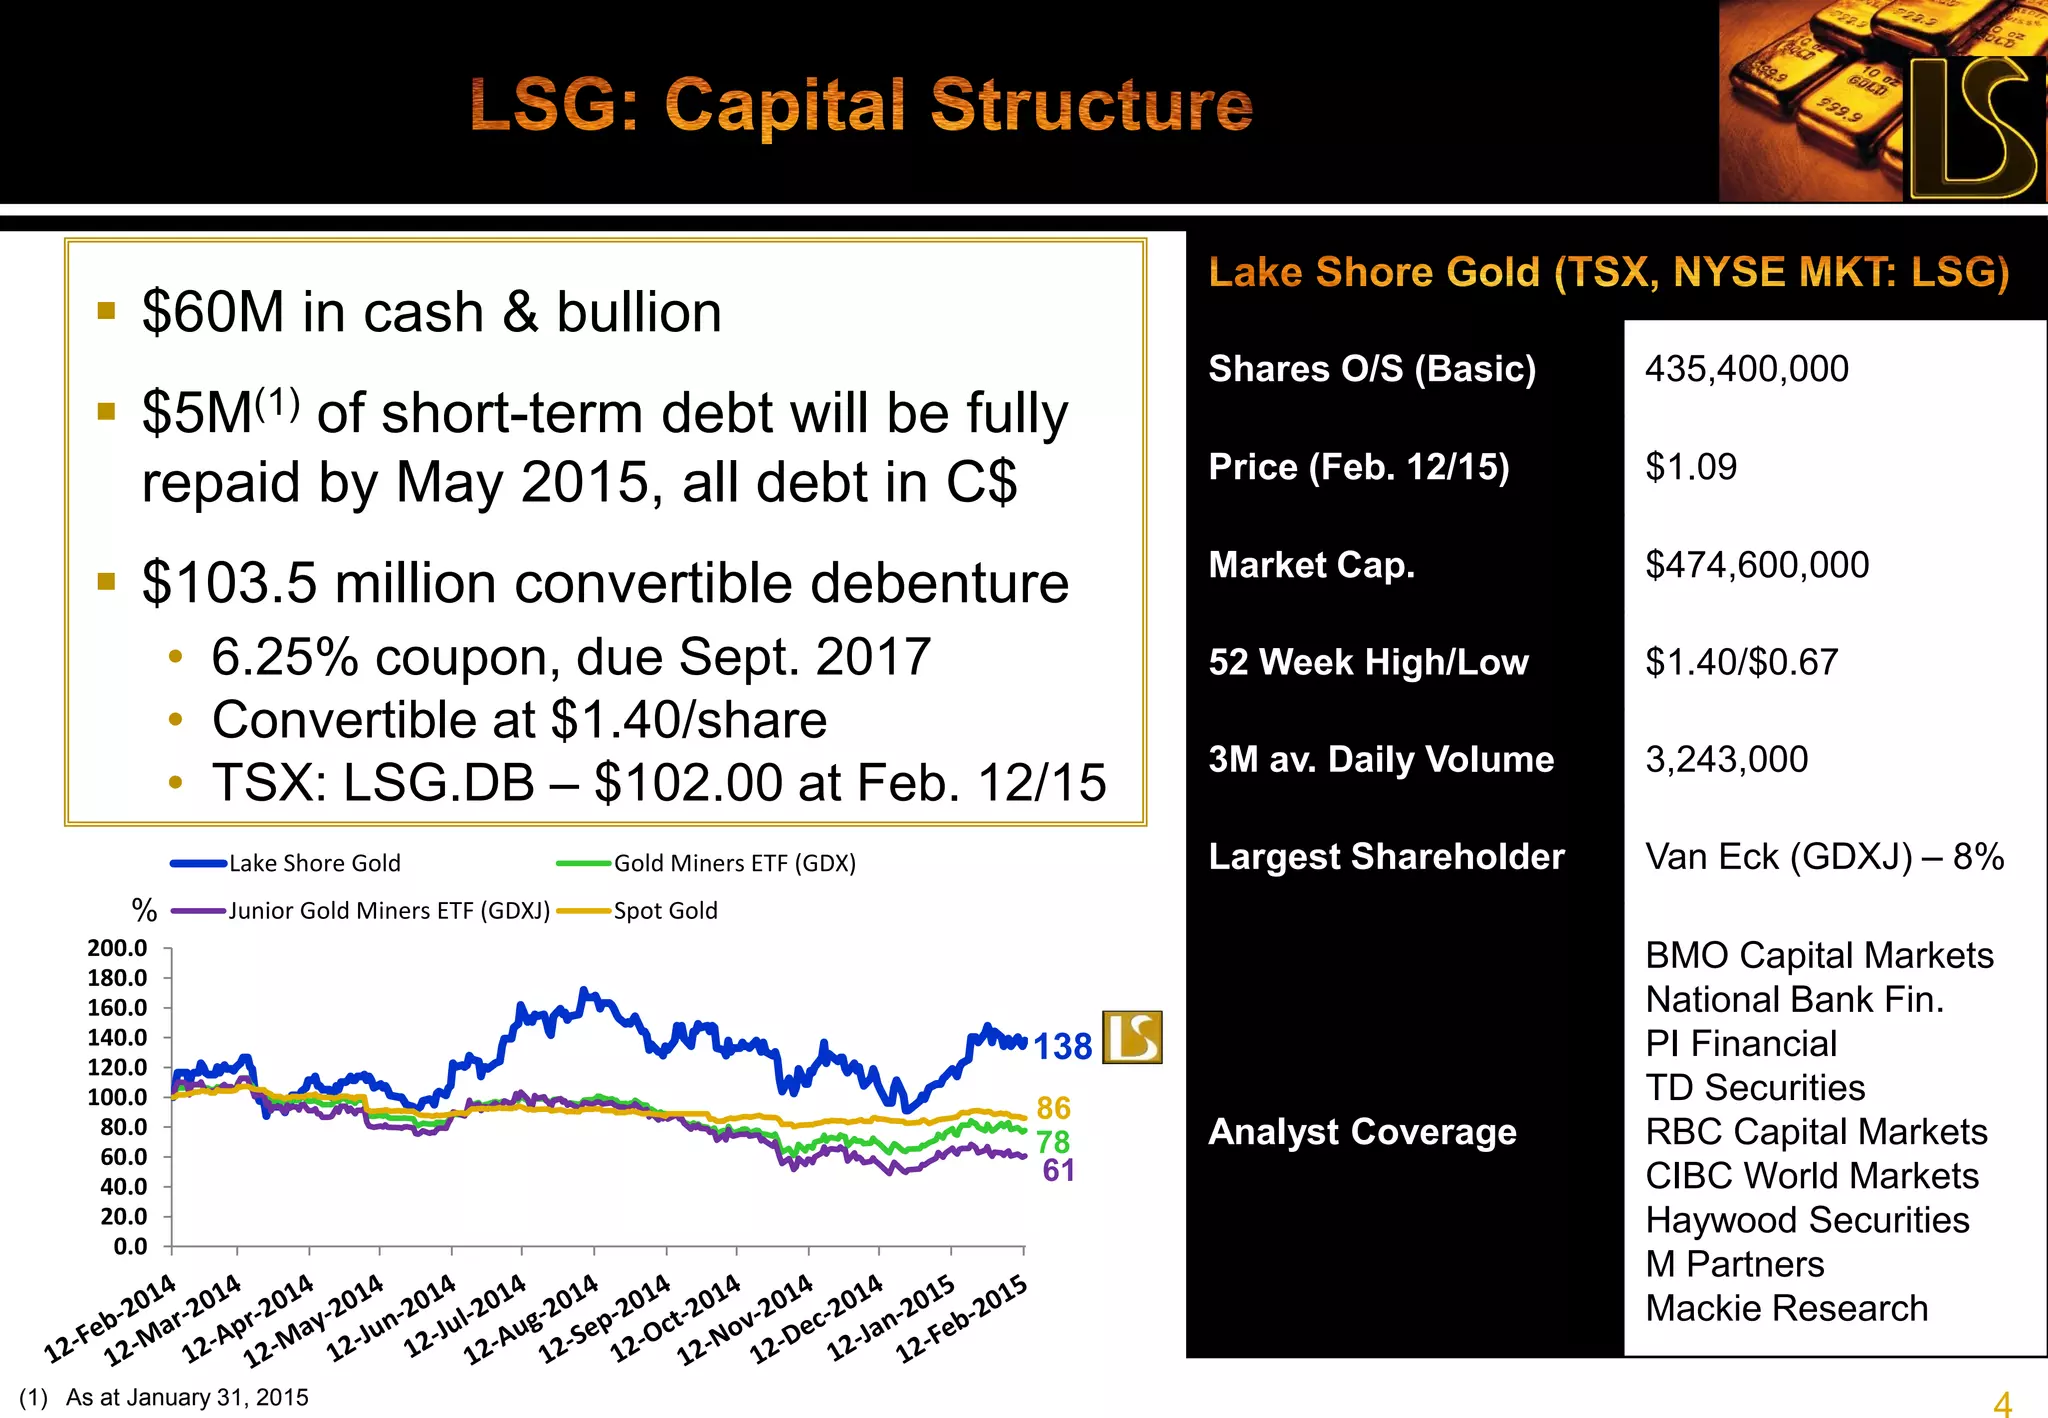

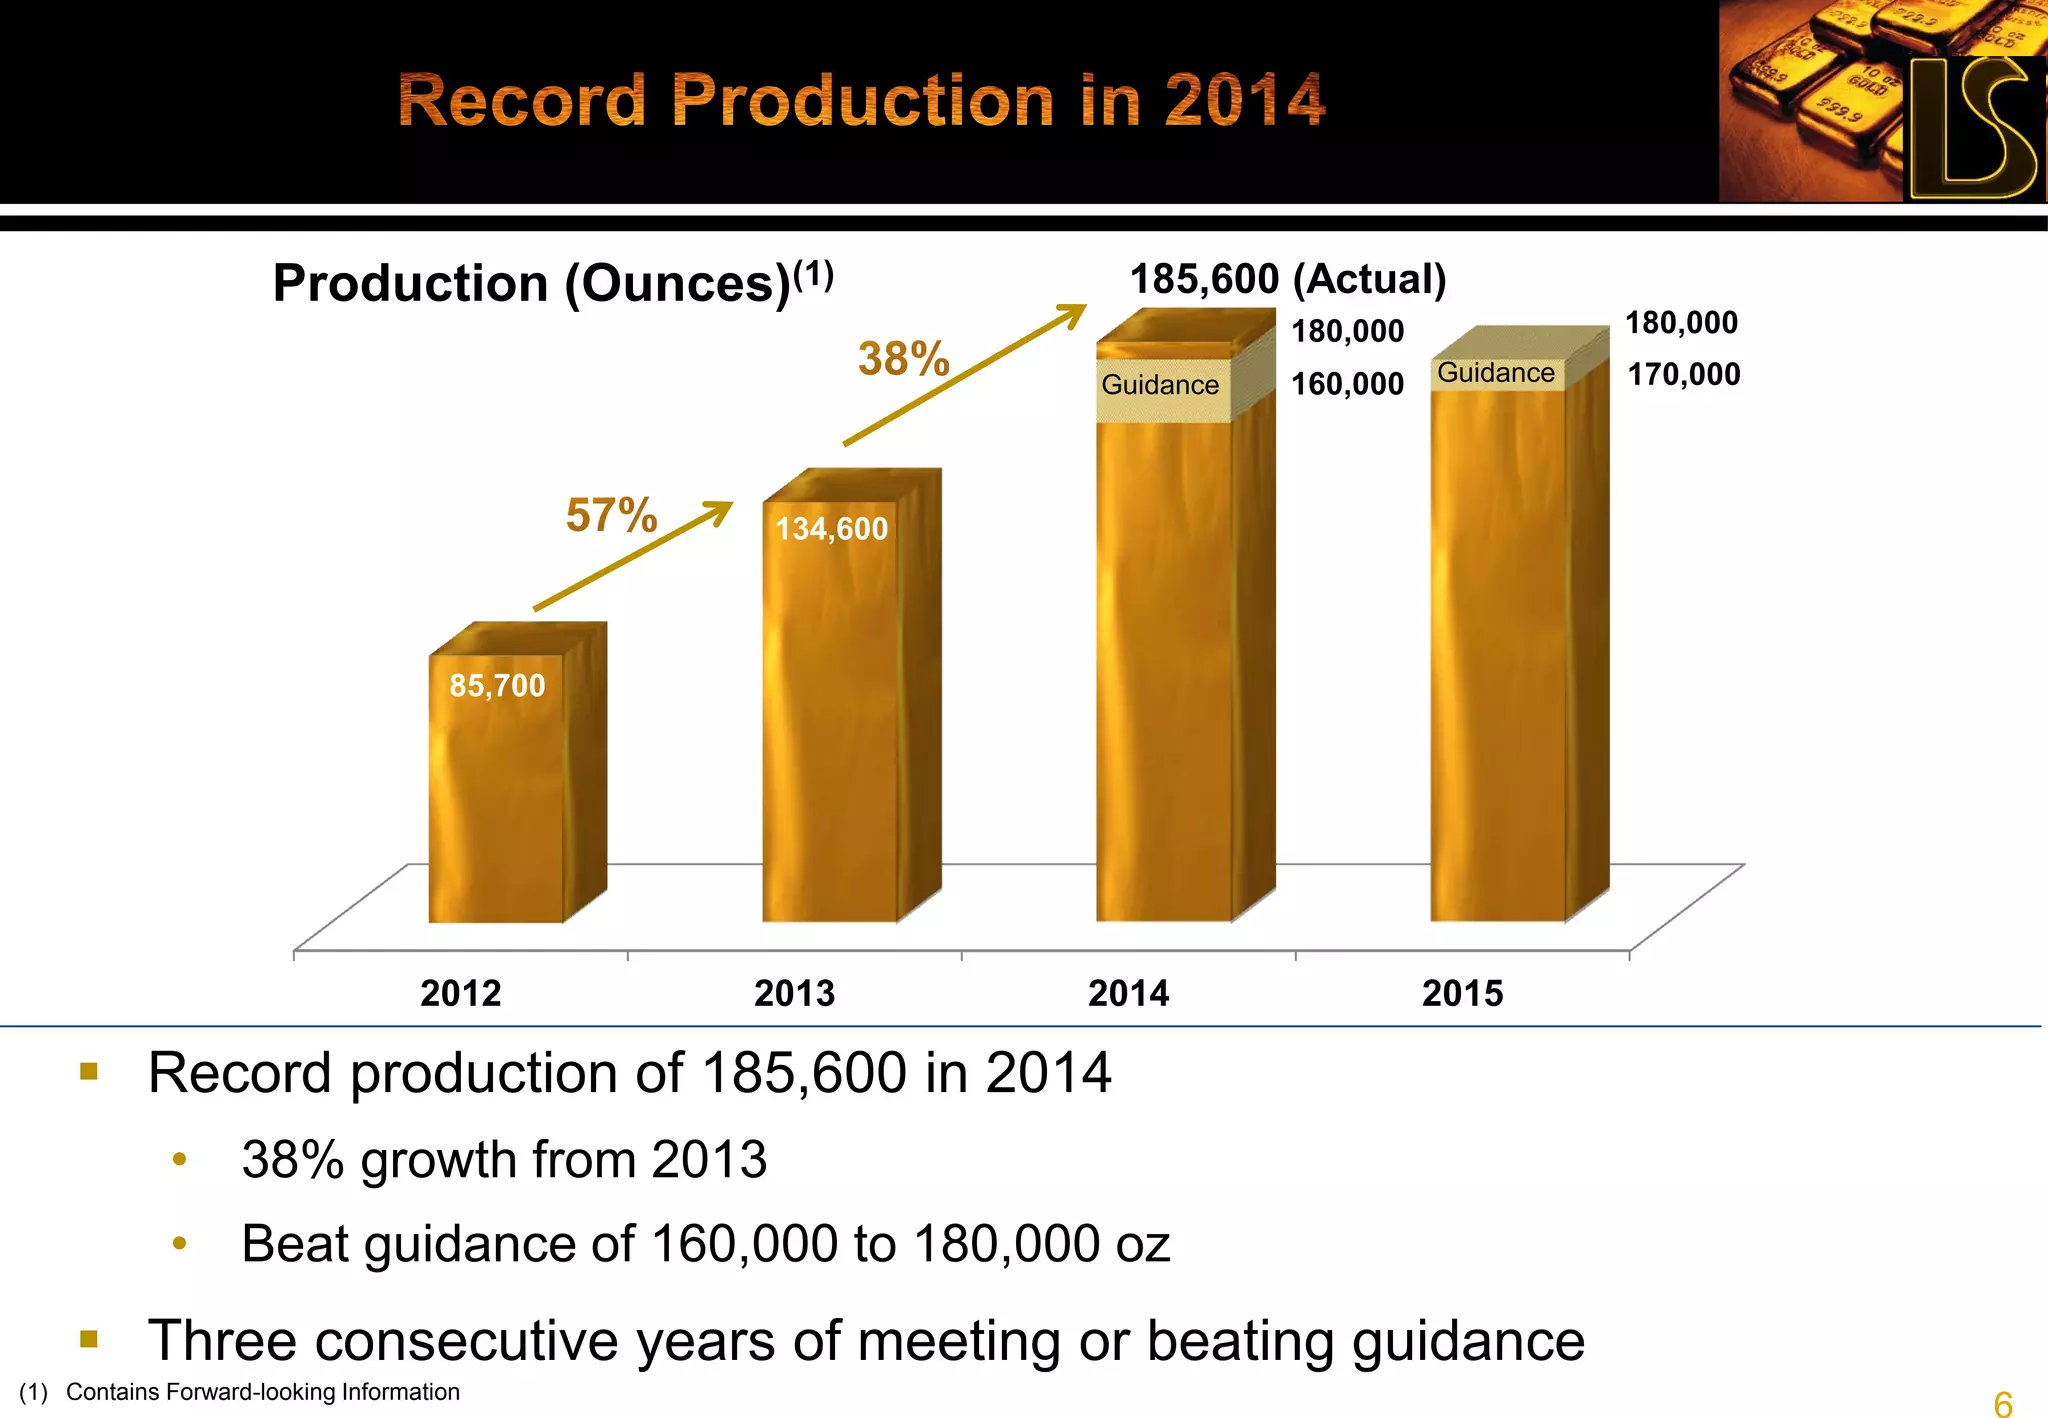
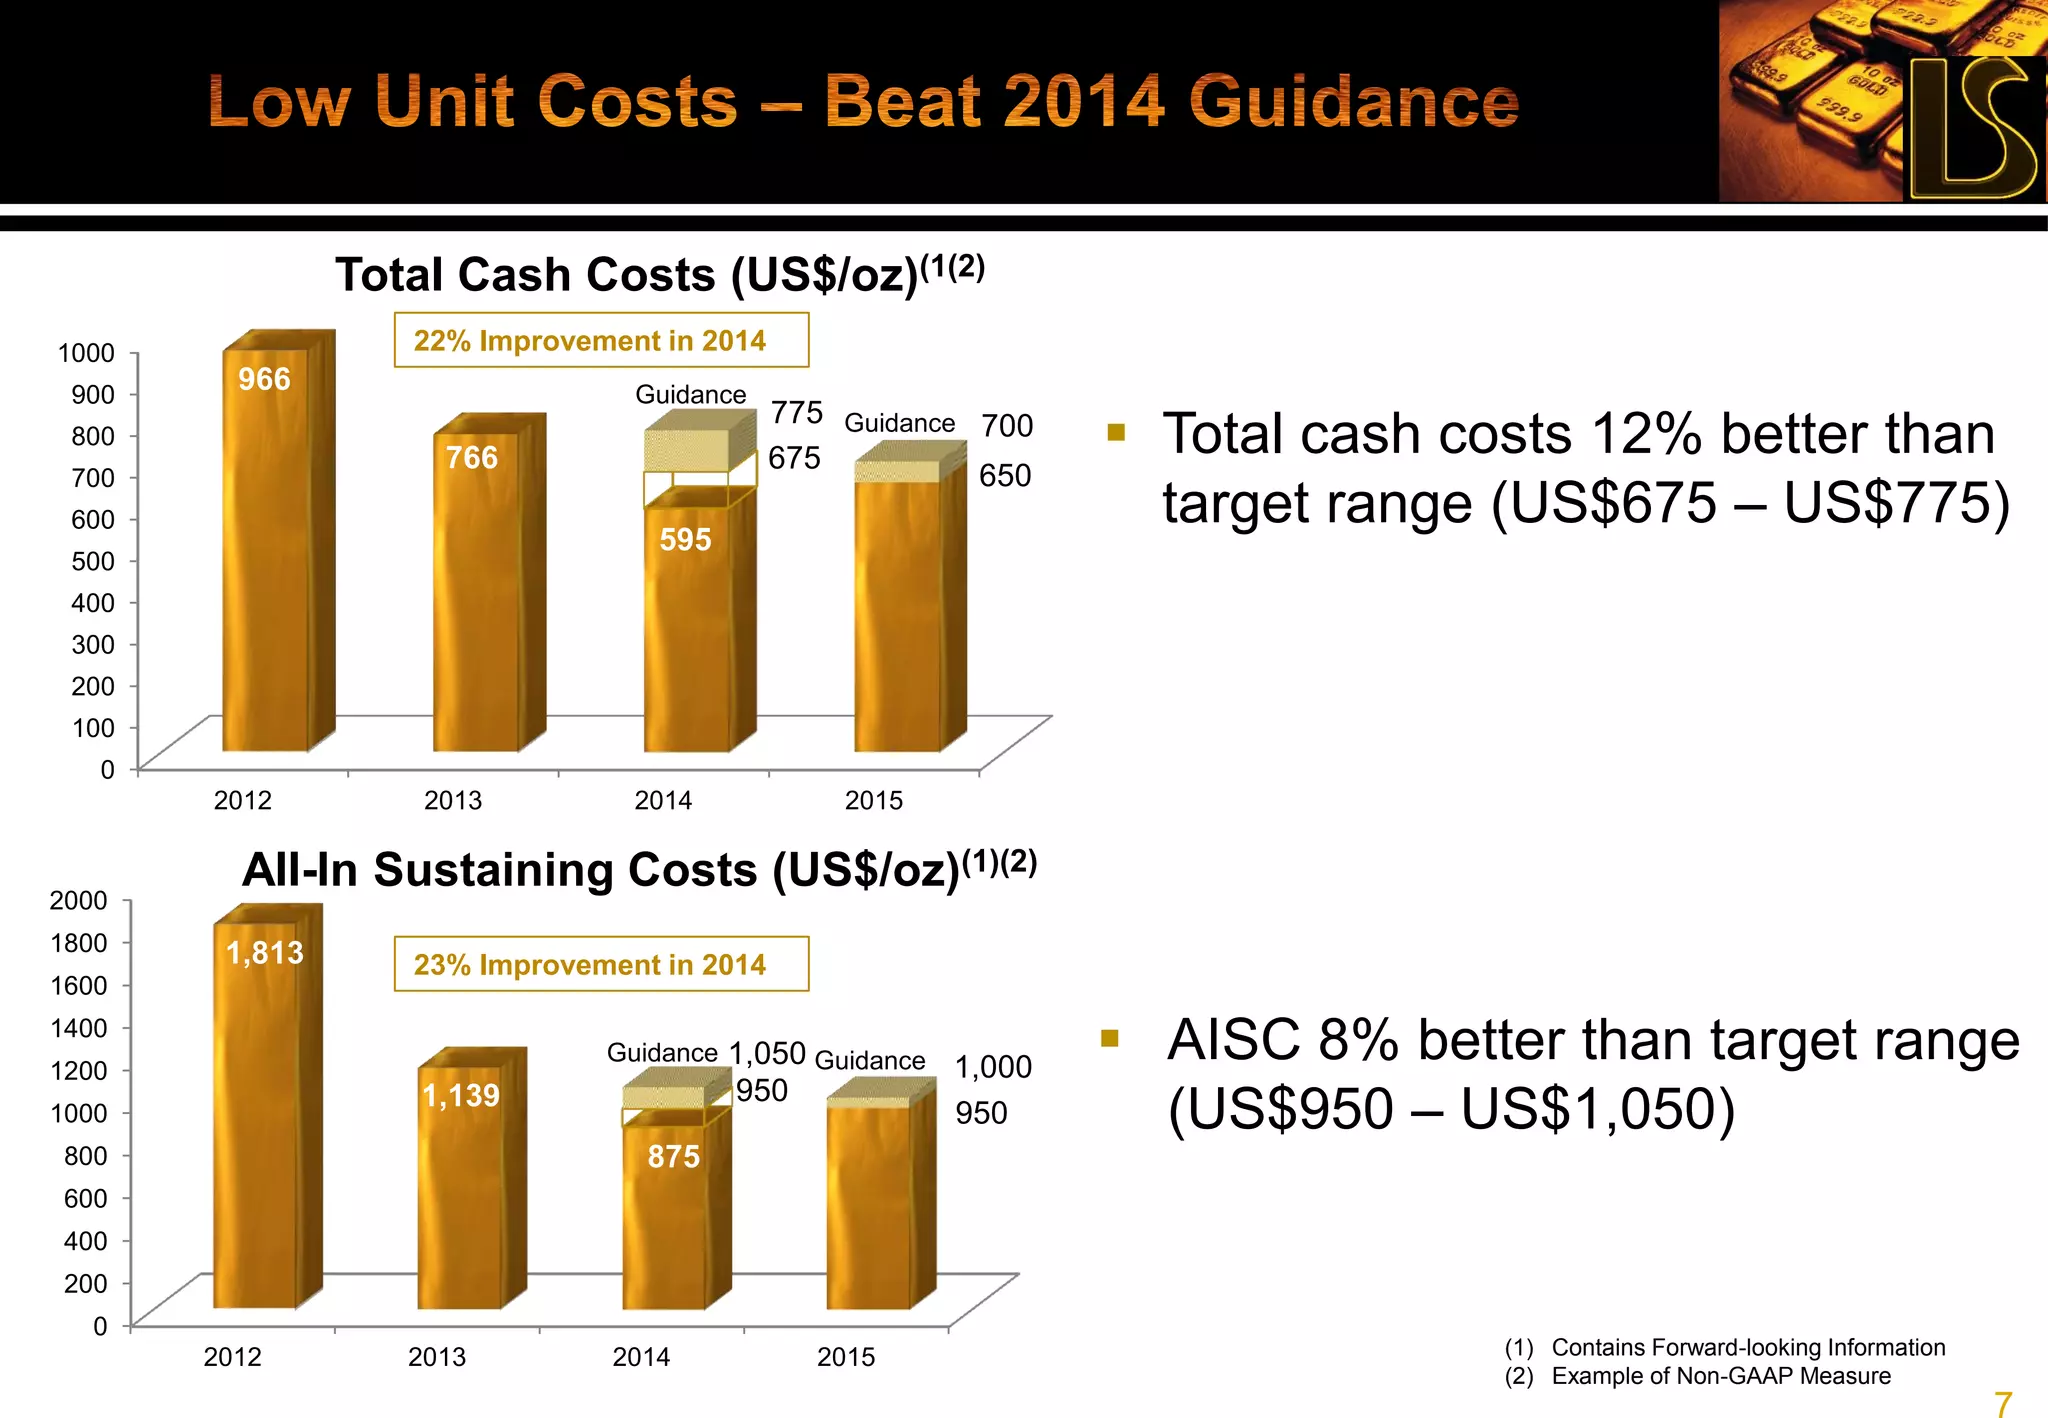
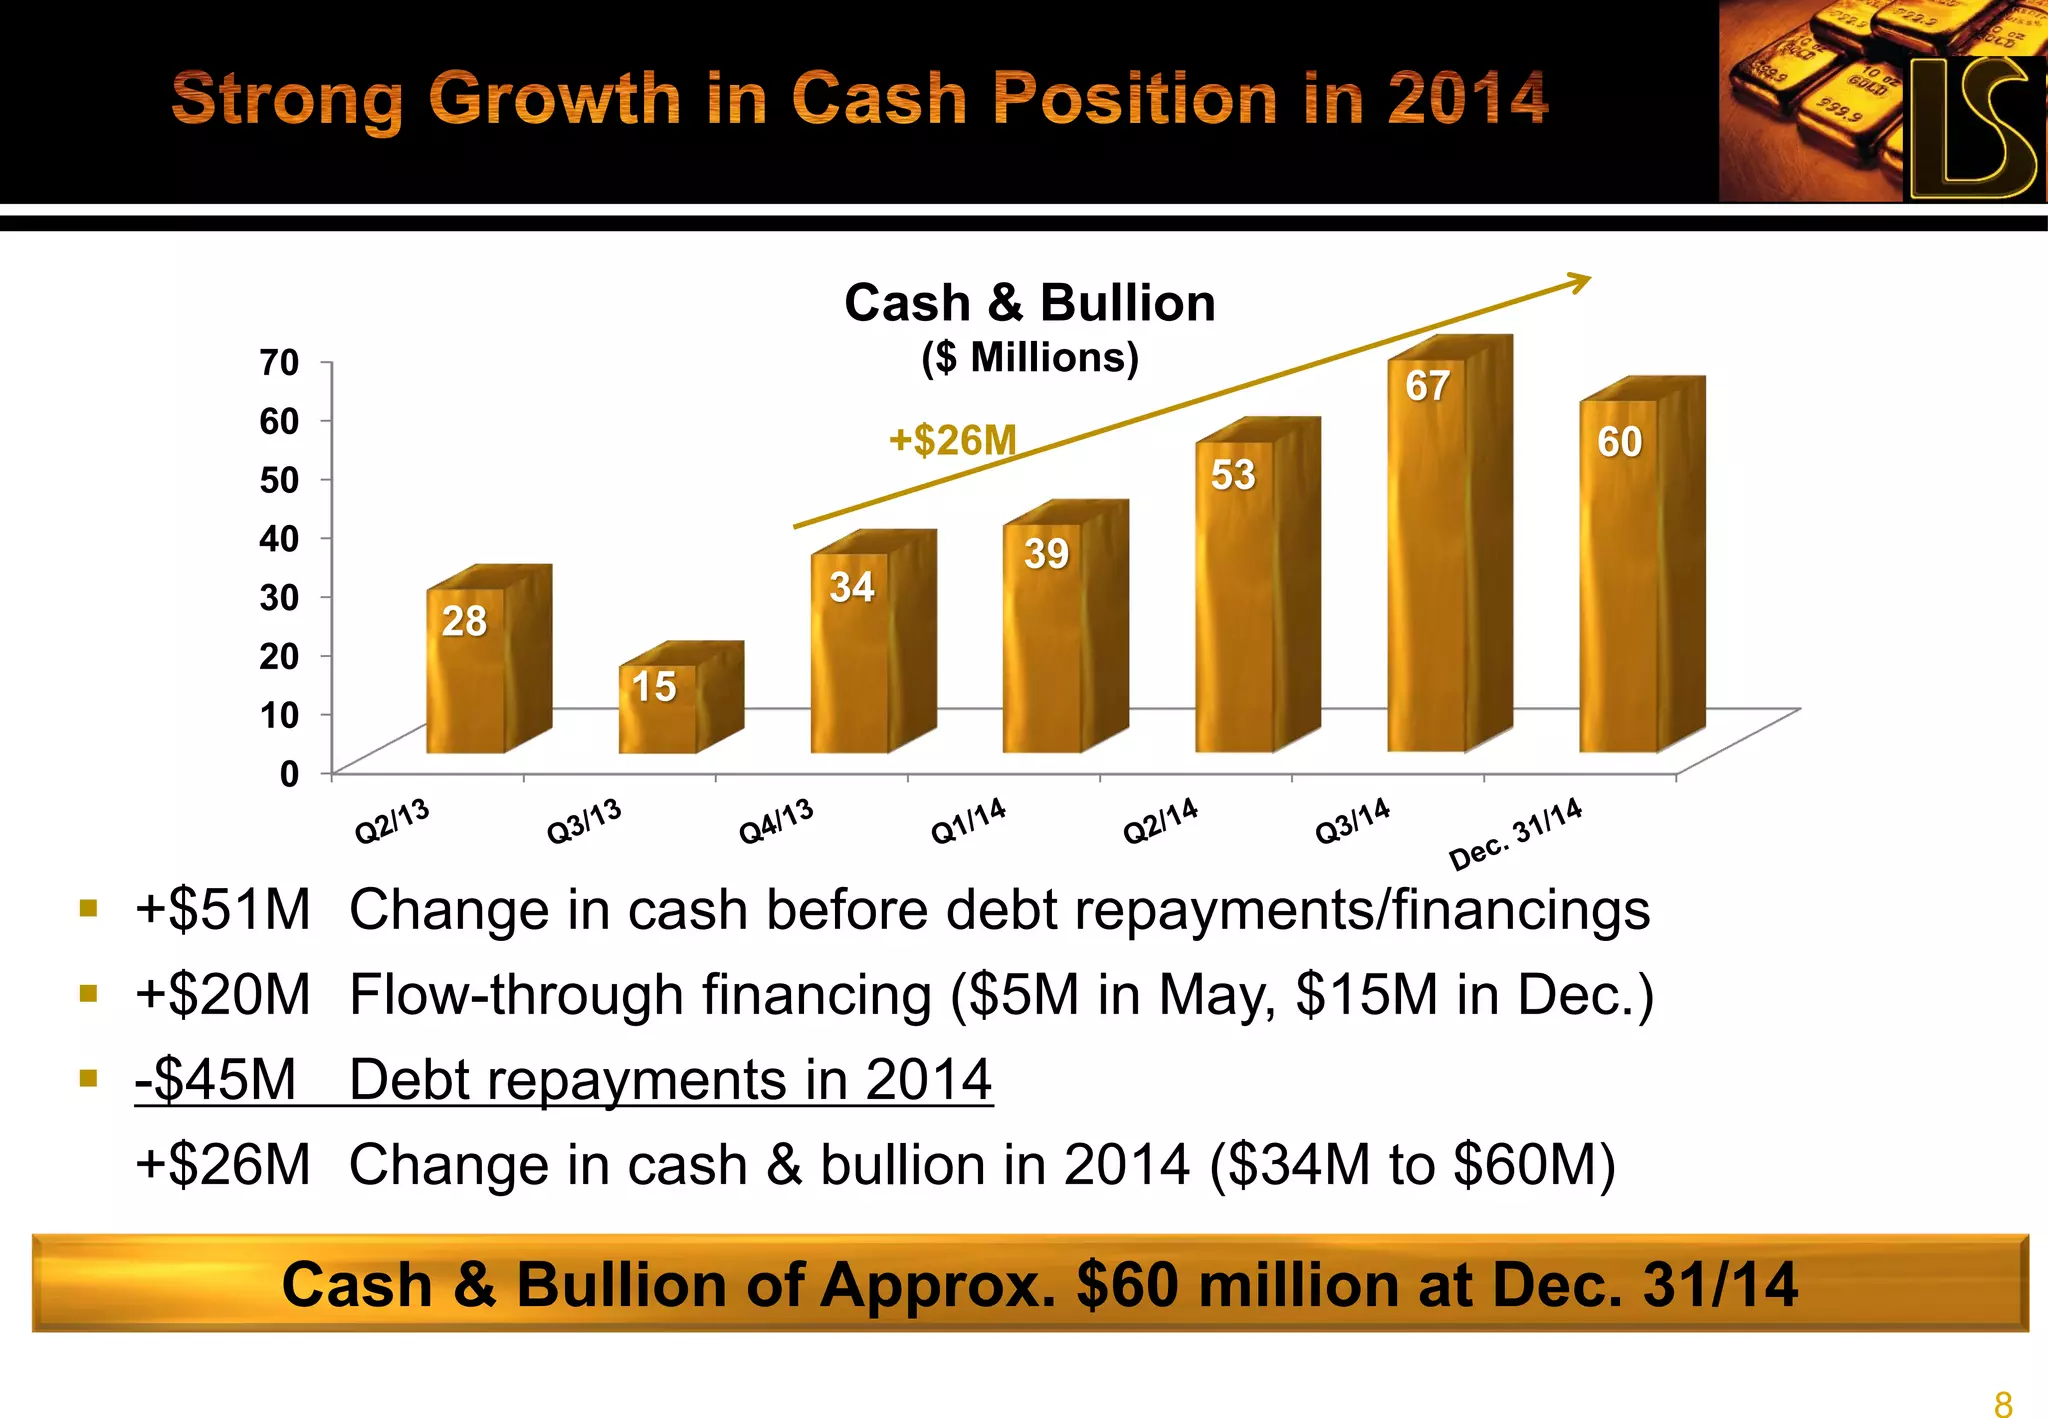
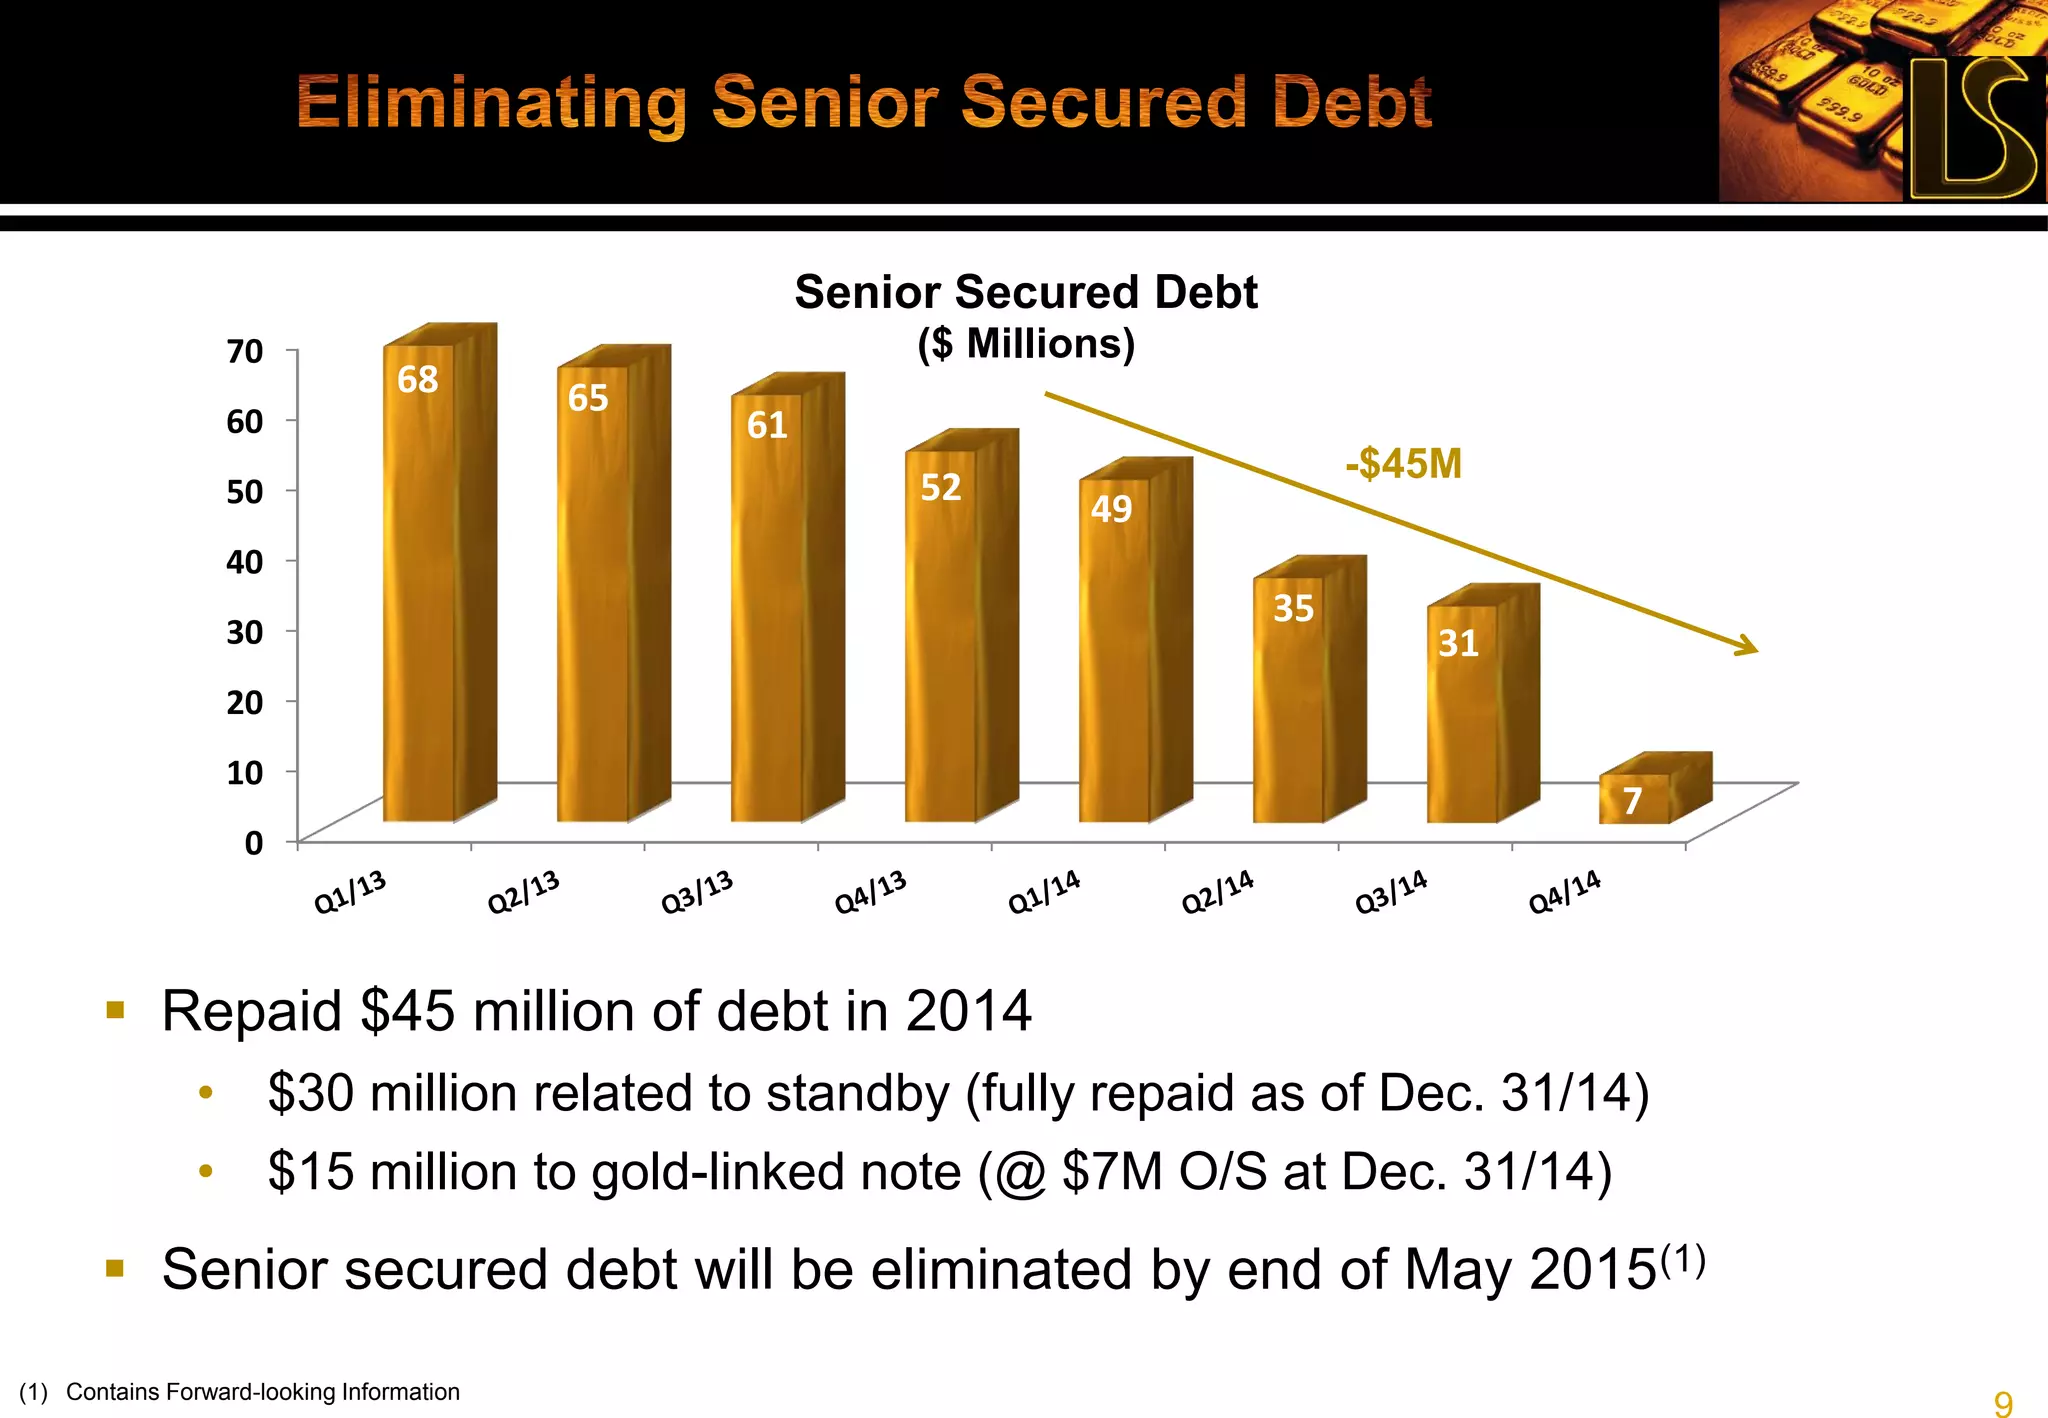
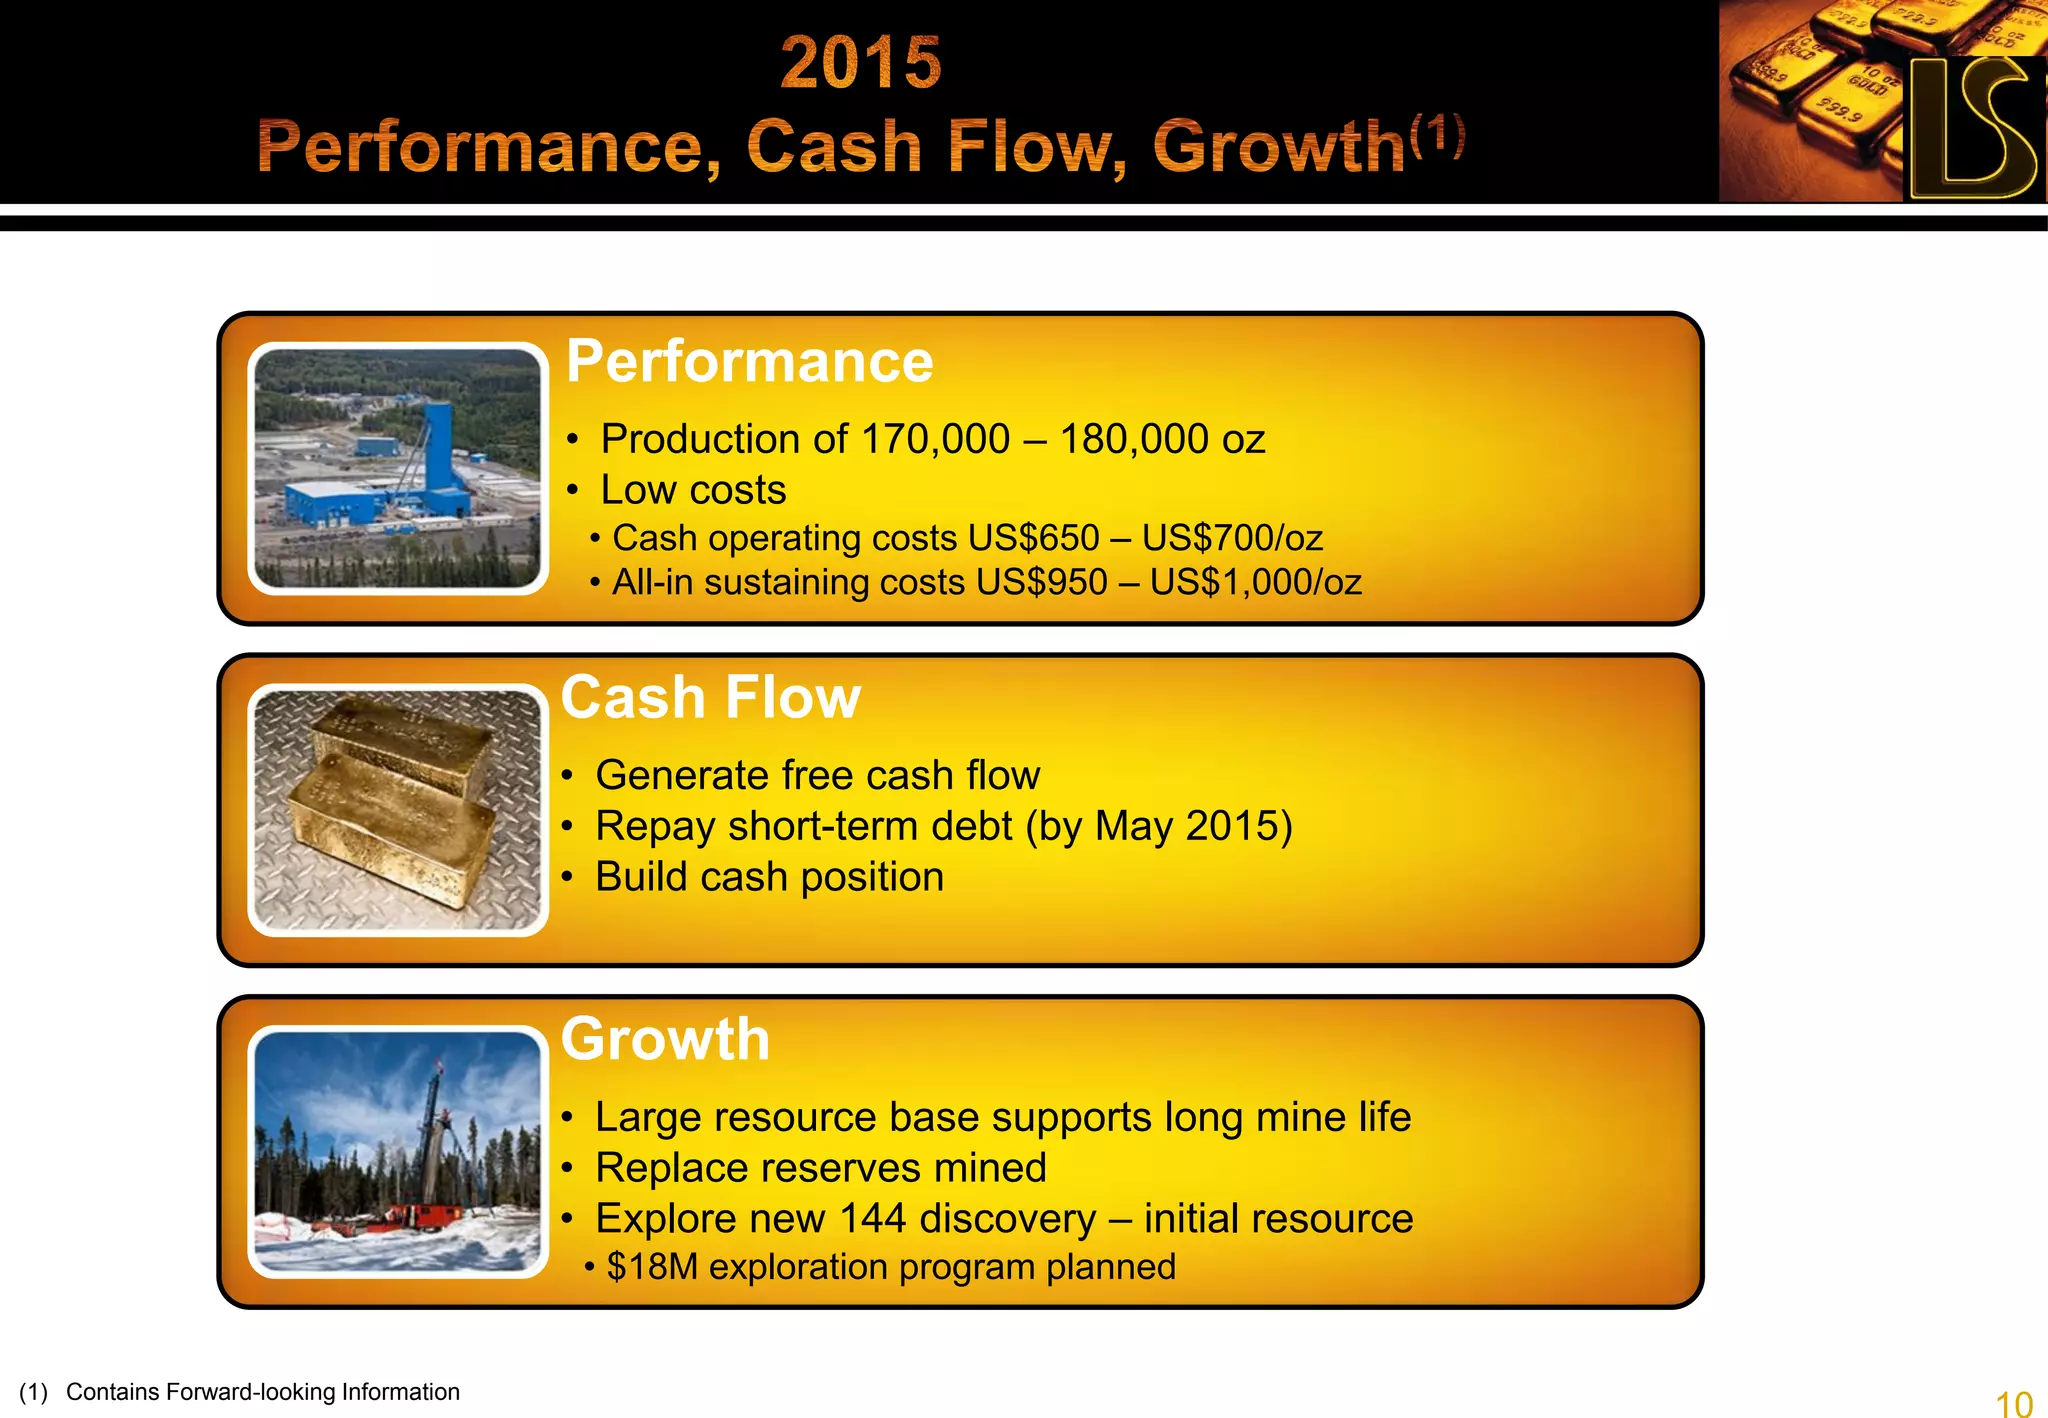


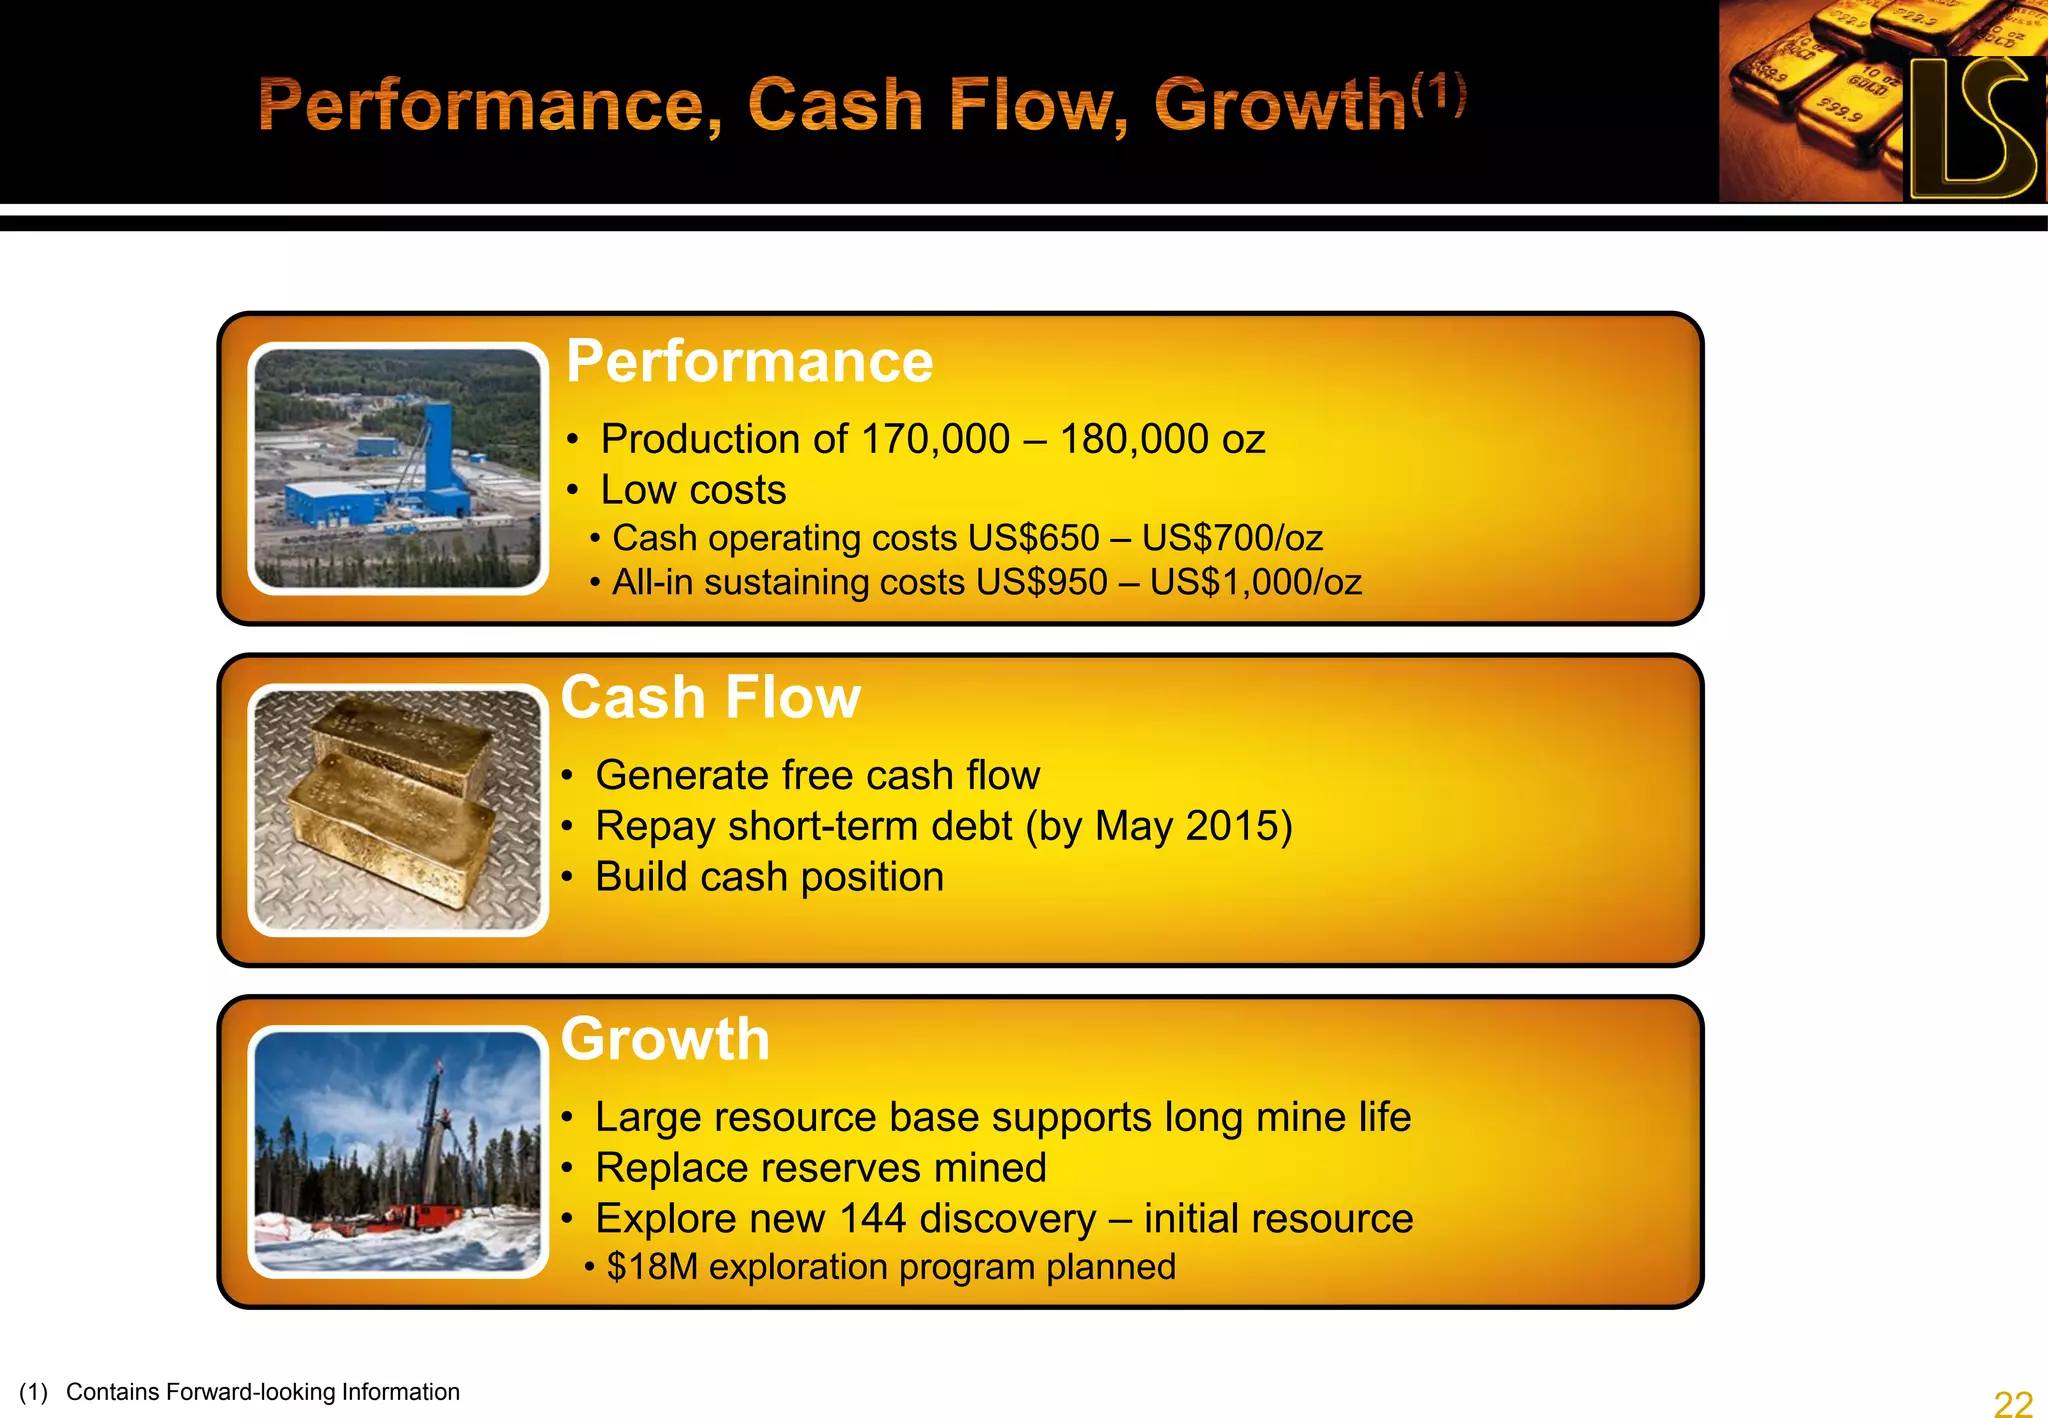


The document provides information about Lake Shore Gold Corp., including: 1) Lake Shore Gold had record gold production of 185,600 ounces in 2014, exceeding guidance of 160,000-180,000 ounces. 2) The company achieved low unit costs in 2014, with total cash costs of US$595/oz and all-in sustaining costs of US$875/oz, better than guidance. 3) The company increased its cash position from $34 million to $60 million in 2014 through free cash flow, while also repaying $45 million in debt.


