Download as PDF, PPTX
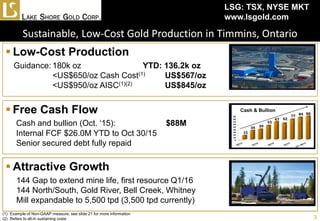
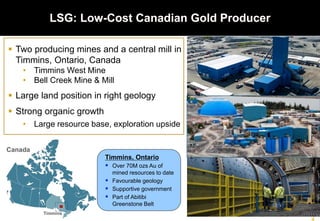
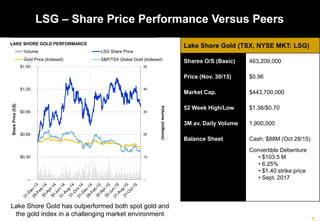
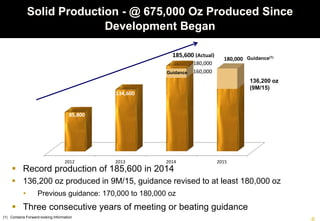
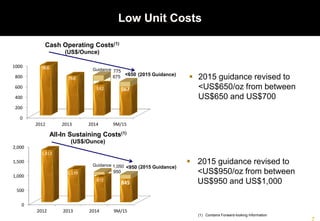
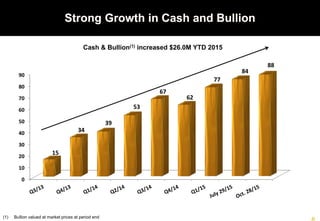
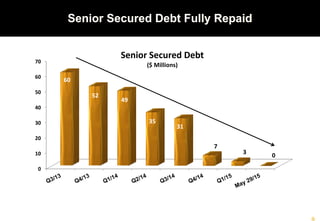
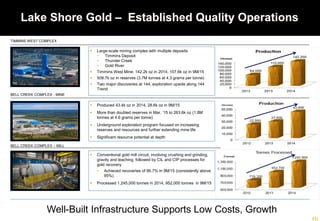
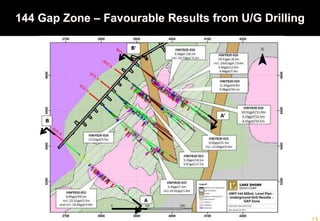
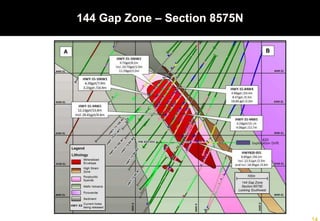
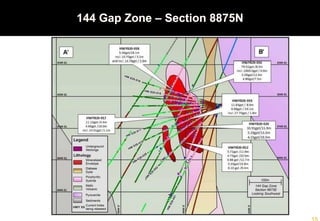
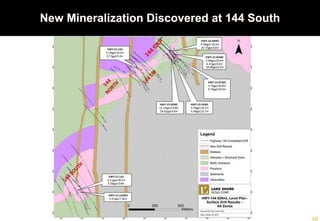
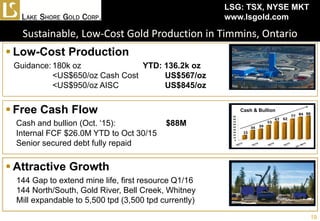

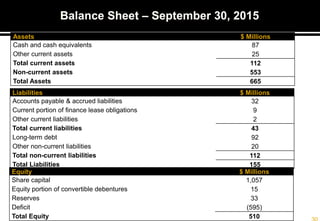

Lake Shore Gold Corp. is a Canadian gold producer that operates the Timmins West and Bell Creek mines and milling complex in Timmins, Ontario. The presentation provides an overview of the company's operations and financial results. Key points include: - Production guidance of 180,000 ounces of gold in 2015 at an all-in sustaining cost of less than $950 per ounce. - 136,200 ounces were produced in the first nine months of 2015, meeting guidance. - Cash and bullion balances increased to $88 million as of October 2015, with $26 million in free cash flow generated year-to-date. - Exploration success has extended mine life at Timmins West and increased reserves at


