1) The document describes the development of a low-cost fiber optic chemical sensor to measure ammonia levels in fishpond water.
2) The sensor uses an evanescent wave design with the fiber optic stripped to expose the core to the water sample. Light from a 1310nm source passes through the fiber and the absorption loss is measured.
3) Testing was done with ammonia mass variations of 1-5% added to the water sample. The sensor measurements matched well with those from an optical spectrum analyzer, with a maximum absorption loss of 27.56dBm detected.
![TELKOMNIKA, Vol.16, No.6, December 2018, pp.2921~2929
ISSN: 1693-6930, accredited First Grade by Kemenristekdikti, Decree No: 21/E/KPT/2018
DOI: 10.12928/TELKOMNIKA.v16i6.10493 2921
Received July 4, 2018; Revised July 22, 2018; Accepted August 28, 2018
Low-cost Fiber Optic Chemical Sensor Development for
Fishpond Application
Budi Mulyanti1
, Yuski Maolid Rizki Faozan2
, Arjuni B. Pantjawati3
, Roer Eka Pawinanto4
,
Lilik Hasanah5
, Wahyu Sasongko Putro*6
1,2,3,4
Department of Electrical Engineering Education, Universitas Pendidikan Indonesia, 40154,
Bandung, West Java, Indonesia
5
Department of Physics Education, Universitas Pendidikan Indonesia, 40154,
Bandung, West Java, Indonesia
6
Department of Atmospheric and Planetary Sciences, Institut Teknologi Sumatera, 35365,
Jati Agung, Lampung, Indonesia.
*Corresponding author, e-mail: wahyu.putro@aps.itera.ac.id
Abstract
In this study, aimed to develop low-cost sensor based on fiber optic to assess ammonia index for
fishpond application. Here, the simple design was proposed by using Evanescent wave type to assess
ammonia index during acid rain event. The experiment result showed maximum absorption loss with
variation ammonia mass 1~5% with wavelength 1310 nm from Optical Light Source (OLS) is 27.56 dBm
while Optical Spectrum Analyzer (OSA) reached 25.86 dBm. We had calculated RMSE, MAE, and Percent
Error (PE) value both of the device (Low-cost fiber optic chemical sensor and OSA) are 1.692%, 0.916%,
and 98.833% respectively. A good result from low cost fiber optic chemical sensor has successful
developed with lowest production less than 1,455 USD per-year.
Keywords: acid rain, ammonia (NH3), fiber optic, fishpond, low-cost sensor
Copyright © 2018 Universitas Ahmad Dahlan. All rights reserved.
1. Introduction
Nowadays, the acid rain phenomenon is categorized as an environmental hazard
especially in Indonesia. Here, acid rain was composed by hydrocarbon oxides, Ammonia (NH3)
and nitrogen (NOx). The three types of acid rain particles are very harmful for environment and
human health [1]. During acid rain event, the pH level of water quality index is decreased to
4.7~5.6 (moderate) due to NH3 particle increased [2-4]. The conventional acid rain
measurement using pH meter probe is very expensive for Indonesian fish breeders. Many users
of pH meter probe to detect NH3 substance in Indonesia was decreased until 20~30% over July
2010 due to lack of budget [5]. Thus, this study aimed to develop low-cost sensor to assess NH3
over Indonesian fishpond based Fiber Optic Chemical Sensor (FOCS).
The current study of NH3 sensor development to assess contaminated water was
successful obtained by using arrays sensor based on conductive polypyrrole film (called
electrochemically). The deposited electrochemically on glassy carbon surface and internal solid
layer (between sensing membrane and solid electrode surface) has occurred NH3 over polluted
area [6]-[8]. Due to lack of data in real time measurement, the wireless sensor was used as a
low-cost sensor to assess NH3 [9]. Wireless sensor has a fast response with measurement
range 1-5 slope of 56.3 mV [10]. However, this sensor does not safety due to located in the
fishpound area. The new revolution of non-chemical material NH3 detector has successful
developed using Un-Ionized Ammonia (UIA) [11, 12]. The four parameters such as pH,
temperature, dissolved oxygen, and ammonium are captured using UIA sensor in freshwater.
The UIA sensor had 95% confident level to measure four parameters. However, the UIA sensor
cannot assess NH3 due to limitation of hardware instrument based on gas-sensing electrode. To
improve the performance UIA sensor, the Micro-ring resonator was proposed to detect NH3
percent value during acid rain event [13]. Micro-ring resonator is a dielectric ring sensor with
smallest refractive index based on optical principal. The Micro-ring resonators have a capability
to change and assess NH3 index from contaminated water to optical wavelength 5000 nm to
10000. The result shows the Micro-ring resonator has a fast response to assess NH3 value](https://image.slidesharecdn.com/5210493-200901085830/85/Low-cost-Fiber-Optic-Chemical-Sensor-Development-for-Fishpond-Application-1-320.jpg)
![TELKOMNIKA, Vol.16, No.6, December 2018, pp.2921~2929
ISSN: 1693-6930, accredited First Grade by Kemenristekdikti, Decree No: 21/E/KPT/2018
DOI: 10.12928/TELKOMNIKA.v16i6.10493 2921
Received July 4, 2018; Revised July 22, 2018; Accepted August 28, 2018
Low-cost Fiber Optic Chemical Sensor Development for
Fishpond Application
Budi Mulyanti1
, Yuski Maolid Rizki Faozan2
, Arjuni B. Pantjawati3
, Roer Eka Pawinanto4
,
Lilik Hasanah5
, Wahyu Sasongko Putro*6
1,2,3,4
Department of Electrical Engineering Education, Universitas Pendidikan Indonesia, 40154,
Bandung, West Java, Indonesia
5
Department of Physics Education, Universitas Pendidikan Indonesia, 40154,
Bandung, West Java, Indonesia
6
Department of Atmospheric and Planetary Sciences, Institut Teknologi Sumatera, 35365,
Jati Agung, Lampung, Indonesia.
*Corresponding author, e-mail: wahyu.putro@aps.itera.ac.id
Abstract
In this study, aimed to develop low-cost sensor based on fiber optic to assess ammonia index for
fishpond application. Here, the simple design was proposed by using Evanescent wave type to assess
ammonia index during acid rain event. The experiment result showed maximum absorption loss with
variation ammonia mass 1~5% with wavelength 1310 nm from Optical Light Source (OLS) is 27.56 dBm
while Optical Spectrum Analyzer (OSA) reached 25.86 dBm. We had calculated RMSE, MAE, and Percent
Error (PE) value both of the device (Low-cost fiber optic chemical sensor and OSA) are 1.692%, 0.916%,
and 98.833% respectively. A good result from low cost fiber optic chemical sensor has successful
developed with lowest production less than 1,455 USD per-year.
Keywords: acid rain, ammonia (NH3), fiber optic, fishpond, low-cost sensor
Copyright © 2018 Universitas Ahmad Dahlan. All rights reserved.
1. Introduction
Nowadays, the acid rain phenomenon is categorized as an environmental hazard
especially in Indonesia. Here, acid rain was composed by hydrocarbon oxides, Ammonia (NH3)
and nitrogen (NOx). The three types of acid rain particles are very harmful for environment and
human health [1]. During acid rain event, the pH level of water quality index is decreased to
4.7~5.6 (moderate) due to NH3 particle increased [2-4]. The conventional acid rain
measurement using pH meter probe is very expensive for Indonesian fish breeders. Many users
of pH meter probe to detect NH3 substance in Indonesia was decreased until 20~30% over July
2010 due to lack of budget [5]. Thus, this study aimed to develop low-cost sensor to assess NH3
over Indonesian fishpond based Fiber Optic Chemical Sensor (FOCS).
The current study of NH3 sensor development to assess contaminated water was
successful obtained by using arrays sensor based on conductive polypyrrole film (called
electrochemically). The deposited electrochemically on glassy carbon surface and internal solid
layer (between sensing membrane and solid electrode surface) has occurred NH3 over polluted
area [6]-[8]. Due to lack of data in real time measurement, the wireless sensor was used as a
low-cost sensor to assess NH3 [9]. Wireless sensor has a fast response with measurement
range 1-5 slope of 56.3 mV [10]. However, this sensor does not safety due to located in the
fishpound area. The new revolution of non-chemical material NH3 detector has successful
developed using Un-Ionized Ammonia (UIA) [11, 12]. The four parameters such as pH,
temperature, dissolved oxygen, and ammonium are captured using UIA sensor in freshwater.
The UIA sensor had 95% confident level to measure four parameters. However, the UIA sensor
cannot assess NH3 due to limitation of hardware instrument based on gas-sensing electrode. To
improve the performance UIA sensor, the Micro-ring resonator was proposed to detect NH3
percent value during acid rain event [13]. Micro-ring resonator is a dielectric ring sensor with
smallest refractive index based on optical principal. The Micro-ring resonators have a capability
to change and assess NH3 index from contaminated water to optical wavelength 5000 nm to
10000. The result shows the Micro-ring resonator has a fast response to assess NH3 value](https://image.slidesharecdn.com/5210493-200901085830/75/Low-cost-Fiber-Optic-Chemical-Sensor-Development-for-Fishpond-Application-1-2048.jpg)
![ ISSN: 1693-6930
TELKOMNIKA Vol. 16, No. 6, December 2018: 2921-2929
2922
index from contaminated water. However, the developing cost of Micro-ring resonator it’s very
expensive to applied in fish breeder.
In this study, we had developed low-cost Fiber Optic Chemical Sensor (FOCS) to
assess NH3 value index from contaminated water based on fiber optic. The advantages of
low-cost FOCS have highest capability and safety due to the device using light source. In near
future, low-cost FOCS sensor was applied as a National Standard of Indonesia to assess NH3
parameter over fishpond contaminated water.
2. Literature Review
2.1. Ammonia
Ammonia (NH3) is composed by three hydrogen atoms and one nitrogen atom. The
physical characteristic of ammonia is colorless, gases, odorless, and alkaline with soluble in
water. The water decomposition in troposphere is affected by two surface meteorological
parameters such as pH and temperature. In aqueous solution, equilibrium exists between
Un-Ionized Ammonia (UIA), NH3, and ionized ammonia NH4
+. Ammonia forms in the water
called UIA [11, 13] while ammonium ion in water called NH4
+. The method to average UIA and
ammonium concentration called total ammonia-nitrogen (TAN) due to different slightly relative
molecular masses, expressed in (1) [10] [14]:
NH4
+ + H2O NH3 + H3O+ (1)
where, H2O and H3O+ are pure water and hydronium ion
2.2. Fiber Optic Chemical Sensor (FOCS)
Since 1960, fiber optic was used to improve quality communication service and internet
bandwidth. However, in this study the fiber optic function has been changed as a Fiber Optic
Chemical Sensor (FOCS) to assess NH3 index [15, 16]. Here, the common FOCS design such
as Distal type probe and Evanescent wave type are used to monitor water quality as shown in
Figure 1.
(a) (b)
Figure 1. The common FOCS design (a) distal type probe and (b) evanescent wavetype
As we can see in Figure 1, the distal type probe and evanescent wave type had
different design to monitor water quality. The differences design of two FOCS located on
indicator layer to assess water quality [17]. In order to assess water quality over fishpond, the
evanescent field type is selected in this study due to cheapest and easy to assess water quality
over Indonesian fishpond. The few parts of fiber optics such as core, cladding, and primary
buffer was peeled to obtain ammonia bias index over contaminated water is showed in Table 1.
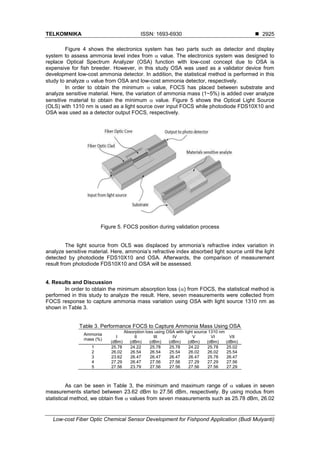
As we can see in Table 1, ammonia bias index over contaminated water have
correlation with ammonia mass. In order to obtain ammonia bias index in contaminated water,
the fiber optic was peeled over middle area. Here, Optical Light Tester (OLT) has given light
source to peeled area to assess ammonia bias index in contaminated water in middle fiber
optic. The OLT have specifications1310 nm wave length with visible light to give light source
into peeled area. Furthermore, we use photodiode sensor type FDS10X10 as an ammonia bias
index detector. Hence to validate the output ammonia bias index from photodiode FDS10X10,](https://image.slidesharecdn.com/5210493-200901085830/85/Low-cost-Fiber-Optic-Chemical-Sensor-Development-for-Fishpond-Application-2-320.jpg)
![TELKOMNIKA ISSN: 1693-6930
Low-cost Fiber Optic Chemical Sensor Development for Fishpond Application (Budi Mulyanti)
2923
the Optical Spectrum Analyzer (OSA) and Optical Power Meter (OPM) was proposed as a
validator device in this study.
Table 1. Ammonia Bias Index Over Contaminated Water
Mass (%) m/mol Kg-1
c/mol L-1
Bias index (n)
0.5 0.295 0.292 1.3332
1 0.593 0.584 1.3335
2 1.198 1.162 1.3339
3 1.816 1.736 1.3344
4 2.447 2.304 1.3349
5 3.090 2.868 1.3354
6 3.748 3.428 1.3359
7 4.420 3.983 1.3365
8 5.106 4.533 1.3370
9 5.807 5.080 1.3376
10 6.524 5.622 1.3381
12 8.007 6.695 1.3393
14 9.558 7.753 1.3404
16 11.184 8.794 1.3416
18 12.889 9.823 1.3428
20 14.679 10.837 1.3440
22 16.561 11.838 1.3453
24 18.542 12.826 1.3465
26 20.630 13.801 1.3477
28 22.834 14.764 1.3490
30 25.164 15.713 1.3502
2.3. Acid Rain
Ammonia (NH3) was selected as a waste product during metabolic process from fish on
normal condition. In small amounts of ammonia were provoke fish condition e.g. stress and grill
damage over fishpond environmental [18], [19]. During acid rain event, the ammonia level was
increased due to chemical pollutant over rainwater. Here, the pollutant substance from industry
(SO2 and NOx) will be contaminate rainwater and brings chemical pollutant trapped in the
atmosphere back to earth when the changing chemical composition of the surface soil and
water [20]-[22] as shown in Figure 2.
Figure 2. Acid rain scheme
As we can see in Figure 2, the contaminated rainwater is going down over fishpond
water with high acidic level. Here, the pH level of fishpond water decreased until 6.34 on July
2010 especially in Indonesia. The five big cities in Indonesia such as Jakarta, Manado,
Pontianak, Bogor, and Surabaya have acidic pH level with average range 4.22 to 6.34 as shown
in Table 2. [23, 24].](https://image.slidesharecdn.com/5210493-200901085830/85/Low-cost-Fiber-Optic-Chemical-Sensor-Development-for-Fishpond-Application-3-320.jpg)

![TELKOMNIKA ISSN: 1693-6930
Low-cost Fiber Optic Chemical Sensor Development for Fishpond Application (Budi Mulyanti)
2927
sensor (photodiode FDS10X10) around + 4,900 USD. Here, we obtain OSA is very expensive
than prototype Low-cost sensor (photodiode FDS10X10). In addition, by using this sensor we
save the budget almost 4800 USD during development low cost sensor. In order to achieve the
objective, we tested low cost sensor and OSA by calculation Nile Tilapia fish
(OreochromisNiloticus) export commodity [25]. Here, the Nile Tilapia fish is a famous commodity
export in Indonesia with 19.7 million USD in 2010 [26]. However, during acid rain event in July
2010, the Nile Tilapia fish has decreased until 31% over five cities in Indonesia [26]. However, in
November to December 2010 commodity export was increased 12% until 4 million USD after
the acid rain event as shown in Table 7.
Table 7. Comparison between Fish Export Commodity with Low-cost Sensor and OSA
Investment during Acid Rain Event over Fishpond Application in Five Cities Indonesia
Month of
2010
Fish Export
Commodity (USD)
Low cost
sensor (USD)
OSA
(USD)
Jan-Feb 4.7 mil. 1,055 26,200
Mar-Apr 4 mil. N/A N/A
May-Jun 1 N/A N/A
Jul-Aug 3 400 1,000
Sep-Oct 3 N/A N/A
Nov-Dec 4 N/A N/A
Total 19.7 mil. 1,455 27,200
As can be seen in Table 7, the comparison between Nile Tilapia export commodity with
low cost sensor development during one-year investment and maintenance over five cities.
Here, the development of low-cost sensor is 1,055 USD while OSA device is 26,200 USD in one
year. In addition, the total cost (including development maintenance fees every six months) is
1,455 for low cost sensor and 27,200 for OSA device, respectively. Furthermore, the high
maintenance cost of OSA due to rewiring cable connection while low cost sensor is replacement
FOCS inside sensitive material over fishpond. The advantages and weakness of both devices
presented in Table 8 in fishpond application. Here, the comparison between OSA device and
FOCS low cost sensor was assessed based advantages and weakness due to accuration and
responsibility both of device.
Table 8. Comparison between OSA and FOCS Low-cost Sensor
Status OSA FOCS Low-cost sensor
Expensive ✓ -
Accurate ✓ ✓
Portable ✓ ✓
Easy Installation - ✓
Eco-Friendly ✓ ✓
Save Energy - ✓
Cheap - ✓
As can be seen in Table 8, the three advantages both of the devices such as accurate,
portable, and eco-friendly was obtained to monitor ammonia index. However, the FOCS low-
cost sensor is cheapest than OSA device due to composed by silica (Si) material. Thus, we
spouse to use FOCS low cost sensor to monitor ammonia index during acid rain event in the
fishpond application. In addition, FOCS low-cost sensor is recommended for professional fish
breeder and as a basic device to monitor acid rain effect over fishpond application in near
future.
5. Conclusion
The FOCS with FDS10X10 photodiode to assess ammonia level in acid rain was
successful developed in this study. The FOCS low-cost sensor is recommended for professional
fish breeder in Indonesia such as Jakarta, Manado, Pontianak, Bogor, and Surabaya during](https://image.slidesharecdn.com/5210493-200901085830/85/Low-cost-Fiber-Optic-Chemical-Sensor-Development-for-Fishpond-Application-7-320.jpg)
![ ISSN: 1693-6930
TELKOMNIKA Vol. 16, No. 6, December 2018: 2921-2929
2928
acid rain event. The advantages of FOCS low-cost sensor have highest capability, safety due to
the device using light source, and cheap 1,455 USD per-year. In validation result showed FOCS
low-cost sensor have a good result (compared by Optical Spectrum Analyzer with light source
1310 nm). Here, FOCS low-cost sensor with photodiode FDS10X10 and Optical Spectrum
Analyzerhave highest accuracy more than 98.8% and 98.1%, respectively. Thus, based on the
result we were successful develop FOCS low-cost sensor with photodiode FDS10X10 to
monitor acid rain effect over fishpond application in near future.
Acknowledgements
We would like to thank the Ministry of Research, Technology and Higher Education of
the Republic of Indonesia (Ristekdikti) for research funding. Dr. Gandi Sugandi and Mr. Dadin
Mahmudin from Reseacrh Centre of Electronics and Communication, Lembaga Ilmu
Pengetahuan Indonesia (LIPI) were supporting this research activity.
References
[1] Manahan S. Environmental chemistry. CRC press. 2017.
[2] Schofield CL. Acid precipitation: effects on fish. Ambio. 1976: 228-230.
[3] Iqbal M, Fuad M, Sukoco H, Alatas H. Wireless Sensor Network Design based on Hybrid Tree-Like
Mesh Topology as a New Platform for Air Pollution Monitoring System. TELKOMNIKA. 2016; 14(3):
1166-1174.
[4] Xibo D, Ru Yue W. Development of Ammonia Gas Leak Detection and Location
Method. TELKOMNIKA Telecommunication Computing Electronics and Control. 2017; 15(3): 1207-
1214.
[5] Iòiguez Garín E, Hiriart D, Nóez Alfonso M, Lazo F, Guillen F, Escoboza T. Measurements of the
optical seeing isotropy at San Pedro M·rtir Observatory. In Journal of Physics: Conference Series
IOP Publishing. 2015; 595(1): 012015.
[6] Le Van Mao, R Al Yassir, N, Lu L, Vu NT, Fortier A. New method for the study of surface acidity of
zeolites by NH 3-TPD, using a pH-meter equipped with an ion selective electrode. Catalysis letters.
2006; 112(1-2): 13-18.
[7] Sombatjinda S, Wantawin C, Techkarnjanaruk S, Withyachumnarnkul B, Ruengjitchatchawalya M.
Water quality control in a closed re-circulating system of Pacific white shrimp (Penaeusvannamei)
postlarvae co-cultured with immobilized Spirulina mat. Aquaculture international. 2014; 22(3):
1181-1195.
[8] Axelrod T, Eltzov E, Marks RS. Bioluminescent bioreporter pad biosensor for monitoring water
toxicity. Talanta. 2016; 149: 290-297.
[9] El Kilani S, El Abdellaoui L, Zbitou J, Terhzaz J, Errkik A, Latrach M. A Low Cost Multiband Microstrip
Antenna for Wireless Applications. TELKOMNIKA Telecommunication Computing Electronics and
Control. 2018; 16(1): 159-165.
[10] Abouelenien F, Elsaidy N, Kirrella GA, Mohamed RA. Hygienic Effect of Supplementing
OrechromisNiloticus Farm with Fresh or Fermented Chicken Manure on: Water, Fish Quality and
Performance. Alexandria Journal for Veterinary Sciences. 2015; 45.
[11] N Xiao B, Liu J, Sun Q, Wang B, Banis MN, Zhao D, Wang Z, Li R, Cui X, Sham TK, Sun X..
Unravelling the Role of Electrochemically Active FePO4 Coating by Atomic Layer Deposition for
Increased High‐Voltage Stability of LiNi0. 5Mn1. 5O4 Cathode Material. Advanced Science. 2015;
2(5).
[12] Tow KH, Chow DM, Vollrath F, Dicaire I, Gheysens T, Thévenaz L. Exploring the Use of Native
Spider Silk as an Optical Fiber for Chemical Sensing. Journal of Lightwave Technology. 2018; 36(4):
1138-1144.
[13] Mulyanti B, Ramza H, Pawinanto RE, Rahman JA, Ab Rahman MS, Putro, WS Hasanah L,
Pantjawati AB. May. Micro–ring resonator with variety of gap width for acid rain sensing application:
preliminary study. In Journal of Physics: Conference Series. IOP Publishing. 2017; 852(1): 012043.
[14] Kayhanian M. Ammonia inhibition in high-solids biogasification: an overview and practical
solutions. Environmental Technology. 1999; 20(4): 355-365.
[15] Cao W, Duan Y. Optical fiber-based evanescent ammonia sensor. Sensors and Actuators B:
Chemical. 2005; 110(2): 252-259.
[16] Subramanian M, Dhayabaran VV, Sastikumar D, Shanmugavadivel M, Development of room
temperature fiber optic gas sensor using clad modified Zn3 (VO4) 2. Journal of Alloys and
Compounds. 2018; 750: 153-163.
[17] Yesmin S, Chetia D, Basumatary T, Singh HK. Fiber Optic Sensor for Detection of Chlorine Level in
Water. In Advances in Communication, Devices and Networking Springer, Singapore. 2018: 429-437.](https://image.slidesharecdn.com/5210493-200901085830/85/Low-cost-Fiber-Optic-Chemical-Sensor-Development-for-Fishpond-Application-8-320.jpg)
![TELKOMNIKA ISSN: 1693-6930
Low-cost Fiber Optic Chemical Sensor Development for Fishpond Application (Budi Mulyanti)
2929
[18] Cong M, Wu H, Yang H, Zhao J, Lv J. Gill damage and neurotoxicity of ammonia nitrogen on the
clam Ruditapesphilippinarum. Ecotoxicology. 2017; 26(3): 459-469.
[19] Sun H, Wang W, Li J, Yang Z. Growth, oxidative stress responses, and gene transcription of juvenile
bighead carp (Hypophthalmichthysnobilis) under chronic‐term exposure of ammonia. Environmental
toxicology and chemistry. 2014; 33(8):1726-1731.
[20] Bandyopadhyay B, Kumar P, Biswas P. Ammonia catalyzed formation of sulfuric acid in troposphere:
the curious case of a base promoting acid rain. The Journal of Physical Chemistry A. 2017; 121(16):
3101-3108.
[21] Crow JC, Ostrand KG, Forstner MR, Catalano M, Tomasso JR. Effects of nitrogenous wastes on
survival of the Barton Springs salamander (Euryceasosorum). Environmental toxicology and
chemistry. 2017.
[22] Seinfeld JH, Pandis SN. Atmospheric chemistry and physics: from air pollution to climate change.
John Wiley & Sons. 2016.
[23] Mulyanti B, Faozan YMR, Putro WS, Pawinanto RE, Budi AHS, Sugandi G, Pantjawati AB.
Development of Fiber Optic Chemical Sensor for Monitoring Acid Rain Level. In IOP Conference
Series: Materials Science and Engineering IOP Publishing. 2018 July; 384(1): 012069.
[24] Achmadi UF, Purwana R. Estimates and Surveys. Hazardous Air Pollutants: Case Studies from Asia.
2016: 77.
[25] Tran N, Rodriguez UP, Chan CY, Phillips MJ, Mohan CV, Henriksson PJG, Koeshendrajana S, Suri
S, Hall S. Indonesian aquaculture futures: An analysis of fish supply and demand in Indonesia to
2030 and role of aquaculture using the AsiaFish model. Marine Policy. 2017; 79: 25-32.
[26] Tran N, Rodriguez UP, Chan CY, Phillips MJ, Mohan CV, Henriksson PJG, Koeshendrajana S, Suri
S, Hall S. Indonesian aquaculture futures: An analysis of fish supply and demand in Indonesia to
2030 and role of aquaculture using the Asia Fish model. Marine Policy. 2017; 79:.25-32.](https://image.slidesharecdn.com/5210493-200901085830/85/Low-cost-Fiber-Optic-Chemical-Sensor-Development-for-Fishpond-Application-9-320.jpg)


![Water quality monitoring in aquaculture[1].pptx](https://cdn.slidesharecdn.com/ss_thumbnails/waterqualitymonitoringinaquaculture1-250407164539-517399e5-thumbnail.jpg?width=640&height=640&fit=bounds)


