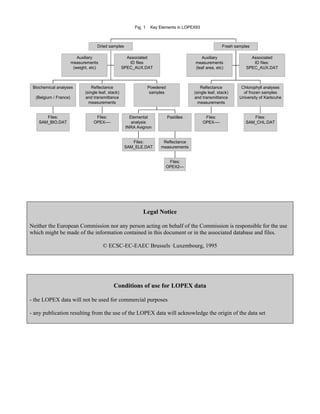
The document describes the structure and contents of the LOPEX93 database, which contains over 2000 reflectance and transmittance spectra of plant leaves measured in 1993 along with corresponding biochemical data. The database is organized into files containing the spectra, auxiliary measurements, biochemical analyses, sample names and identifiers linking these components. Tables included in the document provide explanations of codes and identifiers used in the database files.
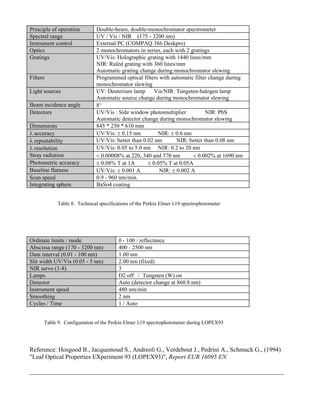
![[1] : Spectrum number: 0001 - 2307
[2] : Spectrum type : 1 = reflectance 2 = transmittance
[3] : State of sample: 0 = fresh 1 = dry
[4] : Type of sample : 1 = single leaf
2 = stack of leaves (eg. 50 leaves)
3 = material in quartz cuvette (eg. needles)
4 = stalks
5 = optically dense material (eg. bark)
6 = pastilles (compressed powder))
[5] : Spectrum block number: 001 - 103
[6] : Average leaf thickness (microns)
or average of averages in the case of leaf stacks
[7] : Fresh weight (grammes)
[8] : Dry weight (grammes)
[9] : Leaf area used in weighing (cm²)
-1 = Measurement not made or not applicable
Extract from data file: SPEC_AUX.DAT
_________________________________
0400 1 1 1 004 208.0 -1.0000 -1.0000 -1.00
0401 2 1 1 004 208.0 -1.0000 -1.0000 -1.00
0402 1 1 2 004 208.0 -1.0000 -1.0000 -1.00
0403 1 0 5 033 -1.0 8.5752 6.8440 -1.00
0404 1 0 5 033 -1.0 8.5752 6.8440 -1.00
0405 1 0 5 033 -1.0 8.5752 6.8440 -1.00
0406 1 0 5 033 -1.0 8.5752 6.8440 -1.00
0407 1 0 5 033 -1.0 8.5752 6.8440 -1.00
0410 1 0 1 034 122.0 .0429 .0147 4.10
0411 2 0 1 034 122.0 .0429 .0147 4.10
0412 1 0 1 034 118.0 .0397 .0119 4.10
0413 2 0 1 034 118.0 .0397 .0119 4.10
0414 1 0 1 034 134.0 .0480 .0157 4.10
0415 2 0 1 034 134.0 .0480 .0157 4.10
0416 1 0 1 034 82.0 .0315 .0079 4.10
0417 2 0 1 034 82.0 .0315 .0079 4.10
0418 1 0 1 034 134.0 .0394 .0149 4.10
0419 2 0 1 034 134.0 .0394 .0149 4.10
0420 1 0 2 034 118.0 .4263 .1223 41.00
0421 1 1 1 002 72.0 -1.0000 -1.0000 -1.00
0422 2 1 1 002 72.0 -1.0000 -1.0000 -1.00
0423 1 1 1 002 90.0 -1.0000 -1.0000 -1.00
0424 2 1 1 002 90.0 -1.0000 -1.0000 -1.00
0425 1 1 1 002 104.0 -1.0000 -1.0000 -1.00
Table 3. Explanation of code used in Spec. / Aux. meas. file (SPEC_AUX.DAT)](https://image.slidesharecdn.com/lopexdbstructurev3-141012163746-conversion-gate01/85/Lopex-db-structure_v3-6-320.jpg)
![[01] = sample number (001-120)
[02] = type of sample 1: Monocotyledon
2: Dicotyledon
3: Gymnosperm
0: Other
[03] = sample status 1: Single sample
2: Double sample (first occurence)
3: Triple sample (first occurence)
[04] = associated spectrum block number (SPEC_AUX.DAT)
[05] = Nitrogen % dry weight ( France)
[06] = Nitrogen % dry weight (Belgium)
[07] = Cellulose % dry weight ( France)
[08] = Cellulose % dry weight (Belgium)
[09] = Lignin % dry weight ( France)
[10] = Lignin % dry weight (Belgium)
[11] = Starch % dry weight ( France)
[12] = Starch % dry weight (Belgium)
-1.00 = No analysis or not applicable
Extract from SAM_BIO.DAT
________________________
001 2 1 026 31.69 31.35 12.10 15.78 3.04 2.16 0.00 2.43
002 1 1 015 24.21 23.69 24.90 30.01 3.45 3.58 0.00 0.40
003 3 1 009 6.26 7.11 25.20 25.49 12.51 12.29 0.00 2.95
004 2 1 038 10.89 11.86 9.10 11.55 4.28 21.29 9.25 5.13
005 2 1 029 20.64 20.41 11.10 14.79 9.25 22.80 0.35 3.89
006 2 1 024 35.52 35.58 12.40 16.82 3.93 1.60 2.74 2.25
007 3 1 012 7.63 7.94 23.50 27.13 10.68 16.44 0.00 0.00
008 2 1 006 7.37 7.42 14.30 16.66 11.92 22.53 0.00 7.28
009 3 1 010 6.06 7.28 25.10 26.76 12.35 14.46 0.00 0.00
010 2 1 019 18.19 17.69 13.90 15.98 9.82 11.34 0.00 1.61
011 2 1 014 33.05 32.66 2.10 11.34 2.68 3.43 3.02 9.99
012 1 1 013 25.31 26.55 21.80 26.60 2.19 3.03 9.42 0.40
013 2 1 032 31.93 30.33 11.00 14.50 2.62 1.09 1.43 3.66
014 2 2 038 13.70 11.96 8.69 10.61 3.49 17.82 8.67 6.17
015 2 2 029 20.66 19.43 11.50 14.98 6.92 19.12 0.94 4.11
016 1 1 039 25.65 24.09 22.60 25.89 2.39 2.75 0.34 0.00
017 3 1 011 7.90 8.58 29.80 32.51 11.34 13.31 0.00 1.63
018 0 1 042 41.07 40.83 10.90 14.15 10.32 6.82 2.17 6.00
019 2 1 005 9.13 9.83 16.80 19.40 13.17 26.22 3.38 4.01
020 2 1 031 16.99 17.01 22.60 25.56 15.56 16.59 0.70 4.86
021 2 1 006 10.48 11.82 21.90 26.81 20.09 16.80 6.73 2.03
022 2 1 002 25.86 25.13 15.30 18.27 17.36 16.73 2.34 6.52
023 2 1 001 17.02 16.17 23.20 26.29 23.31 18.13 0.12 3.64
024 2 1 017 35.75 34.89 8.30 9.06 3.28 12.49 0.00 0.83
Table 4. Explanation of code used in Sample / Biochemical file (SAM_BIO.DAT)](https://image.slidesharecdn.com/lopexdbstructurev3-141012163746-conversion-gate01/85/Lopex-db-structure_v3-7-320.jpg)
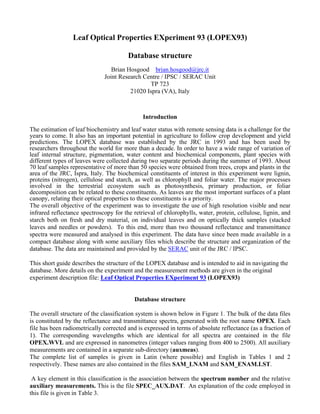
![[1] = sample number (001 - 120)
[2 - 6] = reflectance spectrum number of fresh single leaf (eg. OPEX0306)
[7 - 11] = transmittance spectrum number of fresh single leaf (eg. OPEX0307)
[12] = reflectance spectrum number of fresh leaf stack (eg. OPEX0316)
[13 - 17] = reflectance spectrum number of fresh optically thick material
[18 - 22] = reflectance spectrum number of dry single leaf (eg. OPEX0489)
[23 - 27] = transmittance spectrum number of dry single leaf (eg. OPEX490)
[28] = reflectance spectrum number of dry leaf stack (eg. OPEX0499)
[29 - 33] = reflectance spectrum number of dry optically thick material
[34 - 36] = reflectance spectrum number of pastilles (eg. OPEX2005)
-1 = measurement not made or not applicable
Extract from SAM_SPEC.DAT
_________________________
001 0306 0308 0310 0312 0314 0307 0309 0311 0313 0315 0316 -1 -1 -1 -1 -1 -1 -1 -1 -1 -1 -1 -1 -1 -1 -1 -1 -1 -1 -1 -1 -1 2003 2004 2005
002 0163 0165 0167 0169 0171 0164 0166 0168 0170 0172 0173 -1 -1 -1 -1 -1 -1 -1 -1 -1 -1 -1 -1 -1 -1 -1 -1 -1 -1 -1 -1 -1 2006 2007 2008
003 -1 -1 -1 -1 -1 -1 -1 -1 -1 -1 -1 0111 0112 0113 0114 0115 -1 -1 -1 -1 -1 -1 -1 -1 -1 -1 -1 0437 0438 0439 0440 0441 -1 -1 -1
004 0522 0524 0526 0528 0530 0523 0525 0527 0529 0531 0532 -1 -1 -1 -1 -1 0768 0770 0772 0774 0776 0769 0771 0773 0775 0777 0778 -1 -1 -1 -1 -1 2013 2014 2015
005 0335 0337 0339 0341 0343 0336 0338 0340 0342 0344 0345 -1 -1 -1 -1 -1 -1 -1 -1 -1 -1 -1 -1 -1 -1 -1 -1 -1 -1 -1 -1 -1 2016 2017 2018
006 0288 0290 0292 0294 0296 0289 0291 0293 0295 0297 0298 -1 -1 -1 -1 -1 0489 0491 0493 0495 0497 0490 0492 0494 0496 0498 0499 -1 -1 -1 -1 -1 -1 -1 -1
007 -1 -1 -1 -1 -1 -1 -1 -1 -1 -1 -1 0134 0135 0136 0137 0138 -1 -1 -1 -1 -1 -1 -1 -1 -1 -1 -1 0745 0746 0747 0748 0749 2019 2020 2021
008 0073 0075 0077 0079 0081 0074 0076 0078 0080 0082 0084 -1 -1 -1 -1 -1 0454 0456 0458 0460 0462 0455 0457 0459 0461 0463 0464 -1 -1 -1 -1 -1 2022 2023 2024
009 -1 -1 -1 -1 -1 -1 -1 -1 -1 -1 -1 0117 0118 0119 0120 0121 -1 -1 -1 -1 -1 -1 -1 -1 -1 -1 -1 0442 0443 0444 0445 0446 2025 2026 2027
Table 5. Explanation of code used in Sample / Spectrum file (SAM_SPEC.DAT)
Note: Special case is sample no.56 (plane bark)
[2-6] = reflectance of inner side of fresh bark
[13-17] = reflectance of outer side of fresh bark
[29-33] = reflectance of outer side of dry bark](https://image.slidesharecdn.com/lopexdbstructurev3-141012163746-conversion-gate01/85/Lopex-db-structure_v3-8-320.jpg)
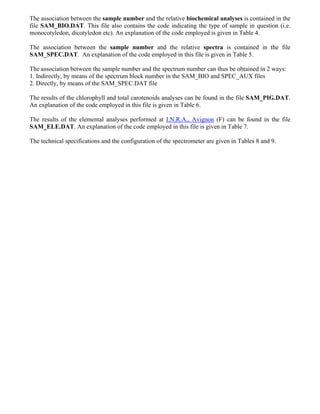
![[1] = sample number
[2] = type of sample 1: fresh leaf (flmr / flmt / flmri --> 66 spectra)
2: dry leaf (dlmr / dlmt / dlmri --> 60 spectra)
3: fresh needle (fnmr --> 10 spectra)
4: dry needle (dnmr --> 10 spectra)
5: fresh stalk (fsmr --> 12 spectra)
6: dry stalk (dsmr --> 7 spectra)
7: powder (pwmr --> 11 spectra)
[3] = type of plant (1: Monocotyledon 2: Dicotyledon 3: Gymnosperm)
[4-5] = Chlorophyll a content per fresh weight (mg / g)
[6] = average value
[7-8] = Chlorophyll b content per fresh weight (mg / g)
[9] = average value
[10-11] = Carotenoids content per fresh weight (mg / g)
[12] = average value
[13-14] = Chlorophyll a content per dry weight (mg / g)
[15] = average value
[16-17] = Chlorophyll b content per dry weight (mg / g)
[18] = average value
[19-20] = Carotenoids content per dry weight (mg / g)
[21] = average value
-1 = measurement not made or not applicable
Extract from SAM_PIG..DAT
__________________________
001 1 1 2 2.61 2.97 2.79 0.94 1.00 0.97 0.51 0.56 0.54 10.01 11.40 10.71 3.61 3.86 3.74 1.94 2.15 2.05
002 1 2 1 2.42 2.32 2.37 0.55 0.52 0.54 0.68 0.69 0.69 9.59 9.20 9.40 2.19 2.05 2.12 2.72 2.74 2.73
003 3 1 3 0.67 0.64 0.66 0.27 0.23 0.25 0.22 0.21 0.22 0.82 0.77 0.80 0.32 0.29 0.31 0.26 0.25 0.26
003 4 1 3 -1 -1 -1 -1 -1 -1 -1 -1 -1 -1 -1 -1 -1 -1 -1 -1 -1 -1
004 1 3 2 0.88 0.89 0.89 0.24 0.25 0.25 0.34 0.35 0.35 2.95 2.97 2.96 0.81 0.84 0.83 1.14 1.16 1.15
004 2 1 2 1.34 1.41 1.38 0.22 0.18 0.20 0.19 0.21 0.20 3.67 3.87 3.77 0.61 0.48 0.54 0.53 0.58 0.55
005 1 4 2 3.35 3.31 3.33 1.05 1.03 1.04 0.83 0.83 0.83 8.72 8.61 8.66 2.74 2.69 2.72 2.16 2.15 2.16
006 1 5 2 1.17 1.02 1.10 0.40 0.36 0.38 0.36 0.31 0.34 11.50 10.04 10.77 3.92 3.54 3.73 3.51 3.05 3.28
006 2 2 2 3.12 3.20 3.16 0.44 0.40 0.42 0.35 0.37 0.36 3.47 3.56 3.52 0.48 0.45 0.47 0.39 0.41 0.40
Table 6. Explanation of code used in Sample / Pigments file (SAM_PIG.DAT)](https://image.slidesharecdn.com/lopexdbstructurev3-141012163746-conversion-gate01/85/Lopex-db-structure_v3-9-320.jpg)
![[1] = sample number
[2-4] = Carbon (% dry matter)
[5] = Carbon (average value)
[6-8] = Hydrogen (% dry matter)
[9] = Hydrogen (average value)
[10-12] = Oxygen (% dry matter)
[13] = Oxygen (average value)
[14-16] = Nitrogen (% dry matter)
[17] = Nitrogen (average value)
-1 = measurement not made or not applicable
Extract from SAM_ELE.DAT
_______________________
001 46.30 46.96 -1.00 46.63 6.13 6.23 -1.00 6.18 36.82 37.96 -1.00 37.39 5.22 5.06 -1.00 5.14
002 47.32 46.50 47.26 47.03 6.19 6.13 6.63 6.31 36.76 40.71 39.57 39.02 3.32 3.30 3.30 3.31
003 -1.00 -1.00 -1.00 -1.00 -1.00 -1.00 -1.00 -1.00 -1.00 -1.00 -1.00 -1.00 -1.00 - 1.00 -1.00 -1.00
004 46.14 45.82 46.02 45.99 5.56 5.85 5.56 5.65 44.09 43.68 -1.00 43.88 2.00 1.87 -1.00 1.94
005 45.82 46.08 45.95 45.96 5.94 -1.00 -1.00 5.95 37.83 39.83 39.30 38.99 3.32 3.16 -1.00 3.24
006 -1.00 -1.00 -1.00 -1.00 -1.00 -1.00 -1.00 -1.00 -1.00 -1.00 -1.00 -1.00 -1.00 - 1.00 -1.00 -1.00
007 50.46 50.73 50.57 50.59 6.61 6.83 7.04 6.83 40.60 41.28 -1.00 40.94 1.43 1.22 1.10 1.25
008 49.07 48.67 47.75 48.50 6.26 6.23 5.99 6.16 39.66 40.32 -1.00 39.99 1.41 1.17 -1.00 1.29
009 51.93 51.83 51.76 51.84 7.51 7.53 7.00 7.35 38.91 40.92 39.34 39.72 1.66 1.28 -1.00 1.47
010 47.32 46.77 47.01 47.03 6.93 6.89 5.69 6.50 38.54 37.02 -1.00 37.78 2.94 2.72 -1.00 2.83
011 46.21 46.86 46.96 46.68 6.13 6.43 -1.00 6.28 36.52 37.33 -1.00 36.93 5.09 5.26 5.11 5.15
012 46.96 47.06 47.08 47.03 7.35 6.43 6.11 6.63 37.32 37.66 -1.00 37.49 4.31 4.41 -1.00 4.36
013 42.82 43.66 43.83 43.44 5.68 5.26 5.89 5.61 37.53 39.03 -1.00 38.28 4.88 4.98 -1.00 4.93
014 -1.00 -1.00 -1.00 -1.00 -1.00 -1.00 -1.00 -1.00 -1.00 -1.00 -1.00 -1.00 -1.00 - 1.00 -1.00 -1.00
015 -1.00 -1.00 -1.00 -1.00 -1.00 -1.00 -1.00 -1.00 -1.00 -1.00 -1.00 -1.00 -1.00 - 1.00 -1.00 -1.00
016 46.22 46.78 45.97 46.32 7.18 5.84 6.00 6.34 38.37 38.31 -1.00 38.34 3.74 3.56 -1.00 3.65
017 50.20 50.06 49.49 49.92 7.89 6.14 6.74 6.92 42.21 42.93 -1.00 42.57 1.27 1.51 -1.00 1.39
Table 7. Explanation of code used in Sample / Elements file (SAM_ELE.DAT)](https://image.slidesharecdn.com/lopexdbstructurev3-141012163746-conversion-gate01/85/Lopex-db-structure_v3-10-320.jpg)