Mixture of hairy woodrose (Merremia aegyptia L.) with carnauba straw (Coperni...
Simple linear Model Scientia 2015
1. Scientia Horticulturae 184 (2015) 36–39
Contents lists available at ScienceDirect
Scientia Horticulturae
journal homepage: www.elsevier.com/locate/scihorti
A simple linear model for leaf area estimation in Persian walnut
(Juglans regia L.)
I. Keramatloua,1
, M. Sharifanib,∗
, H. Sabouric,2
, M. Alizadeha,1
, B. Kamkard,3
a
Department of Horticultural Sciences, Gorgan University of Agricultural Sciences and Natural Resources, Gorgan 49189-43464, Iran
b
Department of Horticultural Sciences, Gorgan University of Agricultural Sciences and Natural Resources, Basij SQ., Gorgan 49138-43464, Golestan, Iran
c
Department of Plant Production, Gonbad Kavous University, Gonbad-e Kavus 49717-99151, Iran
d
Department of Agronomy Sciences, Gorgan University of Agricultural Sciences and Natural Resources, Basij SQ., Gorgan 49138-43464, Iran
a r t i c l e i n f o
Article history:
Received 16 July 2014
Received in revised form 2 December 2014
Accepted 17 December 2014
Keywords:
Persian walnut
Leaf area
Leaflet length
Leaflet width
Linear measurements
a b s t r a c t
Accurate non-destructive leaf area estimation is a useful subject of study for the fields of applied plant
science, physiology and plant genetic engineering. The relationship between leaf area and fruit is very
important in fruit crops. It determines the nut size and nut filling potential. The aim of this paper is to
produce a statistical model based on linear measurements such as leaflet length and width in combina-
tion with other simple parameters. Measurements of leaf length, width and surface area of the leaflets
were achieved using digital photography. Digital images of Persian walnut (Juglans regia L.) leaves were
prepared in August 2011 for 14 genotypes and in 2012 for one genotype under open field conditions.
Results of regression analysis indicated several models are suitable to estimate leaf area of Persian wal-
nut. The linear model with LW as an independent variable (LA = 1.11 + 0.69LW) with accurate estimation
(maximum R2
= 0.99 and lowest MSE = 10.09) was the best model. To determine the leaf area, the ear-
liest measurements to take would be the length and width of leaflets. Total area of the leaflets is then
reported as leaf area. In conclusion, in walnut, number of leaflets and leaflet area should be involved in
the estimation of leaf area.
Published by Elsevier B.V.
1. Introduction
Leaf area (LA) is a measurable trait indicating status of growth
and development in plants. In addition, this variable reveals
some physiological characters of fruit trees. These include light
interception, photosynthetic efficiency, respiration, evaporation,
transpiration, fruit set, water balance and response to fertilizers
(Syvertsen et al., 2003). Thus, in turn LA determination could enable
researchers to clarify attributes of fruit yield and quality. Studies
in several fruit crops indicated the close relationship of leaf sur-
face area with fruit and nut quality (Marquard, 1987; Santesteban
and Royo, 2006; Torri et al., 2009) fruit maturity (Usenik et al.,
2008) fruit weight in chestnut and kiwifruit (Famiani et al., 2000).
∗ Corresponding author. Tel.: +98 1732423303.
E-mail addresses: iskaramatlou@gmail.com (I. Keramatlou),
mmsharif2@gmail.com (M. Sharifani), saboriho@yahoo.com (H. Sabouri),
behnamkamkar@yahoo.com (B. Kamkar).
1
Tel.: +98 9112740812.
2
Tel.: +98 172 2237508.
3
Tel.: +98 1732427060.
Further, the prediction of leaf area is extended to different crops
such as mango (Ghoreishi et al., 2012) and pomegranate (Meshram
et al., 2012). The relationship between LA and fruit set stated as
determiner tool for the elucidating nut size and filling in pecans,
(Torri et al., 2009). In the cultivar ‘Mohawk’, it has been observed
that a leaf:fruit ratio of 4, equivalent to a LA of 1150 cm2, pro-
duced better quality nuts than a leaf:fruit ratio of 2. Furthermore,
in the cultivar ‘Western’, a leaf:fruit ratio of 2, equivalent to an LA
of 575 cm2, was needed for nut filling (Marquard, 1987).
(Lampinen et al., 2011) showed that previous year spur leaf area
was strongly related to spur viability and its flowering; specifi-
cally, greater leaf area in one year led to the higher probability of
spurs survival into the next year. Therefore, higher leaf area caused
higher probability for the spurs to bear more flowers. Ratio of LA to
fruit mass ratio determined the time of veraison in Sauvignon Blanc
and Pinot Noir grapevines (Parker et al., 2014). Finally, LA is essen-
tial to evaluate vegetative growth and to estimate crop production
potential.
Leaf area can be measured by destructive as well as non-
destructive techniques. Many methods have been devised to
facilitate the measurement of leaf area. These methods included
drawing, blueprinting, photographing, image analysis and use
http://dx.doi.org/10.1016/j.scienta.2014.12.017
0304-4238/Published by Elsevier B.V.
2. I. Keramatlou et al. / Scientia Horticulturae 184 (2015) 36–39 37
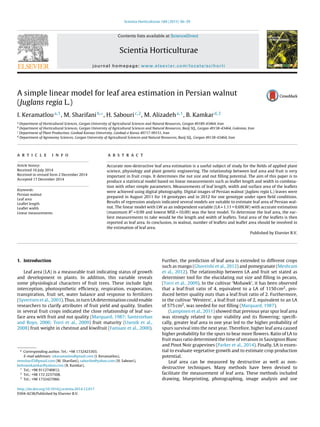
Fig. 1. Indicating measurements of Persian walnut leaflet length (L) and width (W).
of a conventional planimeter or an electronic leaf area meter.
However, these methods mostly require the excision of leaves from
the plant. In addition, the processing is time-consuming and the
equipment required to perform such measurements is generally
expensive. Therefore, another simple, inexpensive, rapid, reliable
and non-destructive method for estimating leaf area is required for
experiments and researchers.
A common approach for leaf area estimation is to develop ratios
and regression estimators by using easily measured leaf parameters
such as leaf length and width (Schwarz and Kläring, 2001). Various
combinations of measurements and various models relating length
and width to area have been developed for many horticultural crops
such as grape (Williams and Martinson, 2003) cherry (Demirsoy
and Demirsoy, 2003), peach (Demirsoy et al., 2004), strawberry
(Demirsoy et al., 2005), hazelnut (Cristofori et al., 2007), small fruits
(Fallovo et al., 2008), pecan (Torri et al., 2009), Iranian table grapes
(Eftekhari et al., 2011) and rose (Gao et al., 2012), while a suit-
able method to quickly estimate leaf area is still lacking for Persian
walnut (Juglans regia L.), which has compound leaves, normally con-
sisting of opposite leaflets on a central rib (rachis) and one terminal
leaflet resulting in an odd number of leaflets per leaf (Fig. 1).
The accuracy of the predictions depends on the variation of
leaflet shape among genotypes. Since leaflet shape (length:width
ratio) may vary among different genetic provenances, a reliable
model of non-destructive estimation of leaf area is required. Such
a model may be utilized as a tool in physiological studies of Persian
walnut leaves independently of the genetic materials. Therefore,
the aims of this research were to: (1) design and evaluate a num-
ber of regression models to estimate walnut LA by non-destructive
methods; and (2) to assess the reliability of the model on an inde-
pendent set of data from multiple genotypes grown under different
environmental conditions.
2. Materials and methods
The present study was performed in a Persian walnut orchard
located at Golestan province, Minoudasht region, Iran (latitude
37◦04 N; longitude 55◦32 E; altitude 1060 m) in a silt loam soil
type. The annual mean temperature was 16.3 ◦C, with annual mean
rainfall of 690 mm.
2.1. Data collection
Fourteen Persian walnut (J. regia L.) accessions propagated
through seed were selected and used to develop a leaf area predic-
tion model. Genotypes were coded as G1 to G14. These accessions
were selected as a representative sampling of the many walnut
genotypes available throughout the Northeastern Iran. Sampling
was performed in early August when the leaves were fully devel-
oped. The walnut trees used within the experiment had ages of 20
years old. Peripheral leaves from the middle portion of shoots that
developed during the same growing season were harvested. Leaves
were selected randomly from different levels of the tree canopy
ranging from 2 to 3 m from the soil level and all around the crown.
Ten leaves were sampled from each accession, each with 7 to 11
leaflets broad elliptic form with entire margin. According to Torri
et al., 2009, leaves were kept refrigerated in plastic bags at 4 ◦C for
24 h until the determinations were made. An image was captured
where a sample was placed on a fixed white background along with
a ruler, using a digital camera (Sony Cyber-Shot DSC-W290 with a
resolution of 12.1 megapixel; Sony, Tokyo). Then the width (W) was
measured in the medium part of the leaflet and the length (L) was
determined from the base to the apex of the leaflet lamina (Fig. 1)
using a Digimizer image analysis software (version 4). The area of
each leaflet (LA in cm2) was measured using the same software. In
total, 1124 walnut leaflets from 14 accessions were measured for
leaflet L and W and LA parameters.
2.2. Statistical methodology
The dependent variable (LA) was regressed with different inde-
pendent variables, including L, W, L2, W2, (L + W)2 and the product
L × W. Root mean squared error (RMSE) and the values of the
constants (a) and coefficients (b) were also reported, and the final
model was selected based on the combination of the highest coeffi-
cient of determination (R2) and the lowest RMSE. Moreover, using
two measurements (i.e., length and width) introduced potential
problems of co-linearity, resulting in poor precision in the esti-
mates of the corresponding regression coefficients. For detecting
co-linearity, the variance inflation factor (VIF) (Marquaridt, 1970)
and the tolerance values (T), were calculated (Gill, 1986).
VIF =
1
1 − r2
(1)
T =
1
VIF
(2)
where r is the correlation coefficient between length and width of
leaflet. If the VIF value was higher than 10 or if T value was smaller
than 0.10 then co-linearity may have more than a trivial impact
on the estimates of the parameters, and consequently one of those
should be excluded from the model (Gill, 1986).
2.3. Model validation
In order to validate the developed model and to increase practi-
cal applicability in different environmental conditions, a validation
experiment was conducted in the summer 2012 on leaflet samples
of G15 genotype grown at the Experimental Farm of Minoudasht
Agriculture Office (latitude 37◦13 N, longitude 55◦22 E, altitude
211 m). To validate the model, 136 leaflets of the G15 genotype
were used to determine leaf width, length as well as leaf area by
the previously described procedures. Leaf area of individual leaflets
was predicted using the best model from the calibration experi-
ment and was compared with the actual leaf area. Moreover, to
compare the predicted leaf area (PLA) to the observed leaf area
(OLA) for the genotype G15 during 2012 growing season, graphi-
cal procedures (Martin Bland and Altman, 1986) were used. Scatter
3. 38 I. Keramatlou et al. / Scientia Horticulturae 184 (2015) 36–39
Fig. 2. Relation between leaflet area and leaflet length × leaflet width of single
leaflets from 14 Persian walnut genotypes measured in the calibration experiment
held by 2011. The equation for the regression line is LA = 1.11 + 0.69LW.
plots of values for the PLA against the OLA are presented in Fig. 2.
SPSS was used to evaluate the linear relationship for OLA and PLA
of G15.
3. Results and discussion
As a preliminary step to model calibration, the degree of co-
linearity among leaf width and length was analyzed. The VIF ranged
from 5.2 to 7.4 and T values ranged from 0.13 to 0.21, depending on
genotypes. In all genotypes, VIF was <10 and T was >0.10, showing
that the co-linearity between length and width can be considered
negligible and these variables can be both included in the model
(Gill, 1986).
3.1. Model parameterization
Regression analysis demonstrated a strong relationship
(P < 0.001) between leaf area (LA) and mid vein length (L), leaf
width (W), the product of length and width (LW), the square of
the sum of length and width (L + W)2, the square of length (L2)
and the square of width (W2) (Table 1). This is in agreement with
previous studies (Cristofori et al., 2007; Mendoza-de Gyves et al.,
2007; Peksen, 2007; Rouphael et al., 2007); on non-destructive
models for predicting leaf area using measurement of leaf length
and width. However, suitability of these models varied based on
the selection criteria previously described. Except for model 1,
all models produced a coefficient of determination (R2) equal to
or greater than 0.90 (Table 1). Based on selection criteria previ-
ously described (higher R2, lower MSE), this study demonstrated
that models with a sole measurement of leaf length (models 1)
were less acceptable for estimating leaf area, due to their lowest
coefficient of determination (R2), higher MSE values. To find a
model to predict leaf area accurately for plants of all genotypes
the product of leaf length × leaf width was used as an independent
variable (model 3). We preferred this model (LA = 1.11 + 0.69LW)
for its accuracy: highest R2 (0.99), smallest MSE (10.1).
Based on the above considerations, both leaflet length and width
measurements were necessary to estimate Persian walnut leaf area
accurately. The results reported in the present research were in
accordance with previous studies on some species of fruit trees
such as hazelnut (Cristofori et al., 2007), apple (Palmer, 1987), and
kiwifruit (Mendoza-de Gyves et al., 2007), where the leaf area esti-
mation models were developed using the multiplicative equation
(length × width).
The shape coefficient (regression coefficient of model 3) can be
described by a shape between an ellipse (0.78) and a triangle (0.5)
of the same length and maximum width. Our shape coefficient
(0.69) agreed closely with those calculated for other crops. Val-
ues of 0.74 have been reported for hazelnut (Cristofori et al., 2007)
and 0.59 for grapevine (Montero et al., 2000). The applied model
analyzed the possible genotype differences among the samples.
Regression coefficients of the genotypes were slightly different
(data not shown). However, when an equation derived for a sin-
gle cultivar versus the overall model was compared, no significant
differences were found. These results suggest that a universal leaf
area estimation model for Persian walnut is plausible, unless other
genotypes differ greatly in leaf morphology from those used in this
experiment.
3.2. Model evaluation
Comparisons between observed leaflet area (OLA) versus pre-
dicted leaflet area (PLA) using model 3 (LA = 1.11 + 0.69LW) for the
validation set were derived from 2012 experiment on G15 geno-
type. The results indicated a close correlation (r = 0.99, P < 0.0001),
between OLA and PLA. Furthermore, the PLA data were very close
to the OLA values (Fig. 3.).
Finally, it may be concluded that the length–width model can
provide more accurate estimations of Persian walnut leaf area
across genotypes and environments than those based on single
length or width measurement. Leaf width and mid vein length are
easy access parameters in field, greenhouse and pot experiments.
Therefore use of this equation would enable researchers to make
non-destructive or repeated measurements on the same leaves.
Such a model may be accurately utilized to estimate the leaf area of
walnut trees without the necessity of application of any expensive
instruments, e.g., a leaf area planimeter or digital camera or image
measurement software.
Further determination of total leaf area in different periods of
Persian walnut growth possibly can reveal the status of water bal-
ance, potential of fruit set, fruit maturity, kernel quality and rate of
photosynthesis. “In addition, there is a need to develop an instru-
ment with equipped with software that can provide projections of
Table 1
Fitted coefficient (b) and constant (a) values of the models used to estimate the walnut leaf area (LA) of single leaves from leaflet length (L) and width (W) measurements.
Model no. Form of model tested Fitted coefficient and constant R2b RMSE
a b
1 LA = a + b (L) −29.5(0.87)a
6.93 (0.07) 0.88 115
2 LA = a + b (W) −34.5 (0.60) 15.6 (0.10) 0.94 51.9
3 LA = a + b (LW) 1.11 (0.16) 0.69 (0.002) 0.99 10.1
4 LA = a + b (L + W)2
0.72 (0.22) 0.15 (0.0006) 0.98 18.0
5 LA = a + b (L2
) 1.99 (0.45) 0.32 (0.002) 0.92 75.1
6 LA = a + b (W2
) 5.87 (0.42) 1.30 (0.01) 0.92 72.0
a
Standard errors in parenthesis; L and W were in cm.
b
Coefficient of determination (R2
), mean square errors (MSE in cm2
) of the various models are also given. All data were derived from the calibration experiment held by
2011 (n = 1124 leaves).
4. I. Keramatlou et al. / Scientia Horticulturae 184 (2015) 36–39 39
Fig. 3. Observed leaflet area (OLA) versus predicted leaflet area (PLA), during 2012
(validation experiment) using model 3, LA = 1.11 + 0.69LW, LA is individual leaf area
(cm2
) and LW is product of leaflet length (cm) × leaflet width (cm). Solid line repre-
sents linear regression lines of Model 3. Dotted lines represent the 1:1 relationship
between the OLA and PLA.
expected future trends of fruit development based on calculated
leaf areas.”
Acknowledgments
The authors would like to express their gratitude toward
Prof. Daniel Potter at the University of California, Davis, for
his comments and valuable suggestions. Also thanks go to Mr.
Ahmad Nouri, because of his assistance during performance of the
experiments.
References
Cristofori, V., Rouphael, Y., Gyves, E.M.-d., Bignami, C., 2007. A simple model for
estimating leaf area of hazelnut from linear measurements. Sci. Hortic. 113,
221–225.
Demirsoy, H., Demirsoy, L., 2003. A validated leaf area prediction model for some
cherry cultivars in Turkey. Pak. J. Bot. 35, 361–367.
Demirsoy, H., Demirsoy, L., Öztürk, A., 2005. Improved model for the non-destructive
estimation of strawberry leaf area. Fruits 60, 69–73.
Demirsoy, H., Demirsoy, L., Uzun, S., Ersoy, B., 2004. Non-destructive leaf area esti-
mation in peach. Eur. J. Hortic. Sci. 69, 144–146.
Eftekhari, M., Kamkar, B., Alizadeh, M., 2011. Prediction of leaf area in some Iranian
table grape (Vitis vinifera L.) cuttings by a non-destructive and simple method.
Sci. Res. Rep. 1.
Fallovo, C., Cristofori, V., de-Gyves, E.M., Rivera, C.M., Rea, R., Fanasca, S., Bignami, C.,
Sassine, Y., Rouphael, Y., 2008. Leaf area estimation model for small fruits from
linear measurements. HortScience 43, 2263–2267.
Famiani, F., Proietti, P., Palliotti, A., Ferranti, F., Antognozzi, E., 2000. Effects of leaf
to fruit ratios on fruit growth in chestnut. Sci. Hortic. 85, 145–152.
Gao, M., Van der Heijden, G., Vos, J., Eveleens, B., Marcelis, L., 2012. Estimation of leaf
area for large scale phenotyping and modeling of rose genotypes. Sci. Hortic. 138,
227–234.
Ghoreishi, M., Hossini, Y., Maftoon, M., 2012. Simple models for predicting leaf area
of mango (Mangifera indica L.). J. Biol. Earth Sci. 2, B45–B53.
Gill, J., 1986. Outliers, residuals, and influence in multiple regression. J. Anim. Breed.
Genet. 103, 161–175.
Lampinen, B.D., Tombesi, S., Metcalf, S.G., DeJong, T.M., 2011. Spur behaviour in
almond trees: relationships between previous year spur leaf area, fruit bearing
and mortality. Tree Physiol. 31 (7), 700–706.
Marquard, R., 1987. Influence of leaf to fruit ratio on nut quality, shoot carbohydrates,
and photosynthesis of pecan. HortScience (USA) 22, 256–257.
Marquaridt, D.W., 1970. Generalized inverses, ridge regression, biased linear esti-
mation, and nonlinear estimation. Technometrics 12, 591–612.
Martin Bland, J., Altman, D., 1986. Statistical methods for assessing agreement
between two methods of clinical measurement. Lancet 327, 307–310.
Mendoza-de Gyves, E., Rouphael, Y., Cristofori, V., Mira, F.R., 2007. A non-destructive,
simple and accurate model for estimating the individual leaf area of kiwi (Actini-
dia deliciosa). Fruits 62, 171–176.
Meshram, D.T., Gorantiwar, S.D., Singh, N.V., Suroshe, S.S., 2012. Non-destructive
leaf area estimation in Pomegranate cv. Bhagwa (Punica granatum L.). Indian J.
Hortic. 69, 163–167.
Montero, F., De Juan, J., Cuesta, A., Brasa, A., 2000. Nondestructive methods to esti-
mate leaf area in Vitis vinifera L. HortScience 35, 696–698.
Palmer, J., 1987. Measurement of leaf area in apple trees. J. Hortic. Sci. 62, 5–10.
Parker, A., Hofmann, R., Leeuwen, C., McLachlan, A., Trought, M., 2014. Leaf area to
fruit mass ratio determines the time of veraison in Sauvignon Blanc and Pinot
Noir grapevines. Aust. J. Grape Wine Res. 20, 422–431.
Peksen, E., 2007. Non-destructive leaf area estimation model for faba bean (Vicia
faba L.). Sci. Hortic. 113, 322–328.
Rouphael, Y., Colla, G., Fanasca, S., Karam, F., 2007. Leaf area estimation of sunflower
leaves from simple linear measurements. Photosynthetica 45, 306–308.
Santesteban, L.G., Royo, L.B., 2006. Water status, leaf area and fruit load influence
on berry weight and sugar accumulation of cv. ‘Tempranillo’ under semiarid
conditions. Sci. Hortic. 109, 60–65.
Schwarz, D., Kläring, H.-P., 2001. Allometry to estimate leaf area of tomato. J. Plant
Nutr. 24, 1291–1309.
Syvertsen, J.P., Goni, C., Otero, C., 2003. Fruit load and canopy shading affect leaf
characteristics and net gas exchange of ‘Spring’ navel orange trees. Tree Physiol.
23 (13), 899–906.
Torri, S.I., Descalzi, C., Frusso, E., 2009. Estimation of leaf area in pecan cultivars
(Carya illinoinensis). Cienc. Invest. Agr. 36, 53–58.
Usenik, V., Fabˇciˇc, J., ˇStampar, F., 2008. Sugars, organic acids, phenolic composition
and antioxidant activity of sweet cherry (Prunus avium L.). Food Chem. 107,
185–192.
Williams, L., Martinson, T.E., 2003. Non-destructive leaf area estimation of ‘Niagara’
and ‘DeChaunac’ grapevines. Sci. Hortic. 93, 493–498.