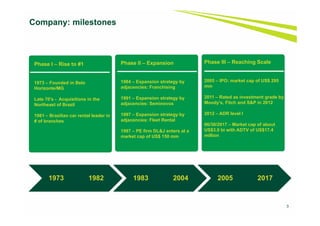
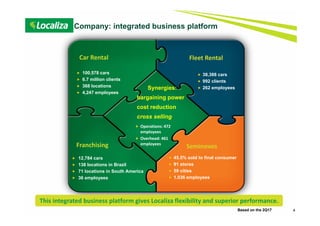
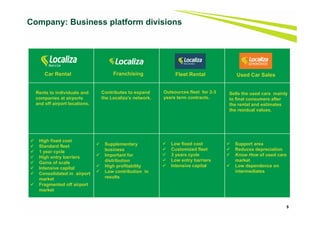
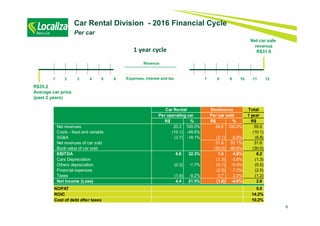
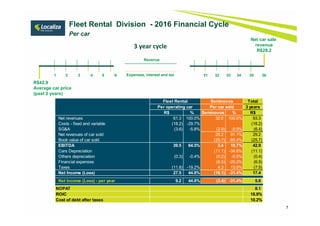
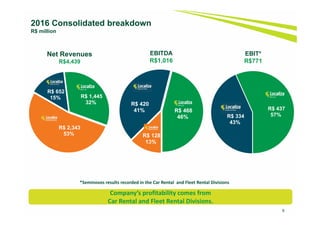
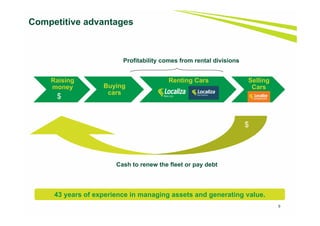
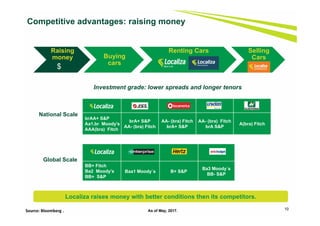
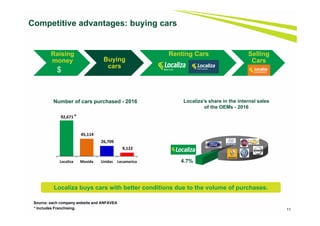
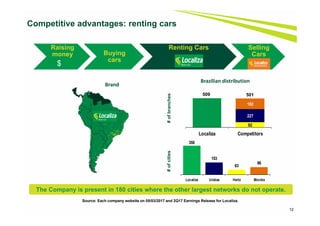
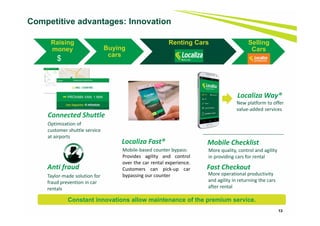
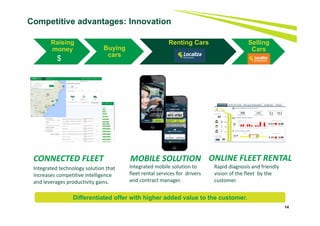
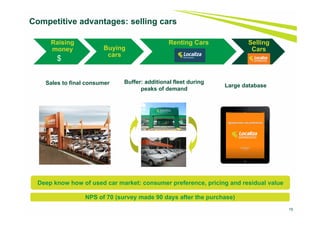
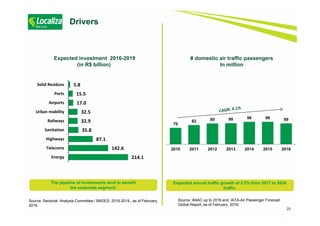
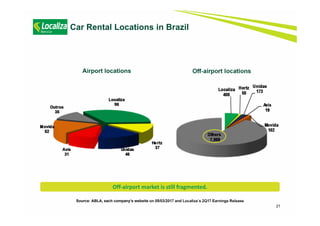
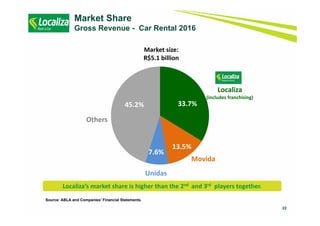
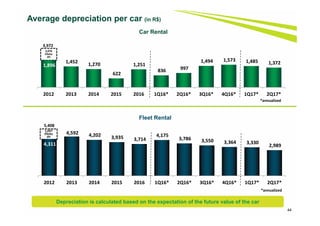
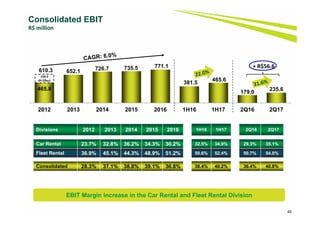
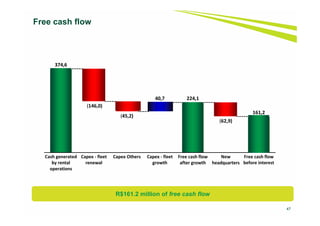
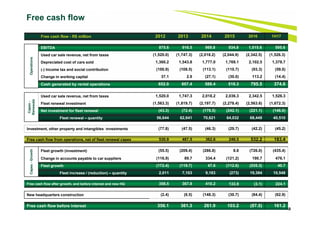
This presentation provides an overview of Localiza, a Brazilian car rental company. It discusses the company's history and milestones, integrated business platform consisting of car rental, fleet rental, franchising, and used car sales divisions, competitive advantages in raising money, buying cars, renting cars, innovation, and selling used cars. Financial information is presented on the car rental and fleet rental divisions. The presentation also reviews market drivers, locations, and Localiza's leading market share positions in both the car rental and fleet rental markets in Brazil.
Currently pi network is not tradable on binance or any other exchange because we are still in the enclosed mainnet.
Right now the only way to sell pi coins is by trading with a verified merchant.
What is a pi merchant?
A pi merchant is someone verified by pi network team and allowed to barter pi coins for goods and services.
Since pi network is not doing any pre-sale The only way exchanges like binance/huobi or crypto whales can get pi is by buying from miners. And a merchant stands in between the exchanges and the miners.
I will leave the telegram contact of my personal pi merchant. I and my friends has traded more than 6000pi coins successfully
Tele-gram
@Pi_vendor_247
Introduction to Indian Financial System ()Avanish Goel
The financial system of a country is an important tool for economic development of the country, as it helps in creation of wealth by linking savings with investments.
It facilitates the flow of funds form the households (savers) to business firms (investors) to aid in wealth creation and development of both the parties
US Economic Outlook - Being Decided - M Capital Group August 2021.pdfpchutichetpong
The U.S. economy is continuing its impressive recovery from the COVID-19 pandemic and not slowing down despite re-occurring bumps. The U.S. savings rate reached its highest ever recorded level at 34% in April 2020 and Americans seem ready to spend. The sectors that had been hurt the most by the pandemic specifically reduced consumer spending, like retail, leisure, hospitality, and travel, are now experiencing massive growth in revenue and job openings.
Could this growth lead to a “Roaring Twenties”? As quickly as the U.S. economy contracted, experiencing a 9.1% drop in economic output relative to the business cycle in Q2 2020, the largest in recorded history, it has rebounded beyond expectations. This surprising growth seems to be fueled by the U.S. government’s aggressive fiscal and monetary policies, and an increase in consumer spending as mobility restrictions are lifted. Unemployment rates between June 2020 and June 2021 decreased by 5.2%, while the demand for labor is increasing, coupled with increasing wages to incentivize Americans to rejoin the labor force. Schools and businesses are expected to fully reopen soon. In parallel, vaccination rates across the country and the world continue to rise, with full vaccination rates of 50% and 14.8% respectively.
However, it is not completely smooth sailing from here. According to M Capital Group, the main risks that threaten the continued growth of the U.S. economy are inflation, unsettled trade relations, and another wave of Covid-19 mutations that could shut down the world again. Have we learned from the past year of COVID-19 and adapted our economy accordingly?
“In order for the U.S. economy to continue growing, whether there is another wave or not, the U.S. needs to focus on diversifying supply chains, supporting business investment, and maintaining consumer spending,” says Grace Feeley, a research analyst at M Capital Group.
While the economic indicators are positive, the risks are coming closer to manifesting and threatening such growth. The new variants spreading throughout the world, Delta, Lambda, and Gamma, are vaccine-resistant and muddy the predictions made about the economy and health of the country. These variants bring back the feeling of uncertainty that has wreaked havoc not only on the stock market but the mindset of people around the world. MCG provides unique insight on how to mitigate these risks to possibly ensure a bright economic future.
USDA Loans in California: A Comprehensive Overview.pptxmarketing367770
USDA Loans in California: A Comprehensive Overview
If you're dreaming of owning a home in California's rural or suburban areas, a USDA loan might be the perfect solution. The U.S. Department of Agriculture (USDA) offers these loans to help low-to-moderate-income individuals and families achieve homeownership.
Key Features of USDA Loans:
Zero Down Payment: USDA loans require no down payment, making homeownership more accessible.
Competitive Interest Rates: These loans often come with lower interest rates compared to conventional loans.
Flexible Credit Requirements: USDA loans have more lenient credit score requirements, helping those with less-than-perfect credit.
Guaranteed Loan Program: The USDA guarantees a portion of the loan, reducing risk for lenders and expanding borrowing options.
Eligibility Criteria:
Location: The property must be located in a USDA-designated rural or suburban area. Many areas in California qualify.
Income Limits: Applicants must meet income guidelines, which vary by region and household size.
Primary Residence: The home must be used as the borrower's primary residence.
Application Process:
Find a USDA-Approved Lender: Not all lenders offer USDA loans, so it's essential to choose one approved by the USDA.
Pre-Qualification: Determine your eligibility and the amount you can borrow.
Property Search: Look for properties in eligible rural or suburban areas.
Loan Application: Submit your application, including financial and personal information.
Processing and Approval: The lender and USDA will review your application. If approved, you can proceed to closing.
USDA loans are an excellent option for those looking to buy a home in California's rural and suburban areas. With no down payment and flexible requirements, these loans make homeownership more attainable for many families. Explore your eligibility today and take the first step toward owning your dream home.
BYD SWOT Analysis and In-Depth Insights 2024.pptxmikemetalprod
Indepth analysis of the BYD 2024
BYD (Build Your Dreams) is a Chinese automaker and battery manufacturer that has snowballed over the past two decades to become a significant player in electric vehicles and global clean energy technology.
This SWOT analysis examines BYD's strengths, weaknesses, opportunities, and threats as it competes in the fast-changing automotive and energy storage industries.
Founded in 1995 and headquartered in Shenzhen, BYD started as a battery company before expanding into automobiles in the early 2000s.
Initially manufacturing gasoline-powered vehicles, BYD focused on plug-in hybrid and fully electric vehicles, leveraging its expertise in battery technology.
Today, BYD is the world’s largest electric vehicle manufacturer, delivering over 1.2 million electric cars globally. The company also produces electric buses, trucks, forklifts, and rail transit.
On the energy side, BYD is a major supplier of rechargeable batteries for cell phones, laptops, electric vehicles, and energy storage systems.
how to sell pi coins effectively (from 50 - 100k pi)DOT TECH
Anywhere in the world, including Africa, America, and Europe, you can sell Pi Network Coins online and receive cash through online payment options.
Pi has not yet been launched on any exchange because we are currently using the confined Mainnet. The planned launch date for Pi is June 28, 2026.
Reselling to investors who want to hold until the mainnet launch in 2026 is currently the sole way to sell.
Consequently, right now. All you need to do is select the right pi network provider.
Who is a pi merchant?
An individual who buys coins from miners on the pi network and resells them to investors hoping to hang onto them until the mainnet is launched is known as a pi merchant.
debuts.
I'll provide you the Telegram username
@Pi_vendor_247
Empowering the Unbanked: The Vital Role of NBFCs in Promoting Financial Inclu...Vighnesh Shashtri
In India, financial inclusion remains a critical challenge, with a significant portion of the population still unbanked. Non-Banking Financial Companies (NBFCs) have emerged as key players in bridging this gap by providing financial services to those often overlooked by traditional banking institutions. This article delves into how NBFCs are fostering financial inclusion and empowering the unbanked.
how to sell pi coins in all Africa Countries.DOT TECH
Yes. You can sell your pi network for other cryptocurrencies like Bitcoin, usdt , Ethereum and other currencies And this is done easily with the help from a pi merchant.
What is a pi merchant ?
Since pi is not launched yet in any exchange. The only way you can sell right now is through merchants.
A verified Pi merchant is someone who buys pi network coins from miners and resell them to investors looking forward to hold massive quantities of pi coins before mainnet launch in 2026.
I will leave the telegram contact of my personal pi merchant to trade with.
@Pi_vendor_247
The secret way to sell pi coins effortlessly.DOT TECH
Well as we all know pi isn't launched yet. But you can still sell your pi coins effortlessly because some whales in China are interested in holding massive pi coins. And they are willing to pay good money for it. If you are interested in selling I will leave a contact for you. Just telegram this number below. I sold about 3000 pi coins to him and he paid me immediately.
Telegram: @Pi_vendor_247
how to sell pi coins at high rate quickly.DOT TECH
Where can I sell my pi coins at a high rate.
Pi is not launched yet on any exchange. But one can easily sell his or her pi coins to investors who want to hold pi till mainnet launch.
This means crypto whales want to hold pi. And you can get a good rate for selling pi to them. I will leave the telegram contact of my personal pi vendor below.
A vendor is someone who buys from a miner and resell it to a holder or crypto whale.
Here is the telegram contact of my vendor:
@Pi_vendor_247
What price will pi network be listed on exchangesDOT TECH
The rate at which pi will be listed is practically unknown. But due to speculations surrounding it the predicted rate is tends to be from 30$ — 50$.
So if you are interested in selling your pi network coins at a high rate tho. Or you can't wait till the mainnet launch in 2026. You can easily trade your pi coins with a merchant.
A merchant is someone who buys pi coins from miners and resell them to Investors looking forward to hold massive quantities till mainnet launch.
I will leave the telegram contact of my personal pi vendor to trade with.
@Pi_vendor_247
2. 1. Company overview
2. Main business divisions
Car Rental
Fleet Rental
Seminovos
3. Financials
Appendix: Earnings release 2Q17
Agenda
2
3. Company: milestones
Phase I – Rise to #1
1973 – Founded in Belo
Horizonte/MG
Late 70’s - Acquisitions in the
Northeast of Brazil
1981 – Brazilian car rental leader in
# of branches
Phase II – Expansion
1984 – Expansion strategy by
adjacencies: Franchising
1991 – Expansion strategy by
adjacencies: Seminovos
1997 – Expansion strategy by
adjacencies: Fleet Rental
1997 – PE firm DL&J enters at a
market cap of US$ 150 mm
Phase III – Reaching Scale
2005 – IPO: market cap of US$ 295
mm
2011 – Rated as investment grade by
Moody’s, Fitch and S&P in 2012
2012 – ADR level I
06/30/2017 – Market cap of about
US$3.0 bi with ADTV of US$17.4
million
1973 1982 1983 2004 2005 2017
3
4. Company: integrated business platform
Synergies:
bargaining power
cost reduction
cross selling
12,784 cars
138 locations in Brazil
71 locations in South America
36 employees
45.5% sold to final consumer
91 stores
59 cities
1.036 employees
100.578 cars
6.7 million clients
368 locations
4,247 employees
38,388 cars
992 clients
262 employees
Based on the 2Q17 4
Car Rental Fleet Rental
SeminovosFranchising
This integrated business platform gives Localiza flexibility and superior performance.
Operations: 472
employees
Overhead: 461
employees
5. 5
High fixed cost
Standard fleet
1 year cycle
High entry barriers
Gains of scale
Intensive capital
Consolidated in airport
market
Fragmented off airport
market
Support area
Reduces depreciation
Know How of used cars
market
Low dependence on
intermediates
Supplementary
business
Important for
distribution
High profitability
Low contribution in
results
Company: Business platform divisions
Car Rental
Rents to individuals and
companies at airports
and off airport locations.
Franchising
Contributes to expand
the Localiza’s network.
Fleet Rental
Outsources fleet for 2-3
years term contracts.
Used Car Sales
Sells the used cars mainly
to final consumers after
the rental and estimates
the residual values.
Low fixed cost
Customized fleet
3 years cycle
Low entry barriers
Intensive capital
6. 6
Net car sale
revenue
R$31.61 year cycle
Car Rental Division - 2016 Financial Cycle
Per car
R$35.2
Average car price
(past 2 years)
1 2 3 4 5 6 7 8 9 10 11 12Expenses, interest and tax
Revenue
Total
1 year
R$ % R$ % R$
Net revenues 20.3 100.0% 34.6 100.0% 55.0
Costs - fixed and variable (10.1) -49.5% (10.1)
SG&A (3.7) -18.1% (3.1) -8.9% (6.8)
Net revenues of car sold 31.6 91.1% 31.6
Book value of car sold (30.0) -86.6% (30.0)
EBITDA 6.6 32.3% 1.6 4.6% 8.2
Cars Depreciation (1.3) -3.6% (1.3)
Others depreciation (0.3) -1.7% (0.1) -0.4% (0.5)
Financial expenses (2.5) -7.2% (2.5)
Taxes (1.9) -9.2% 0.7 2.0% (1.2)
Net Income (Loss) 4.4 21.5% (1.6) -4.6% 2.8
NOPAT 5.0
ROIC 14.2%
Cost of debt after taxes 10.2%
Car Rental Seminovos
Per car soldPer operating car
7. 7
Net car sale
revenue
R$29.2
3 year cycle
Fleet Rental Division - 2016 Financial Cycle
Per car
1 2 3 4 5 6 31 32 33 34 35 36Expenses, interest and tax
Revenue
R$42.9
Average car price
(past 2 years)
Total
3 years
R$ % Seminovos % R$
Net revenues 61.3 100.0% 32.0 100.0% 93.3
Costs - fixed and variable (18.2) -29.7% (18.2)
SG&A (3.6) -5.8% (2.9) -8.9% (6.4)
Net revenues of car sold 29.2 91.1% 29.2
Book value of car sold (25.7) -80.4% (25.7)
EBITDA 39.5 64.5% 3.4 10.7% 42.9
Cars Depreciation (11.1) -34.8% (11.1)
Others depreciation (0.3) -0.4% (0.2) -0.5% (0.4)
Financial expenses (6.5) -20.2% (6.5)
Taxes (11.8) -19.2% 4.3 13.5% (7.5)
Net Income (Loss) 27.5 44.8% (10.1) -31.4% 17.4
Net Income (Loss) - per year 9.2 44.8% (3.4) -31.4% 5.8
NOPAT 8.1
ROIC 18.9%
Cost of debt after taxes 10.2%
Per operating car
Fleet Rental Seminovos
Per car sold
8. 8
2016 Consolidated breakdown
R$ million
R$ 128
13%
R$ 420
41% R$ 468
46% R$ 334
43%
R$ 437
57%
Net Revenues
R$4,439
EBITDA
R$1,016
R$ 2,343
53%
R$ 652
15% R$ 1,445
32%
EBIT*
R$771
*Seminovos results recorded in the Car Rental and Fleet Rental Divisions
Company’s profitability comes from
Car Rental and Fleet Rental Divisions.
9. Raising
money Buying
cars
Renting Cars Selling
Cars
Cash to renew the fleet or pay debt
$
Profitability comes from rental divisions
Competitive advantages
$
9
43 years of experience in managing assets and generating value.
10. Competitive advantages: raising money
Global Scale
National Scale
As of May, 2017.
BB+ Fitch
Ba2 Moody’s
BB+ S&P
Baa1 Moody´s B+ S&P
Ba3 Moody´s
BB- S&P
brAA+ S&P
Aa1.br Moody’s
AAA(bra) Fitch
brA+ S&P
AA- (bra) Fitch
AA- (bra) Fitch
brA+ S&P
AA- (bra) Fitch
brA S&P
A(bra) Fitch
10
Investment grade: lower spreads and longer tenors
Source: Bloomberg .
Raising
money Buying
cars
Renting Cars Selling
Cars
$
Localiza raises money with better conditions then its competitors.
11. Raising
money Buying
cars
Renting Cars Selling
Cars
11
Competitive advantages: buying cars
Number of cars purchased - 2016
* Includes Franchising.
Source: each company website and ANFAVEA
Localiza’s share in the internal sales
of the OEMs - 2016
4.7%
$
Localiza buys cars with better conditions due to the volume of purchases.
92,671
45,114
26,709
9,122
Localiza Movida Unidas Locamerica
*
12. 92
227
182
Localiza Competitors
Raising
money Buying
cars
Renting Cars Selling
Cars
12
Competitive advantages: renting cars
Brand
Brazilian distribution
#ofbranches#ofcities
Source: Each company website on 05/03/2017 and 2Q17 Earnings Release for Localiza.
$
The Company is present in 180 cities where the other largest networks do not operate.
501509
358
153
63
96
Localiza Unidas Hertz Movida
13. Raising
money Buying
cars
Renting Cars Selling
Cars
13
Localiza Fast®
Mobile‐based counter bypass:
Provides agility and control
over the car rental experience.
Customers can pick‐up car
bypassing our counter
Localiza Way®
New platform to offer
value‐added services
Mobile Checklist
More quality, control and agility
in providing cars for rental
Fast Checkout
More operational productivity
and agility in returning the cars
after rental
Connected Shuttle
Optimization of
customer shuttle service
at airports
Anti fraud
Taylor‐made solution for
fraud prevention in car
rentals
Competitive advantages: Innovation
$
Constant innovations allow maintenance of the premium service.
15. Raising
money Buying
cars
Renting Cars Selling
Cars
15
Sales to final consumer
Competitive advantages: selling cars
Buffer: additional fleet during
peaks of demand
Large database
$
Deep know how of used car market: consumer preference, pricing and residual value
NPS of 70 (survey made 90 days after the purchase)
16. 16
ROIC versus cost of debt after taxes
ROIC considered effective income tax rate
ROIC Cost of debt after taxes
Localiza is committed to value creation for its shareholders
6.3% 6.0%
8.0%
9.5% 10.2% 8.8%
16.9% 16.7% 17.8% 17.0%
15.4% 15.7%
2012 2013 2014 2015 2016 1H17
6.9p.p.9.8p.p.10.6p.p. 10.7p.p. 7.5p.p. 5.2p.p.
Annualized
17. 17
1. Company overview
2. Main business divisions
Car Rental
Fleet Rental
Seminovos
3. Financials
Appendix: Earnings release 2Q17
Agenda
19. 19
Drivers
Source: BCB and Localiza rates
Car rental affordability
Source: IPEADATA , Localiza’s loyalty program and SPC
Brasil research * jun/2013
6.5 million
84 million
Adult population
(age > 20 years)
Class A+B+C
65 million
Credit Card
Owners
Increasing affordability and low penetration in leisure trips brings growth opportunities.
180
200 240
260
300350 380
415
465
510
545
622
678
724
788
880
38% 37%
35% 31%
27%
22% 20% 18% 16% 15% 15% 13% 13% 12%
11% 9%
2001 2002 2003 2004 2005 2006 2007 2008 2009 2010 2011 2012 2013 2014 2015 2016
Monthly minimum salary (R$) Daily rental price over minimum salary (%)
* The research indicated that 77% of the population owns at least one credit card. The population was 80% class A,B and C members and 20% class
D and E members.
20. 20
Drivers
# domestic air traffic passengers
In million
Expected investment 2016-2019
(in R$ billion)
Source: Sectorial Analysis Committee / BNDES: 2016-2019 , as of February,
2016.
Source: ANAC up to 2016 and IATA-Air Passenger Forecast
Global Report, as of February, 2016.
The pipeline of investments tend to benefit
the corporate segment.
Expected annual traffic growth of 2.5% from 2017 to 2034
traffic.
70
82 89 90 96 96 89
2010 2011 2012 2013 2014 2015 2016
214.1
142.6
87.1
35.8
32.9
32.5
17.0
15.5
5.8
Energy
Telecoms
Highways
Sanitation
Railways
Urban mobility
Airports
Ports
Solid Residues
21. 21
Source: ABLA, each company’s website on 05/03/2017 and Localiza´s 2Q17 Earnings Release
Airport locations Off-airport locations
Car Rental Locations in Brazil
Off‐airport market is still fragmented.
22. 22
Market Share
Gross Revenue - Car Rental 2016
Source: ABLA and Companies’ Financial Statements.
Localiza’s market share is higher than the 2nd and 3rd players together.
33.7%
13.5%
7.6%
45.2%
Localiza
(includes franchising)
Movida
Unidas
Others
Market size:
R$5.1 billion
23. 23
1. Company overview
2. Main business divisions
Car Rental
Fleet Rental
Seminovos
3. Financials
Appendix: Earnings release 2Q17
Agenda
24. 24
Number of clients
Fleet Rental overview
Compact
cars 33.8%
Others
66.2%
2016 Fleet composition
34,960 cars
729 760 798 849 925
992
2012 2013 2014 2015 2016 2Q17
End of period fleet
32,104 32,809 34,312 33,948 34,960 38,388
2012 2013 2014 2015 2016 2Q17
25. 25
Rented fleet penetration
Corporate fleet:
5,000,000*
Rented fleet:
440,737**
38,388
Brazilian Market World
8.8% 8.9%
13.3%
16.5%
24.5%
37.4%
46.9%
58.3%
Drivers
Low penetration of rented fleet in Brazil.
Source: Datamonitor for European countries and Localiza’s estimate for Brazil
*Frost&Sullivan research
**Localiza estimates
27. 27
1. Company overview
2. Main business divisions
Car Rental
Fleet Rental
Seminovos
3. Financials
Appendix: Earnings release 2Q17
Agenda
28. 28
# of points of sale
Car sales – operating data
73 74 75 77 84
91
2012 2013 2014 2015 2016 1H17
56,664
62,641
70,621
64,305
68,449
40,510
2012 2013 2014 2015 2016 1H17
# Number of cars sold (quantity)
Efficiency gain on car sales.
29. 29
Used car sales drivers:
affordability and penetration
Affordability to buy cars – Public Price of the most
basic Gol
300 350
380
415
465
510
545
622
678
724
788
880
84
71 69
61
55
51 49
43 43 43 41 41
‐
10
20
30
40
50
60
70
80
90
‐100
‐
100
200
300
400
500
600
700
800
900
200520062007200820092010201120122013201420152016
Minimum wage (R$) Minimum wages to buy a new car
7.9
7.7
7.3
6.9
6.5
6.0
5.7
5.3
5.0 4.9 4.8
2005 2006 2007 2008 2009 2010 2011 2012 2013 2014 2015
# of inhabitants per car – Brazil 2005 ‐ 2015
Source: Sindipeças ‐ Current Fleet Report 2016, as of April 2016.
Developed countries maintain a ratio between 1 ‐ 2
cars per inhabitant.
Source: BCB and Localiza
Reference: to calculate the minimum wages to buy a new car we used
the public price of the Vehicle type Gol.
30. 8.4 8.9 9.0 9.4
10.1 9.9 10.0
3.3 3.5 3.6 3.6 3.3
2.5
2.0
2010 2011 2012 2013 2014 2015 2016
30
Brazilian car market:
new x used car market and affordability
New cars
Used cars
Source: FENABRAVE (light and commercial cars)
In million of cars
Total market of 12.0 million cars.
2.5x 2.5x2.6x 2.6x 3.1x 4.0x 5.0x
31. 31
2015 Up to 2 years
419,085
2016 Brand new
1,986,3622016 Used cars
10,008,769
0.7% 3.4% 15.3%
Car sales – operating data
Source: Anfavea and Fenabrave
Unidas, Locamerrica and Movida websites
Examples • Retailers • Dealers • Rental operators • “Auto malls”
Points of sale • 48,000 (Fenauto) • 5,592 (Anfavea)
• +115 (Unidas,
Movida, Locamerica)
• 71 (Fenauto)
Main players
32. 32
1. Company overview
2. Main business divisions
Car Rental
Fleet Rental
Seminovos
3. Financials
Appendix: Earnings release 2Q17
Agenda
33. 33
2Q17 Operational Highlights
Cars sold– consolidated
Rental days evolution (thousand)– Car Rental Rental days evolution (thousand)– Fleet Rental
Fleet at end of the period
78,352
100,578
32,726
38,388 13,695
12,784
124,773
151,750
2Q16 2Q17
Car Rental Fleet Rental Franchising
13,839
20,201
2Q16 2Q17
4,308
5,566
2Q16 2Q17
2,761
3,012
2Q16 2Q17
151,750 cars on 06/30/2017
34. Net Revenues - (R$ million) EBITDA - (R$ million)
Net Income (R$ million)
98.0
129.3
2Q16 2Q17
2Q17 Financial Highlights
34
EBIT (R$ milhões)
471.7
767.8
331.9
401.5 159.5
176.4
963.1
1,345.7
2Q16 2Q17
Seminovos RAC and frachising Fleet Rental
234.3
298.7
2Q16 2Q17
179.0
235.6
2Q16 2Q17
Record profit of R$129.3 millions in the 2Q17
35. 1,093.7 1,163.5
1,284.4 1,258.0
1,428.0
667.5
800.9
327.8 397.4
2012 2013 2014 2015 2016 1H16 1H17 2Q16 2Q17
35
Number of Daily Rentals (thousand)
Growth of 29.2% in daily rentals and of 21.2% in net revenues in 2Q17
13,749 14,242 15,416 15,566
18,662
8,550
10,874
4,308 5,566
2012 2013 2014 2015 2016 1H16 1H17 2Q16 2Q17
Car Rental
Net Revenues (R$ million)
36. 36
Utilization Rate Evolution – Car Rental
The average daily rental rate decrease was offset by cost control, productivity
gains and strong growth, increasing profitability.
Car Rental Average daily rental rate – In R$
73.4% 73.7%
75.3%
71.5% 73.5% 74.7%
1Q16 2Q16 3Q16 4Q16 1Q17 2Q17
83.6
79.4 77.7 78.6 79.3
74.1
1Q16 2Q16 3Q16 4Q16 1Q17 2Q17
37. Car Rental network evolution
Number of car rental locations (Brazil and abroad)
35 corporate branches were added to the network in 1H17
Localiza´s branches - Brazil Franchisees´ branches - Brazil Franchisees´ branches - abroad
272 286 304 320 333 351 368
202 193 172 174 158 158 138
50 63 64 70 70 70 71
524 542 540 564 561 579 577
2012 2013 2014 2015 2016 1Q17 2Q17
+17+18
38. 38
Fleet Rental
535.7 575.9 571.9 608.5 651.8
317.9 349.7
159.5 176.4
2012 2013 2014 2015 2016 1H16 1H17 2Q16 2Q17
10,601 10,844 10,363 10,901 11,240
5,507 5,943
2,761 3,012
2012 2013 2014 2015 2016 1H16 1H17 2Q16 2Q17
Net Revenues (R$ million)
Number of Daily Rentals (thousand)
9.1% growth in daily rentals and 10.6% growth in net revenues in 2Q17
39. Purchases (includes accessories) Used car sales net revenues
Cars purchased Cars sold
39
Net investment Fleet Expansion (reduction)* (quantity)
Net Investment in Fleet (R$ million)
2,011
7,103
* It does not consider theft / crashed cars.
9,183
465.0
(273)
58,655
69,744
79,804
64,032
87,833
31,009
51,058
24,020
35,935
56,644
62,641 70,621 64,305 68,449
30,187
40,510
13,839 20,201
2012 2013 2014 2015 2016 1H16 1H17 2Q16 2Q17
1,618.8
2,026.2
2,483.2
2,278.4
3,289.6
1,133.9
2,107.7
878.7
1,489.51,520.0
1,747.3
2,018.2 2,044.9
2,342.6
1,016.4
1,526.3
471.7
767.8
2012 2013 2014 2015 2016 1H16 1H17 2Q16 2Q17
51,058 cars purchased in the 1H17
98.8
278.9
233.5
19,384
947.0
822
117.5
10,181
407.0
10,548
15,734
581.4
721.7
40. 40
Number of points of sale
New points of sale will be added to support the strong growth of the Car Rental Division
73 74 75 77
84
91
2012 2013 2014 2015 2016 1H17
41. 41
Period-end fleet
Quantity
65,086 70,717 77,573 76,755 94,156 78,352
100,578
32,104 32,809 34,312 33,948
34,960
32,726
38,388
14,545 14,233 13,339 13,992
14,015
13,695
12,784
111,735 117,759 125,224 124,695
143,131
124,773
151,750
2012 2013 2014 2015 2016 1H16 1H17
Car Rental Fleet Rental Franchising
Increase of 22,226 cars in the Car Rental Division without impacting the utilization rate
+5,662
+22,226
42. 1,646.7 1,758.9 1,874.0 1,883.1 2,096.8
993.7 1,159.1
491.4 577.9
1,520.0 1,747.3 2,018.2 2,044.9
2,342.5
1,016.4
1,526.3
471.7 767.8
3,166.7
3,506.2
3,892.2 3,928.0
4,439.3
2,010.1
2,685.4
963.1
1,345.7
2012 2013 2014 2015 2016 1H16 1H17 2Q16 2Q17
42
Consolidated net revenues
R$ million
Rental Used car sales
39.7% increase in consolidated revenue in 2Q17
43. 43
Consolidated EBITDA
R$ million
(*) It considers the new appropriation criteria of the overhead, which is also appropriated to Seminovos.
The EBITDA margin of Fleet Rental reflects the context of
lower basic interest rates and depreciation
875.6 916.5 969.8 934.8 1,015.6
492.7 595.6
234.3
298.7
2012 2013 2014 2015 2016 1H16 1H17 2Q16 2Q17
+ R$64.4
Divisions 2012 2013 2014* 2015 2016 1H16 1H17 2Q16 2Q17
Car Rental 40.9% 36.8% 38.7% 31.8% 32.3% 33.1% 35.3% 31.6% 34.0%
Fleet Rental 66.4% 65.5% 60.0% 62.2% 64.5% 64.8% 62.4% 65.0% 61.8%
Rental Consolidated 49.3% 46.5% 45.3% 41.7% 42.3% 43.3% 43.4% 42.6% 42.4%
Used Car Sales 4.2% 5.7% 6.0% 7.3% 5.5% 6.1% 6.0% 5.3% 7.0%
EBITDA margin:
44. 44
Average depreciation per car (in R$)
Car Rental
Depreciation is calculated based on the expectation of the future value of the car
Fleet Rental
2,076
Efeito
IPI
3,972
1,896
1,452 1,270
622
1,251
836 997
1,494 1,573 1,485 1,372
2012 2013 2014 2015 2016 1Q16* 2Q16* 3Q16* 4Q16* 1Q17* 2Q17*
*annualized
1,097
Efeito
IPI
5,408
4,311
4,592 4,202 3,935 3,714
4,175
3,786 3,550 3,364 3,330
2,989
2012 2013 2014 2015 2016 1Q16* 2Q16* 3Q16* 4Q16* 1Q17* 2Q17*
*annualized
48. 48
Free cash flow - FCFFree cash flow
Free cash flow - R$ million 2012 2013 2014 2015 2016 1H17
w
Operations
EBITDA 875.6 916.5 969.8 934.8 1,015.6 595.6
Used car sale revenue, net from taxes (1,520.0) (1,747.3) (2,018.2) (2,044.9) (2,342.5) (1,526.3)
Depreciated cost of cars sold 1,360.2 1,543.8 1,777.0 1,769.1 2,102.5 1,378.7
(-) Income tax and social contribution (100.9) (108.5) (113.1) (110.7) (93.3) (59.0)
Change in working capital 37.1 2.9 (27.1) (30.0) 113.2 (14.4)
Cash generated by rental operations 652.0 607.4 588.4 518.3 795.5 374.6
Capex-
Renewals
Used car sale revenue, net from taxes 1,520.0 1,747.3 2,018.2 2,036.3 2,342.5 1,526.3
Fleet renewal investment (1,563.3) (1,819.7) (2,197.7) (2,278.4) (2,563.6) (1,672.3)
Net investment for fleet renewal (43.3) (72.4) (179.5) (242.1) (221.1) (146.0)
Fleet renewal – quantity 56,644 62,641 70,621 64,032 68,449 40,510
Investment, other property and intangibles investments (77.8) (47.5) (46.3) (29.7) (42.2) (45.2)
Free cash flow from operations, net of fleet renewal capex 530.9 487.5 362.6 246.5 532.2 183.4
Capex-Growth
Fleet growth (investment) (55.5) (209.4) (286.8) 8.6 (726.0) (435.4)
Change in accounts payable to car suppliers (116.9) 89.7 334.4 (121.2) 190.7 476.1
Fleet growth (172.4) (119.7) 47.6 (112.6) (535.3) 40.7
Fleet increase / (reduction) – quantity 2,011 7,103 9,183 (273) 19,384 10,548
Free cash flow after growth, and before interest and new HQ 358.5 367.8 410.2 133.9 (3.1) 224.1
New headquarters construction (2.4) (6.5) (148.3) (30.7) (84.4) (62.9)
Free cash flow before interest 356.1 361.3 261.9 103.2 (87.5) 161.2
49. 49
Changes in net debt
R$ million
Fleet increase of 10,548 cars with no impact in the net debt
183.4
(142.0)
(435.4)
476.1
(62.9) (86.6)
(2,151.4)
Net Debt
06/30/2017
(2,084.0)
Net Debt
12/31/2016
Free cash flow from
operations, net of fleet
renewal capex
Interest
Increase in
accounts
payable to car
suppliers
Cash
reduction by
fleet increase
New
headquarters
construction
Interest on
own capital
+41.4 +40.7 (149.5)
50. 50
Debt maturity profile (principal)
R$ million
As of June 30, 2017
Comfortable debt profile and strong cash position
202.3 399.4
653.2
770.0 672.5
500.0 500.0
700.0
2017 2018 2019 2020 2021 2022 2023 2024
Cash
2,305.8
2017
2,024.9
51. 51
Debt - ratios
Net debt vs. Fleet value
BALANCE AT THE END OF PERIOD 2012 2013 2014 2015 2016 1H17
Net debt / Fleet value 48% 48% 40% 44% 45% 41%
Net debt / EBITDA(*) 1.4x 1.5x 1.4x 1.7x 2.1x 1.8x
Net debt / Equity 0.9x 1.0x 0.8x 0.8x 0.9x 0.9x
EBITDA / Net financial expenses 6.3x 8.3x 6.4x 4.6x 4.2x 4.2x
Net debt Fleet value
Low leverage supports growth targets
1,231.2 1,332.8 1,322.3 1,588.6
2,084.0 2,151.4
2,547.6 2,797.9
3,296.3
3,642.7
4,623.6
5,238.7
2012 2013 2014 2015 2016 1H17
(*)Annualized
52. 52
ROIC versus cost of debt after taxes
ROIC considered effective income tax rate
ROIC Cost of debt after taxes
Localiza is committed to value creation for its shareholders
6.3% 6.0%
8.0%
9.5% 10.2% 8.8%
16.9% 16.7% 17.8% 17.0%
15.4% 15.7%
2012 2013 2014 2015 2016 1H17
6.9p.p.9.8p.p.10.6p.p. 10.7p.p. 7.5p.p. 5.2p.p.
Annualized
53. 53
Disclaimer
Website: www.localiza.com/ir E-mail: ri@localiza.com Phone: 55 31 3247-7024
Roberto Mendes
CFO and IR
Nora Lanari
Head of IR
Eugênio Mattar
CEO
The material presented is a presentation of general background information about LOCALIZA as of the date of the presentation. It is information in summary
form and does not purport to be complete. It is not intended to be relied upon as advice to potential investors. No representation or warranty, express or
implied, is made concerning, and no reliance should be placed on, the accuracy, fairness, or completeness of the information presented herein.
This presentation contains statements that are forward-looking within the meaning of Section 27A of the Securities Act of 1933 and Section 21E of the
Securities Exchange Act of 1934. Such forward-looking statements are only projections and are not guarantees of future performance. Investors are cautioned
that any such forward-looking statements are and will be, as the case may be, subject to many risks, uncertainties and factors relating to the operations and
business environments of LOCALIZA and its subsidiaries that may cause the actual results of the companies to be materially different from any future results
expressed or implied in such forward-looking statements.
Although LOCALIZA believes that the expectations and assumptions reflected in the forward-looking statements are reasonable based on information
currently available to LOCALIZA’s management, LOCALIZA cannot guarantee future results or events. LOCALIZA expressly disclaims a duty to update any of
the forward-looking statement.
Securities may not be offered or sold in the United States unless they are registered or exempt from registration under the Securities Act of 1933.
This presentation does not constitute an offer, invitation or solicitation of an offer to subscribe to or purchase any securities. Neither this presentation nor anything
contained herein shall form the basis of any contract or commitment whatsoever.
Mariana Campolina
IR Manager