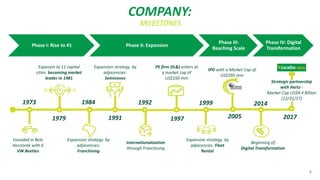
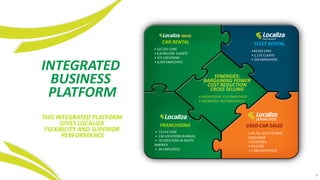
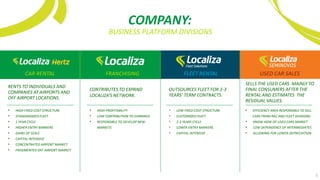
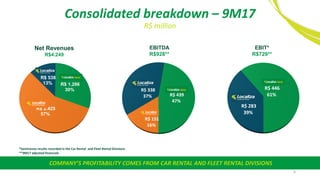
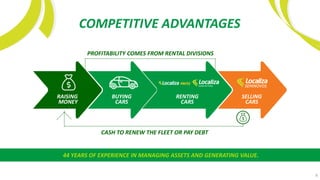
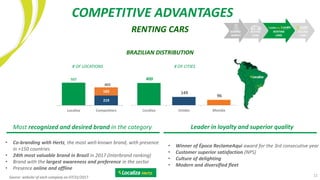
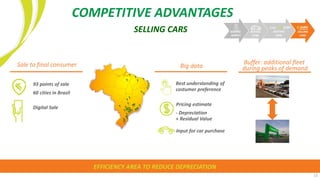
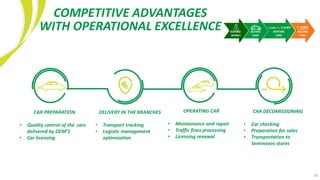
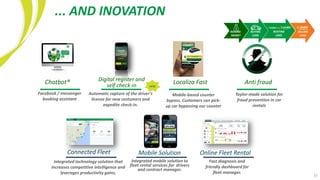
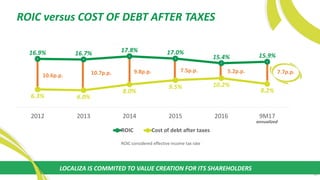
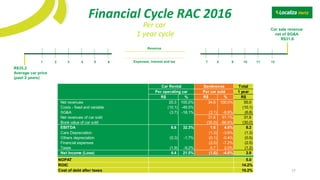
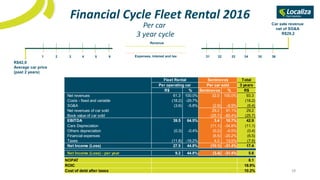
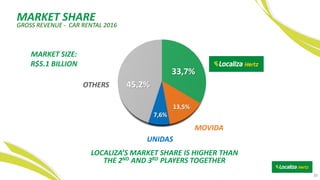
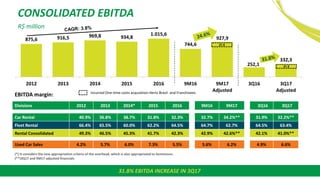
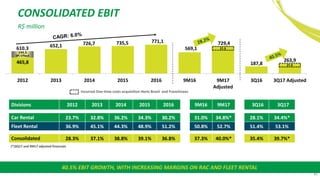
The document provides an overview of Localiza, a car rental company based in Brazil. It discusses Localiza's business divisions including car rental, fleet rental, and used car sales. It highlights Localiza's competitive advantages such as its integrated business platform, leadership in loyalty and quality, efficient used car sales, and innovation in technology. Financial details are presented showing that profitability comes mainly from the car rental and fleet rental divisions.
2. AGENDA
COMPANY OVERVIEW1
MAIN BUSINESS DIVISIONS3
FINANCIALS4
APPENDIX: EARNINGS RELEASE 3Q175
CAR RENTAL
FLEET RENTAL
SEMINOVOS
1
2
3
2
COMPETITIVE ADVANTAGES2
3. 3
1973
Founded in Belo
Horizonte with 6
VW Beetles
1979
Expasion to 11 capital
cities becoming market
leader in 1981
1984
Expansion strategy by
adjacencies:
Franchising
1991
Expansion strategy by
adjacencies:
Seminovos
1992
Internationalization
through Franchising
1997
PE firm DL&J enters at
a market cap of
US$150 mm
1999
Expansion strategy by
adjacencies: Fleet
Rental
2005
IPO with a Market Cap of
US$295 mm
2014
Beginning of
Digital Transformation
2017
Strategic partnership
with Hertz -
Market Cap US$4.4 Billion
(12/31/17)
Phase I: Rise to #1 Phase II: Expansion
Phase III:
Reaching Scale
Phase IV: Digital
Transformation
COMPANY:
MILESTONES
4. INTEGRATED
BUSINESS
PLATFORM
THIS INTEGRATED PLATFORM
GIVES LOCALIZA
FLEXIBILITY AND SUPERIOR
PERFORMANCE
4
• 127,221 CARS
• 6,8 MILLION CLIENTS
• 371 LOCATIONS
• 4,294 EMPLOYEES
CAR RENTAL FLEET RENTAL
•44,655 CARS
• 1,173 CLIENTS
• 259 EMPLOYEES
USED CAR SALES
• 45.7% SOLD TO FINAL
CONSUMER
• 93 STORES
• 60 CITIES
• 1.080 EMPLOYEES
FRANCHISING
• 13,514 CARS
• 136 LOCATIONS IN BRASIL
• 70 LOCATIONS IN SOUTH
AMERICA
• 36 EMPLOYEES
SYNERGIES:
BARGAINING POWER
COST REDUCTION
CROSS SELLING
• OPERATIONS: 514 EMPLOYEES
• OVERHEAD: 463 EMPLOYEES
5. COMPANY:
BUSINESS PLATFORM DIVISIONS
CAR RENTAL FRANCHISING FLEET RENTAL USED CAR SALES
5
• HIGH FIXED COST STRUCTURE
• STANDARDIZED FLEET
• 1 YEAR CYCLE
• HIGHER ENTRY BARRIERS
• GAINS OF SCALE
• CAPITAL INTENSIVE
• CONCENTRATED AIRPORT MARKET
• FRAGMENTED OFF AIRPORT MARKET
RENTS TO INDIVIDUALS AND
COMPANIES AT AIRPORTS AND
OFF AIRPORT LOCATIONS.
CONTRIBUTES TO EXPAND
LOCALIZA’S NETWORK.
• HIGH PROFITABILITY
• LOW CONTRIBUTION TO EARNINGS
• RESPONSIBLE TO DEVELOP NEW
MARKETS
• LOW FIXED COST STRUCTURE
• CUSTOMIZED FLEET
• 2-3 YEARS CYCLE
• LOWER ENTRY BARRIERS
• CAPITAL INTENSIVE
OUTSOURCES FLEET FOR 2-3
YEARS’ TERM CONTRACTS.
SELLS THE USED CARS MAINLY TO
FINAL CONSUMERS AFTER THE
RENTAL AND ESTIMATES THE
RESIDUAL VALUES.
• EFFICIENCY AREA RESPONSIBLE TO SELL
CARS FROM RAC AND FLEET DIVISIONS
• KNOW HOW OF USED CARS MARKET
• LOW DEPENDENCE OF INTERMEDIATES
• ALLOWING FOR LOWER DEPRECIATION
6. R$ 151
16%
R$ 338
37% R$ 439
47%
R$ 283
39%
R$ 446
61%
Net Revenues
R$4.249
EBITDA
R$928**
R$ 2.425
57%
R$ 538
13% R$ 1.286
30%
EBIT*
R$729**
Consolidated breakdown – 9M17
R$ million
6
*Seminovos results recorded in the Car Rental and Fleet Rental Divisions
**9M17 adjusted financials
COMPANY’S PROFITABILITY COMES FROM CAR RENTAL AND FLEET RENTAL DIVISIONS
7. AGENDA
COMPANY OVERVIEW1
MAIN BUSINESS DIVISIONS3
FINANCIALS4
APPENDIX: EARNINGS RELEASE 3Q175
CAR RENTAL
FLEET RENTAL
SEMINOVOS
1
2
3
7
COMPETITIVE ADVANTAGES2
8. COMPETITIVE ADVANTAGES
PROFITABILITY COMES FROM RENTAL DIVISIONS
CASH TO RENEW THE FLEET OR PAY DEBT
44 YEARS OF EXPERIENCE IN MANAGING ASSETS AND GENERATING VALUE.
RAISING
MONEY
BUYING
CARS
ALUGUEL
DE CARS
SELLING
CARS
8
RENTING
CARS
11. Number of cars purchased – 9M17 Localiza’s share in the internal sales
of the OEMs - 9M17
LOCALIZA BUYS CARS WITH BETTER CONDITIONS DUE TO THE VOLUME OF PURCHASES.
Source: website of each company and ANFAVEA..
100.109
44.096
26.029
12.557
Localiza Movida Unidas Locamerica
6.4%
11
COMPETITIVE ADVANTAGES
BUYING CARS RAISING
MONEY
BUYING
CARS
SELLING
CARS
RENTING
CARS
12. Most recognized and desired brand in the category
12
• Co-branding with Hertz, the most well-known brand, with presence
in +150 countries
• 24th most valuable brand in Brazil in 2017 (Interbrand ranking)
• Brand with the largest awareness and preference in the sector
• Presence online and offline
• Winner of Época ReclameAqui award for the 3rd consecutive year
• Customer superior satisfaction (NPS)
• Culture of delighting
• Modern and diversified fleet
Leader in loyalty and superior quality
COMPETITIVE ADVANTAGES
RENTING CARS RAISING
MONEY
BUYING
CARS
SELLING
CARS
RENTING
CARS
BRAZILIAN DISTRIBUTION
# OF LOCATIONS # OF CITIES
507
219
183
402
Localiza Competitors
400
149
96
Localiza Unidas Movida
Source: website of each company on 07/31/2017
13. 13
Sale to final consumer
Digital Sale
93 points of sale
60 cities in Brazil
EFFICIENCY AREA TO REDUCE DEPRECIATION
COMPETITIVE ADVANTAGES
SELLING CARS RAISING
MONEY
BUYING
CARS
SELLING
CARS
RENTING
CARS
Big data
Best understanding of
costumer preference
Pricing estimate
- Depreciation
+ Residual Value
Input for car purchase
Buffer: additional fleet
during peaks of demand
14. 14
RAISING
MONEY
BUYING
CARS
SELLING
CARS
RENTING
CARS
COMPETITIVE ADVANTAGES
WITH OPERATIONAL EXCELLENCE
CAR PREPARATION
• Quality control of the cars
delivered by OEM’S
• Car licensing
DELIVERY IN THE BRANCHES
• Transport tracking
• Logistic management
optimization
OPERATING CAR
• Maintanance and rapair
• Traffic fines processing
• Licensing renewal
CAR DECOMISSIONING
• Car checking
• Preparation for sales
• Transportation to
Seminovos stores
15. 15
Anti fraudLocaliza FastChatbot® Digital register and
self check-in
Taylor-made solution for
fraud prevention in car
rentals
Mobile-based counter
bypass. Customers can pick-
up car bypassing our counter
Facebook / messenger
booking assistant
Automatic capture of the driver’s
license for new costumers and
expedite check-in.
Connected Fleet Mobile Solution
Integrated mobile solution to
fleet rental services for drivers
and contract manager.
Online Fleet Rental
Fast diagnosis and
friendly dashboard for
fleet manager.
Integrated technology solution that
increases competitive intelligence and
leverages productivity gains.
RAISING
MONEY
BUYING
CARS
SELLING
CARS
RENTING
CARS
... AND INOVATION
16. 9.8p.p.
10.6p.p. 10.7p.p. 7.5p.p. 5.2p.p. 7.7p.p.
16.9% 16.7% 17.8% 17.0%
15.4% 15.9%
6.3% 6.0%
8.0%
9.5% 10.2%
8.2%
2012 2013 2014 2015 2016 9M17
ROIC Cost of debt after taxes
ROIC versus COST OF DEBT AFTER TAXES
ROIC considered effective income tax rate
LOCALIZA IS COMMITED TO VALUE CREATION FOR ITS SHAREHOLDERS
annualized
16
17. R$35.2
Average car price
(past 2 years)
Car sale revenue
net of SG&A
R$31.6
1 year cycle
1 2 3 4 5 6 7 8 9 10 11 12Expenses, interest and tax
Revenue
Financial Cycle RAC 2016
Per car
17
Total
1 year
R$ % R$ % R$
Net revenues 20.3 100.0% 34.6 100.0% 55.0
Costs - fixed and variable (10.1) -49.5% (10.1)
SG&A (3.7) -18.1% (3.1) -8.9% (6.8)
Net revenues of car sold 31.6 91.1% 31.6
Book value of car sold (30.0) -86.6% (30.0)
EBITDA 6.6 32.3% 1.6 4.6% 8.2
Cars Depreciation (1.3) -3.6% (1.3)
Others depreciation (0.3) -1.7% (0.1) -0.4% (0.5)
Financial expenses (2.5) -7.2% (2.5)
Taxes (1.9) -9.2% 0.7 2.0% (1.2)
Net Income (Loss) 4.4 21.5% (1.6) -4.6% 2.8
NOPAT 5.0
ROIC 14.2%
Cost of debt after taxes 10.2%
Car Rental Seminovos
Per car soldPer operating car
18. 1 2 3 4 5 6 31 32 33 34 35 36Expenses, interest and tax
Revenue
Car sale revenue
net of SG&A
R$29,2
R$42,9
Average car price
(past 2 years)
3 year cycle
Financial Cycle Fleet Rental 2016
Per car
18
Total
3 years
R$ % Seminovos % R$
Net revenues 61.3 100.0% 32.0 100.0% 93.3
Costs - fixed and variable (18.2) -29.7% (18.2)
SG&A (3.6) -5.8% (2.9) -8.9% (6.4)
Net revenues of car sold 29.2 91.1% 29.2
Book value of car sold (25.7) -80.4% (25.7)
EBITDA 39.5 64.5% 3.4 10.7% 42.9
Cars Depreciation (11.1) -34.8% (11.1)
Others depreciation (0.3) -0.4% (0.2) -0.5% (0.4)
Financial expenses (6.5) -20.2% (6.5)
Taxes (11.8) -19.2% 4.3 13.5% (7.5)
Net Income (Loss) 27.5 44.8% (10.1) -31.4% 17.4
Net Income (Loss) - per year 9.2 44.8% (3.4) -31.4% 5.8
NOPAT 8.1
ROIC 18.9%
Cost of debt after taxes 10.2%
Per operating car
Fleet Rental Seminovos
Per car sold
19. AGENDA
COMPANY OVERVIEW1
MAIN BUSINESS DIVISIONS3
FINANCIALS4
APPENDIX: EARNINGS RELEASE 3Q175
CAR RENTAL
FLEET RENTAL
SEMINOVOS
1
2
3
19
COMPETITIVE ADVANTAGES2
20. MARKET SHARE
GROSS REVENUE - CAR RENTAL 2016
LOCALIZA’S MARKET SHARE IS HIGHER THAN
THE 2ND AND 3RD PLAYERS TOGETHER
33,7%
13,5%
7,6%
45,2%
MARKET SIZE:
R$5.1 BILLION
OTHERS
UNIDAS
MOVIDA
20
21. CAR RENTAL LOCATIONS IN BRAZIL
OFF – AIRPORT MARKET IS STILL FRAGMENTED
AIRPORT LOCATIONS OFF – AIRPORT LOCATIONS
Localiza
98
Hertz
32
Unidas
50
Avis
32
Movida
51 Others
42
Localiza Hertz Unidas Avis Movida Others
Localiza
409
Hertz
47
Unidas
156
Avis
21
Others
7.825
Movida
101
21Source: ABLA, each company’s website on 11/30/2017 and Localiza’s 3Q17 Earnings Release.
1/3 OF CAR RENTAL’S
REVENUES COMES
FROM AIRPORT
LOCATIONS
OFF -AIRPORT
LOCATIONS
AIRPORT
LOCATIONS
22. 84 million
Adult population
(age> 20 years)
Class A+B+C
64 million
Credit card owners*
6.8
million
180
200 240
260
300
350
380
415
465
510
545
622
678
724
788
880
38% 37%
35%
31%
27%
22%
20%
18% 16% 15% 15% 13% 13% 12%
11% 9%
2001 2002 2003 2004 2005 2006 2007 2008 2009 2010 2011 2012 2013 2014 2015 2016
Monthly minimun salary (R$) Daily rental price over minimum salary (%)
CAR RENTAL AFFORDABILITY
Source: BCB and Localiza rates
Sources: IPEADATA, Localiza’s loyalty program and BCB (2016)
INCREASING AFFORDABILITY AND LOW PENETRATION BRINGS GROWTH OPPORTUNITIES.
*Was considered that each credit card owner owns 1,3 credit card, BCB estimated that were 84 million active credit cards in Brazil in 2016.
DRIVERS
22
23. EVOLUTION IN AIRLINE MARKET BRINGS GROWTH OPPORTUNITIES
DRIVERS
23
*
40,6
45,7
49,7
56,9
70,3
81,5
87,0 88,2 93,3 94,4 89,0 90,8
2006 2007 2008 2009 2010 2011 2012 2013 2014 2015 2016 2017
AIRLINE MARKET EVOLUTION
RPK (REVENUE SEAT KILOMETER) IN MILLION
* Annualized with the available data until November/17
Sources: ANAC
201,3
267,8
401
201,3
241,4
700,5
2017 2027 2037
DEMAND FORECASTING
PASSANGERS ESTIMATE (IN MILLION)
Sources: Ministério dos Transportes / Transportation Ministry (september/2017)
OPTIMISTIC
CONSERVATIVE
24. AGENDA
COMPANY OVERVIEW1
MAIN BUSINESS DIVISIONS3
FINANCIALS4
APPENDIX: EARNINGS RELEASE 3Q175
CAR RENTAL
FLEET RENTAL
SEMINOVOS
1
2
3
24
COMPETITIVE ADVANTAGES2
27. AGENDA
COMPANY OVERVIEW1
MAIN BUSINESS DIVISIONS3
FINANCIALS4
APPENDIX: EARNINGS RELEASE 3Q175
CAR RENTAL
FLEET RENTAL
SEMINOVOS
1
2
3
27
COMPETITIVE ADVANTAGES2
28. 8.4 8.9 9.0 9.4
10.1 9.9 10.0
10.6
3.3 3.5 3.6 3.6 3.3
2.5
2.0 2.1
2010 2011 2012 2013 2014 2015 2016 2017*
BRAZILIAN CAR MARKET: new vs used car market
Source: Fenabrrave (light and commercial cars)
*9M17 anualizado 28
New cars
Used cars
2.5x 2.5x2.6x 2.6x 3.1x 4.0x
5.0x 5.0x
TOTAL MARKET OF 12.7 MILLION CARS.
10.7
2.2
29. DRIVERS SEMINOVOS
# OF INHABITANTS PER CAR – BRAZIL 2005 - 2016
AFFORDABILITY TO BUY CARS – PUBLIC PRICE OF THE
MODEL GOL IN THE MOST BASIC VERSION
AFFORDABILITY AND PENETRATION
7,9
7,7
7,3
6,9
6,5
6,0
5,7
5,3
5,0 4,9 4,8 4,8
2005 2006 2007 2008 2009 2010 2011 2012 2013 2014 2015 2016
300 350
380
415
465 510
545
622
678
724
788
880
84
71 69
61
55
51 49
43 43 43 41 41
-
10
20
30
40
50
60
70
80
90
-100
-
100
200
300
400
500
600
700
800
900
2005 2006 2007 2008 2009 2010 2011 2012 2013 2014 2015 2016
Minimum wage (R$) Minimum wages needed to buy a new car
DEVELOPED COUNTRIES MAINTAIN A RATIO BETWEEN
1-2 CARS PER INHABITANT
Source: Sindipeças – Current Fleet Report 2016, as of April 2016. Source: BCB and Localiza
29
30. AGENDA
COMPANY OVERVIEW1
MAIN BUSINESS DIVISIONS3
FINANCIALS4
APPENDIX: EARNINGS RELEASE 3Q175
CAR RENTAL
FLEET RENTAL
SEMINOVOS
1
2
3
30
COMPETITIVE ADVANTAGES2
31. 3Q17 OPERATIONAL HIGHLIGHTS
4.846
6.587
3Q16 3Q17
2.812
3.241
3Q16 3Q17
17,379
23,941
3Q16 3Q17
87.897
127.221
34.437
44.655
13.868
13.514
136.202
185.390
3Q16 3Q17
Franchising Fleet Rental Car Rental 31
# OF CARS SOLD
RENTAL DAYS (THOUSAND)– CAR RENTAL RENTAL DAYS (THOUSAND) – FLEET RENTAL
FLEET AT END OF THE PERIOD
32. 3Q17 FINANCIAL HIGHLIGHTS
32
NET REVENUES (R$ MILLION)
NET INCOME (R$ MILLION)
103,9
139,5
3Q16 3Q17 Adjusted
EBIT (R$ MILHÕES)
592,9
898,4
366,8
476,5163,5
188,5
1.123,2
1.563,4
3Q16 3Q17
Seminovos RAC and frachising Fleet Rental
252,1
332,3
3Q16 3Q17 Adjusted
187,8
263,9
3Q16 3Q17 Adjusted
21.5
16.3
21.5
One-time costs incurred - Hertz Brasil acquisition
and Franchisees incorporation
One-time costs incurred - Hertz Brasil acquisition
and Franchisees incorporation, after taxes
One-time costs incurred - Hertz Brasil acquisition
and Franchisees incorporation
EBITDA (R$ MILLION)
33. HERTZ BRASIL – SUCESS OF THE INTEGRATION
33
Rebranding with the new brand Localiza Hertz
Fleet contracts transferred to Localiza Fleet
Integration of Hertz Brasil´s and Localiza´s locations
8.386 cars integrated to the Localiza´s fleet
Inbound/outbound reservation system already integrated
Localiza´s clients have acess to over 10,000 Hertz locations around the globe
Data and client base consolidation
Closing on 09/01/2017
NEXT STEPS: INCREASE OF THE COMMERCIAL OPPORTUNITIES, INBOUND OUTBOUND AND KNOW-HOW EXCHANGE
34. ONE TIME COSTS 3Q17
34
ONE-TIME COSTS
3Q17
Incurred
4Q17
Estimated
Total
Estimated
RAC Costs:
Hertz: rebrand, structure and networking reduction (2.1) (40.0) (42.1)
Franchise integration (12.7) (12.7)
RAC - Total costs (14.8) (40.0) (54.8)
SG&A
Hertz: structure and networking reduction (6.7) (20.0) (26.7)
Total SG&A (6.7) (20.0) (26.7)
Total One-time Costs (21.5) (60.0) (81.5)
CONSOLIDATED RESULTS
3Q17
actual
One-off
3Q17
Adjusted
Net revenues 1,563.4 1,563.4
Total costs and expenses (1,252.6) 21.5 (1,231.1)
EBITDA 310.8 21.5 332.3
Depreciation (68.4) (68.4)
EBIT 242.4 21.5 263.9
Financial expenses, net (79.4) (79.4)
Income tax and social contribution (39.8) (5.2) (45.0)
Net income 123.2 16.3 139.5
3Q17 financial results were adjusted to
exclude the impact of one-time costs
resulting from the acquisition of Hertz´s
operations in Brazil (R$8.8 million) and
the integration of 17 franchised locations
(R$12.7 million):
Note: non-incurred one-time costs were not provisioned in 3Q17 because, on 09/30/2017, such expenses were not bound to be regarded as
provision according to the rules imposed by Technical Pronouncement CPC # 25 – Provisions, Contingent Liabilities and Contingent Assets.
35. CAR RENTAL
1.093,7 1.163,5 1.284,4 1.258,0
1.428,0
1.030,0
1.273,6
362,5 472,6
2012 2013 2014 2015 2016 9M16 9M17 3Q16 3Q17
NUMBER OF DAILY RENTALS (THOUSAND)
35.9% RAC DAILY RENTALS GROWTH AND 30.4% GROWTH IN NET REVENUES IN 3Q17
13.749 14.242 15.416 15.566
18.662
13.397
17.461
4.846
6.587
2012 2013 2014 2015 2016 9M16 9M17 3Q16 3Q17
NET REVENUES (R$ MILLION)
35
36. 36
UTILIZATION RATE – CAR RENTALAVERAGE DAILY RENTAL RATE – IN R$
73,4% 73,7%
75,3%
71,5%
73,5% 74,7% 74,3%
1Q16 2Q16 3Q16 4Q16 1Q17 2Q17 3Q17
83,6
79,4 77,7 78,6 79,3
74,1 74,1
1Q16 2Q16 3Q16 4Q16 1Q17 2Q17 3Q17
CAR RENTAL
THE AVERAGE DAILY RENTAL RATE AND UTILIZATION RATE REMAINED
FLATTISH IN 3Q17 WHEN COMPARED WITH 2Q17
.
37. CAR RENTAL NETWORK EVOLUTION
Number of car rental locations Brazil and abroad (does not include Hertz Brasil)
272 286 304 320 333 371
202 193 172 174 158 136
50 63 64 70 70 70
524 542 540 564 561 577
2012 2013 2014 2015 2016 9M17*
Localiza's branches - Brazil Franchisees' branches - Brazil Franchisees' branches - abroad
+38
38 CORPORATE BRANCHES WERE ADDED TO THE NETWORK IN 9M17
37
* Does not include Hertz Brasil branches
38. FLEET RENTAL
NUMBER OF DAILY RENTALS (THOUSAND)
15.3% GROWTH IN DAILY RENTALS AND NET REVENUES IN 3Q17 38
535,7 575,9 571,9 608,5 651,8
481,3
538,2
163,5 188,5
2012 2013 2014 2015 2016 9M16 9M17 3Q16 3Q17
10.601 10.844 10.363 10.901 11.240
8.318 9.184
2.812 3.241
2012 2013 2014 2015 2016 9M16 9M17 3Q16 3Q17
NET REVENUES (R$ MILLION)
39. NET INVESTMENT
FLEET EXPANSION (REDUCTION)* (QUANTITY)
108,271 CARS PURCHASED IN 9M17, 57,213 OF WHICH WERE PURCHASED IN 3Q17, INCLUDING HERTZ BRASIL39
NET INVESTMENT IN FLEET (R$ MILLION)
Cars purchased Cars sold
2,011 7,103
* It does not consider theft / crashed cars.
9,183
465.0
(273)
1.618,8
2.026,2
2.483,2
2.278,4
3.289,6
2.211,9
4.316,6
1.078,0
2.208,9
1.520,0 1.747,3
2.018,2 2.044,9
2.342,6
1.609,3
2.424,7
592,9
898,4
2012 2013 2014 2015 2016 9M16 9M17 3Q16 3Q17
58.655
69.744
79.804
64.032
87.833
59.912
108.271
28.903
57.21356.644 62.641 70.621
64.305 68.449
47.566
64.451
17.379
23.941
2012 2013 2014 2015 2016 9M16 9M17 3Q16 3Q17
98.8
278.9 233.5
19,384
947.0
12,346
602.6
485,1
43,820
33,272
1,891.9
1,310.5
11,524
267
100,109
8,162
8,162
49,051 267
64,184
23,674
9.04,030.1
286.5
286.5
1,922.4 9.02,415.7
889.4
Hertz Brasil
Purchases (includes accessories) Used car sales net revenues Hertz Brasil
40. 40
NUMBER OF POINTS OF SALE
73 74 75 77
84 79
93
56.644
62.641
70.621
64.305 68.449
47.566
64.451
-50.000
-30.000
-10.000
10.000
30.000
50.000
70.000
-10
10
30
50
70
90
110
130
150
2012 2013 2014 2015 2016 9M16 9M17
Points of sale Cars sold
NEW POINTS OF SALE WILL BE ADDED TO SUPPORT THE FLEET RENEWAL.
41. 41
END OF PERIOD FLEET
185,390 CARS AS OF 09/30/2017
INCREASE OF 39,324 CARS IN THE RENT A CAR DIVISION WITHOU IMPACTING UTILIZATION RATE
Car Rental Fleet Rental Franchising
+10,218
+39,324
Quantity
42. 1,646.7 1,758.9 1,874.0 1,883.1 2,096.8 1,523.9 1,824.1
530.3 665.0
1,520.0 1,747.3 2,018.2
2,044.9
2,342.5
1,609.4
2,424.7
592.9 898.4
3,166.7 3,506.2 3,892.2 3,928.0
4,439.3
3,133.3
4,248.8
1,123.2
1,563.4
2012 2013 2014 2015 2016 9M16 9M17 3Q16 3Q17
42
CONSOLIDATED NET REVENUES
R$ million
Rental Used car sales
39.2% INCREASE IN CONSOLIDATED REVENUES IN 3Q17
43. 43
CONSOLIDATED EBITDA
R$ million
(*) It considers the new appropriation criteria of the overhead, which is also appropriated to Seminovos.
(**)3Q17 and 9M17 adjusted financials
Divisions 2012 2013 2014* 2015 2016 9M16 9M17 3Q16 3Q17
Car Rental 40.9% 36.8% 38.7% 31.8% 32.3% 32.7% 34.2%** 31.9% 32.2%**
Fleet Rental 66.4% 65.5% 60.0% 62.2% 64.5% 64.7% 62.7% 64.5% 63.4%
Rental Consolidated 49.3% 46.5% 45.3% 41.7% 42.3% 42.9% 42.6%** 42.1% 41.0%**
Used Car Sales 4.2% 5.7% 6.0% 7.3% 5.5% 5.6% 6.2% 4.9% 6.6%
EBITDA margin:
875,6 916,5 969,8 934,8
1.015,6
744,6
927,9
252,1
332,3
2012 2013 2014 2015 2016 9M16 9M17
Adjusted
3Q16 3Q17
AdjustedIncurred One-time costs acquisition Hertz Brasil and Franchisees
21.5
21.5
31.8% EBITDA INCREASE IN 3Q17
44. 44
AVERAGE ANNUAL DEPRECIATION PER CAR
In R$
1.896
1.452 1.270
622
1.251 1.351
2012 2013 2014 2015 2016 9M17 annualized
3,972
5,408
4.311
4.592 4.202 3.935 3.714
3.105
2012 2013 2014 2015 2016 9M17 annualized
2,076
IPI effect
1,097
IPI Effect
FLEET RENTAL
CAR RENTAL
DEPRECIATION IS IMPACTED BY THE NEW AND USED CAR MARKET, AS WELL BY THE COST TO SELL
48. FREE CASH FLOW
48
Free cash flow - R$ million 2012 2013 2014 2015 2016 9M17
Adjusted
Operations
EBITDA 875.6 916.5 969.8 934.8 1,015.6 927.9
Used car sale revenue, net from taxes (1,520.0) (1,747.3) (2,018.2) (2,044.9) (2,342.5) (2,424.7)
Depreciated cost of cars sold 1,360.2 1,543.8 1,777.0 1,769.1 2,102.5 2,178.8
(-) Income tax and social contribution (100.9) (108.5) (113.1) (110.7) (93.3) (81.7)
Change in working capital 37.1 2.9 (27.1) (30.0) 113.2 (28.9)
Cash generated by rental operations 652.0 607.4 588.4 518.3 795.5 571.4
Capex-renewal
Used car sale revenue, net from taxes 1,520.0 1,747.3 2,018.2 2,036.3 2,342.5 2,424.7
Fleet renewal investment (1,563.3) (1,819.7) (2,197.7) (2,278.4) (2,563.6) (2,594.6)
Net investment for fleet renewal (43.3) (72.4) (179.5) (242.1) (221.1) (169.9)
Fleet renewal – quantity 56,644 62,641 70,621 64,032 68,449 64,451
Investment, other property and intangible investments (77.8) (47.5) (46.3) (29.7) (42.2) (35.1)
Free cash flow from operations, before growth 530.9 487.5 362.6 246.5 532.2 366.4
Capex-Growth
Fleet growth (investment) (55.5) (209.4) (286.8) 8.6 (726.0) (1,435.5)
Change in accounts payable to car suppliers (116.9) 89.7 334.4 (121.2) 190.7 738.7
Fleet growth capex (172.4) (119.7) 47.6 (112.6) (535.3) (696.8)
Fleet increase / (reduction) – quantity 2,011 7,103 9,183 (273) 19,384 35,658
Free cash flow after growth, and before interest and new HQ 358.5 367.8 410.2 133.9 (3.1) (330.4)
Capex-non-
recurring
Hertz acquisition net of the acquired cash
(R$360.1 million - R$22.4 cash)
- - - - - (337.7)
Incurred one-time costs effect - - - - - (21.5)
New headquarters construction and furniture (2.4) (6.5) (148.3) (30.7) (84.4) (119.7)
Free cash flow before interest 356.1 361.3 261.9 103.2 (87.5) (809.3)
49. 49
CHANGE IN NET DEBT
R$ million
R$1.1 BILLION NET DEBT INCREASE DUE TO FLEET EXPANSION AND HERTZ BRASIL ACQUISITION
R$1 billion investment
50. 50
DEBT MATURITY PROFILE (PRINCIPAL)
R$ million
1.939,4
111,3
435,6 685,6
1.420,0
672,5 500,0 500,0
700,0
350,0
350,0
Cash 2017 2018 2019 2020 2021 2022 2023 2024
1,232.5
2,289.4
Pro-Forma with 4th debentures issuance of Localiza Fleet, completed in October. 2017
1,050.0
As of September 30, 2017
Includes 4th issuance of Localiza Fleet completed in October 2017
STRONG CASH POSITION AND COMFORTABLE DEBT PROFILE
51. 51
DEBT RATIOS
THE COMPANY CONTINUES TO PRESENT SOLID DEBT RATIOS
NET DEBT VERSUS FLEET VALUE
BALANCE AT THE END OF PERIOD 2012 2013 2014 2015 2016 9M17
Net debt / Fleet value 48% 48% 40% 44% 45% 49%
Net debt / EBITDA(*) 1.4x 1.5x 1.4x 1.7x 2.1x 2.6x
Net debt / Equity 0.9x 1.0x 0.8x 0.8x 0.9x 1.3x
EBITDA / Net financial expenses 6.3x 8.3x 6.4x 4.6x 4.2x 4.2x
NET DEBT FLEET VALUE
(*)Annualized
1,231.2 1,332.8 1,322.3 1,588.6
2,084.0
3,238.3
2,547.6 2,797.9
3,296.3 3,642.7
4,623.6
6,588.6
2012 2013 2014 2015 2016 9M17
52. 52
Website: www.localiza.com/ir E-mail: ri@localiza.com Phone: 55 31 3247-7024
The material presented is a presentation of general background information about LOCALIZA as of the date of the presentation. It is information in summary form and does not purport to be
complete. It is not intended to be relied upon as advice to potential investors. No representation or warranty, express or implied, is made concerning, and no reliance should be placed on, the
accuracy, fairness, or completeness of the information presented herein.
This presentation contains statements that are forward-looking within the meaning of Section 27A of the Securities Act of 1933 and Section 21E of the Securities Exchange Act of 1934. Such forward-
looking statements are only projections and are not guarantees of future performance. Investors are cautioned that any such forward-looking statements are and will be, as the case may be, subject
to many risks, uncertainties and factors relating to the operations and business environments of LOCALIZA and its subsidiaries that may cause the actual results of the companies to be materially
different from any future results expressed or implied in such forward-looking statements.
Although LOCALIZA believes that the expectations and assumptions reflected in the forward-looking statements are reasonable based on information currently available to LOCALIZA’s management,
LOCALIZA cannot guarantee future results or events. LOCALIZA expressly disclaims a duty to update any of the forward-looking statement.
Securities may not be offered or sold in the United States unless they are registered or exempt from registration under the Securities Act of 1933.
This presentation does not constitute an offer, invitation or solicitation of an offer to subscribe to or purchase any securities. Neither this presentation nor anything contained herein shall form the basis of
any contract or commitment whatsoever.
DISCLAIMER