Download to read offline

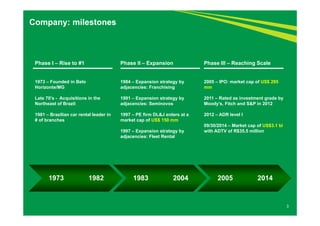
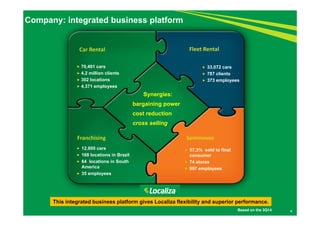
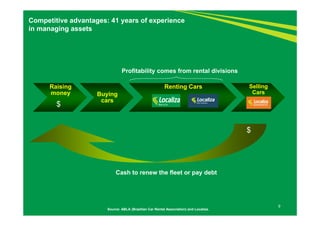
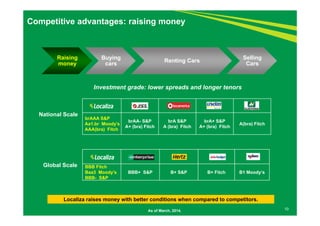
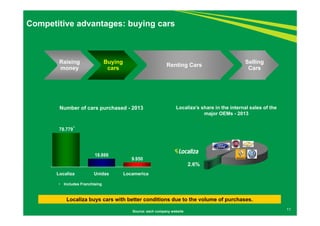
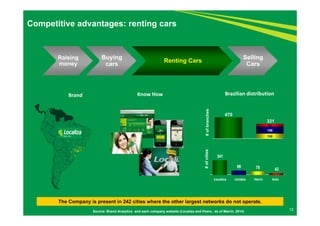


This document provides an overview of Localiza Rent a Car S.A., including: 1. Localiza has grown significantly since its founding in 1973, becoming the Brazilian car rental leader through acquisitions and expansion into adjacent businesses like fleet rental and used car sales. 2. The company has an integrated business platform across its four divisions that provides synergies and flexibility. 3. Localiza has several competitive advantages, including scale in purchasing cars that allows it to negotiate better prices, a large network of locations across Brazil, and expertise in managing assets over the rental lifecycle.


