SlideShare a Scribd company logo
1 of 54
Download to read offline
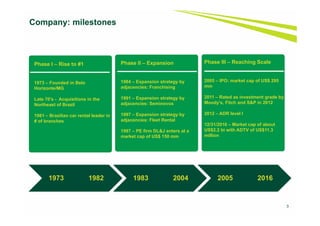
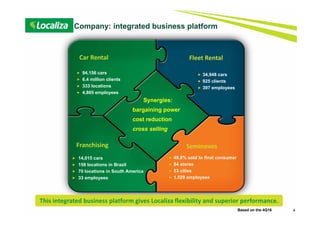
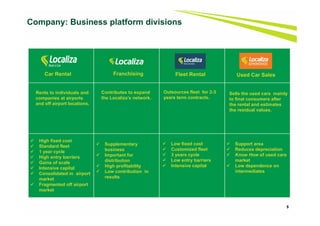
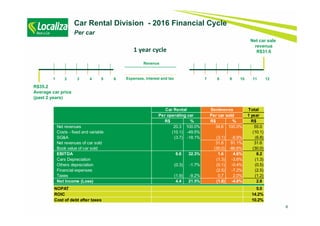
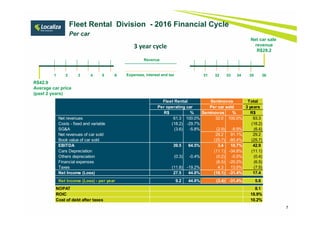
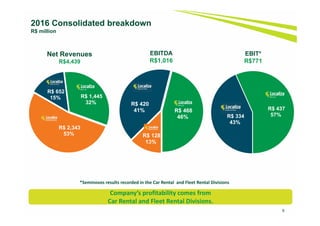
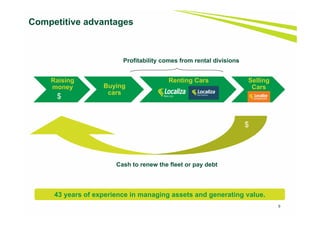
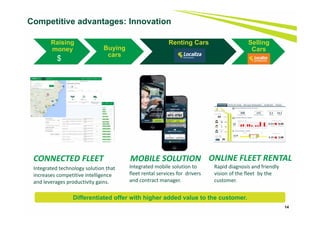
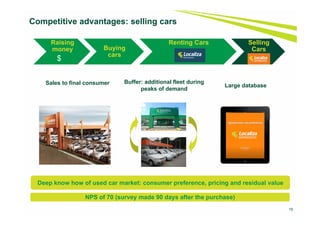
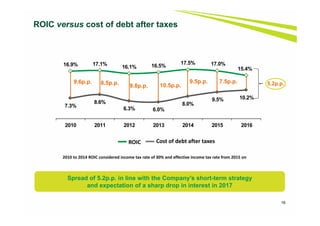
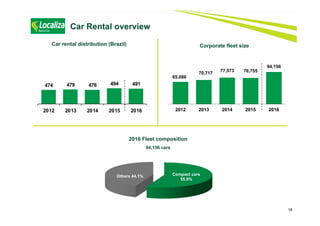
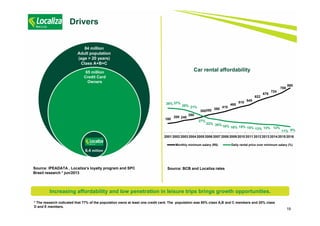
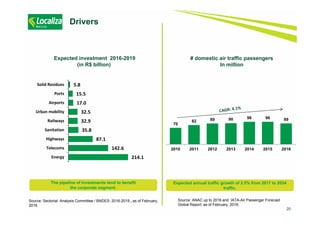
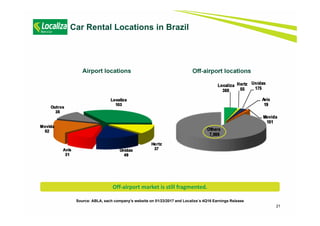
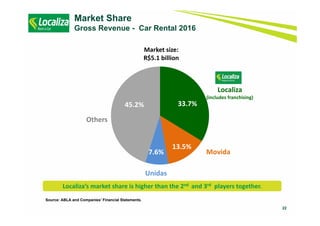
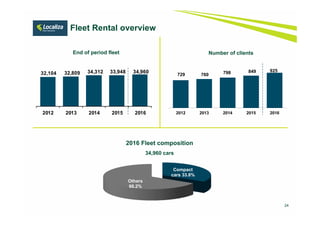
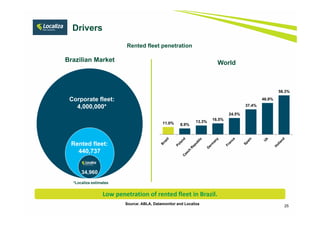
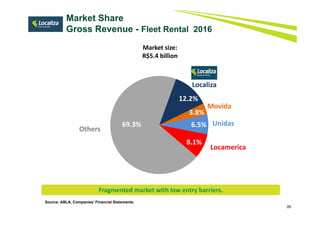
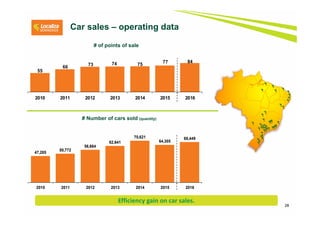
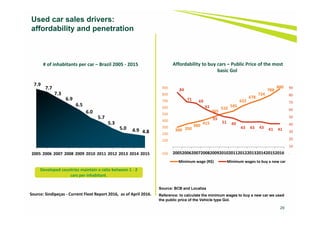
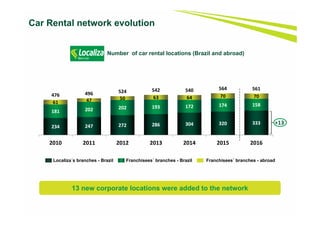
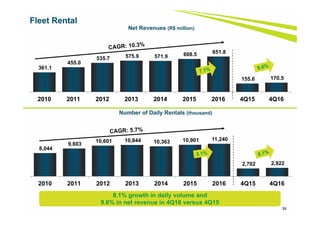
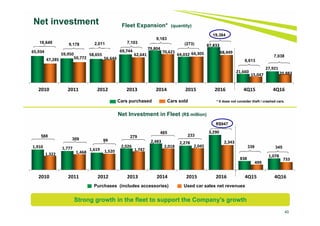
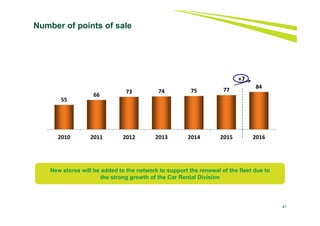
Institutional Presentation
April, 2017
1. Company overview
2. Main business divisions
 Car Rental
 Fleet Rental
 Seminovos
3. Financials
Appendix: Earnings release 4Q16
Agenda
2
Company: milestones
Phase I – Rise to #1
1973 – Founded in Belo
Horizonte/MG
Late 70’s - Acquisitions in the
Northeast of Brazil
1981 – Brazilian car rental leader in
# of branches
Phase II – Expansion
1984 – Expansion strategy by
adjacencies: Franchising
1991 – Expansion strategy by
adjacencies: Seminovos
1997 – Expansion strategy by
adjacencies: Fleet Rental
1997 – PE firm DL&J enters at a
market cap of US$ 150 mm
Phase III – Reaching Scale
2005 – IPO: market cap of US$ 295
mm
2011 – Rated as investment grade by
Moody’s, Fitch and S&P in 2012
2012 – ADR level I
12/31/2016 – Market cap of about
US$2.2 bi with ADTV of US$11.3
million
1973 1982 1983 2004 2005 2016
3
Company: integrated business platform
Synergies:
bargaining power
cost reduction
cross selling
 14,015 cars
 158 locations in Brazil
 70 locations in South America
 33 employees
 49.8% sold to final consumer
 84 stores
 53 cities
 1.029 employees
 94,156 cars
 6.4 million clients
 333 locations
 4,865 employees
 34,948 cars
 925 clients
 397 employees
Based on the 4Q16 4
Car Rental Fleet Rental
SeminovosFranchising
This integrated business platform gives Localiza flexibility and superior performance.
5
 High fixed cost
 Standard fleet
 1 year cycle
 High entry barriers
 Gains of scale
 Intensive capital
 Consolidated in airport
market
 Fragmented off airport
market
 Support area
 Reduces depreciation
 Know How of used cars
market
 Low dependence on
intermediates
 Supplementary
business
 Important for
distribution
 High profitability
 Low contribution in
results
Company: Business platform divisions
Car Rental
Rents to individuals and
companies at airports
and off airport locations.
Franchising
Contributes to expand
the Localiza’s network.
Fleet Rental
Outsources fleet for 2-3
years term contracts.
Used Car Sales
Sells the used cars mainly
to final consumers after
the rental and estimates
the residual values.
 Low fixed cost
 Customized fleet
 3 years cycle
 Low entry barriers
 Intensive capital
6
Net car sale
revenue
R$31.61 year cycle
Car Rental Division - 2016 Financial Cycle
Per car
R$35.2
Average car price
(past 2 years)
1 2 3 4 5 6 7 8 9 10 11 12Expenses, interest and tax
Revenue
Total
1 year
R$ % R$ % R$
Net revenues 20.3 100.0% 34.6 100.0% 55.0
Costs - fixed and variable (10.1) -49.5% (10.1)
SG&A (3.7) -18.1% (3.1) -8.9% (6.8)
Net revenues of car sold 31.6 91.1% 31.6
Book value of car sold (30.0) -86.6% (30.0)
EBITDA 6.6 32.3% 1.6 4.6% 8.2
Cars Depreciation (1.3) -3.6% (1.3)
Others depreciation (0.3) -1.7% (0.1) -0.4% (0.5)
Financial expenses (2.5) -7.2% (2.5)
Taxes (1.9) -9.2% 0.7 2.0% (1.2)
Net Income (Loss) 4.4 21.5% (1.6) -4.6% 2.8
NOPAT 5.0
ROIC 14.2%
Cost of debt after taxes 10.2%
Car Rental Seminovos
Per car soldPer operating car
7
Net car sale
revenue
R$29.2
3 year cycle
Fleet Rental Division - 2016 Financial Cycle
Per car
1 2 3 4 5 6 31 32 33 34 35 36Expenses, interest and tax
Revenue
R$42.9
Average car price
(past 2 years)
Total
3 years
R$ % Seminovos % R$
Net revenues 61.3 100.0% 32.0 100.0% 93.3
Costs - fixed and variable (18.2) -29.7% (18.2)
SG&A (3.6) -5.8% (2.9) -8.9% (6.4)
Net revenues of car sold 29.2 91.1% 29.2
Book value of car sold (25.7) -80.4% (25.7)
EBITDA 39.5 64.5% 3.4 10.7% 42.9
Cars Depreciation (11.1) -34.8% (11.1)
Others depreciation (0.3) -0.4% (0.2) -0.5% (0.4)
Financial expenses (6.5) -20.2% (6.5)
Taxes (11.8) -19.2% 4.3 13.5% (7.5)
Net Income (Loss) 27.5 44.8% (10.1) -31.4% 17.4
Net Income (Loss) - per year 9.2 44.8% (3.4) -31.4% 5.8
NOPAT 8.1
ROIC 18.9%
Cost of debt after taxes 10.2%
Per operating car
Fleet Rental Seminovos
Per car sold
8
2016 Consolidated breakdown
R$ million
R$ 128
13%
R$ 420
41% R$ 468
46% R$ 334
43%
R$ 437
57%
Net Revenues
R$4,439
EBITDA
R$1,016
R$ 2,343
53%
R$ 652
15% R$ 1,445
32%
EBIT*
R$771
*Seminovos results recorded in the Car Rental and Fleet Rental Divisions
Company’s profitability comes from 
Car Rental and Fleet Rental Divisions.
Raising
money Buying
cars
Renting Cars Selling
Cars
Cash to renew the fleet or pay debt
$
Profitability comes from rental divisions
Competitive advantages
$
9
43 years of experience in managing assets and generating value.
Competitive advantages: raising money
Global Scale
National Scale
As of February, 2017.
BB+ Fitch
Ba2 Moody’s
BB+ S&P
Baa1 Moody´s B+ S&P
Ba3 Moody´s
BB- S&P
brAA+ S&P
Aa1.br Moody’s
AAA(bra) Fitch
brAA- S&P
AA- (bra) Fitch
A- (bra) Fitch
brA+ S&P
AA- (bra) Fitch
brA S&P
A(bra) Fitch
10
Investment grade: lower spreads and longer tenors
Source: Bloomberg .
Raising
money Buying
cars
Renting Cars Selling
Cars
$
Localiza raises money with better conditions then its competitors.
Raising
money Buying
cars
Renting Cars Selling
Cars
11
Competitive advantages: buying cars
Number of cars purchased - 2016
* Includes Franchising.
Source: each company website and ANFAVEA
Localiza’s share in the internal sales
of the OEMs - 2016
4.7%
$
Localiza buys cars with better conditions due to the volume of purchases.
92,671 
45,114 
26,709 
9,122 
Localiza Movida Unidas Locamerica
*
Raising
money Buying
cars
Renting Cars Selling
Cars
12
Competitive advantages: renting cars
Brand
Brazilian distribution
#ofbranches#ofcities
Source: Each company website on 01/23/2017, 4Q16 Earnings Release..
$
The Company is present in 180 cities where the other largest networks do not operate.
502
92
227
183
Localiza Competitors
491
360
153
63
96
Localiza Unidas Hertz Movida
Raising
money Buying
cars
Renting Cars Selling
Cars
13
Localiza Fast®
Mobile‐based counter bypass:
Provides agility and control
over the car rental experience.
Customers can pick‐up car
bypassing our counter
Localiza Way®
New platform to offer 
value‐added services
Mobile Checklist
More quality, control and agility 
in providing cars for rental
Fast Checkout
More operational productivity 
and agility in returning the cars 
after rental
Connected Shuttle
Optimization of 
customer shuttle service 
at airports
Anti fraud
Taylor‐made solution for 
fraud prevention in car 
rentals
Competitive advantages: Innovation
$
Constant innovations allow maintenance of the premium service.
14
Integrated technology solution that 
increases competitive intelligence 
and leverages productivity gains.
CONNECTED FLEET
Integrated mobile solution to
fleet rental services for  drivers 
and contract manager.
MOBILE SOLUTION
Rapid diagnosis and friendly 
vision of the fleet  by the 
customer.
ONLINE FLEET RENTAL
Competitive advantages: Innovation
Raising
money Buying
cars
Renting Cars Selling
Cars
$
Differentiated offer with higher added value to the customer.
Raising
money Buying
cars
Renting Cars Selling
Cars
15
Sales to final consumer
Competitive advantages: selling cars
Buffer: additional fleet during
peaks of demand
Large database
$
Deep know how of used car market: consumer preference, pricing and residual value
NPS of 70 (survey made 90 days after the purchase)
7.3%
8.6%
6.3% 6.0%
8.0%
9.5% 10.2%
16.9% 17.1%
16.1% 16.5%
17.5% 17.0%
15.4%
2010 2011 2012 2013 2014 2015 2016
16
ROIC versus cost of debt after taxes
ROIC Cost of debt after taxes
9.6p.p. 8.5p.p. 9.5p.p.
9.8p.p. 10.5p.p.
7.5p.p. 5.2p.p.
2010 to 2014 ROIC considered income tax rate of 30% and effective income tax rate from 2015 on
Spread of 5.2p.p. in line with the Company's short-term strategy
and expectation of a sharp drop in interest in 2017
17
1. Company overview
2. Main business divisions
 Car Rental
 Fleet Rental
 Seminovos
3. Financials
Appendix: Earnings release 4Q16
Agenda
18
Car Rental overview
Compact cars
55.9%
Others 44.1%
2016 Fleet composition
94,156 cars
Corporate fleet size
65,086
70,717
77,573 76,755
94,156
2012 2013 2014 2015 2016
Car rental distribution (Brazil)
474 479 476 494 491
2012 2013 2014 2015 2016
19
Drivers
Source: BCB and Localiza rates
Car rental affordability
Source: IPEADATA , Localiza’s loyalty program and SPC
Brasil research * jun/2013
6.4 million
84 million
Adult population
(age > 20 years)
Class A+B+C
65 million
Credit Card
Owners
Increasing affordability and low penetration in leisure trips brings growth opportunities.
180
200 240
260
300350 380
415
465
510
545
622
678
724
788
880
38% 37%
35% 31%
27%
22% 20% 18% 16% 15% 15% 13% 13% 12%
11% 9%
2001 2002 2003 2004 2005 2006 2007 2008 2009 2010 2011 2012 2013 2014 2015 2016
Monthly minimum salary (R$) Daily rental price over minimum salary (%)
* The research indicated that 77% of the population owns at least one credit card. The population was 80% class A,B and C members and 20% class
D and E members.
20
Drivers
# domestic air traffic passengers
In million
Expected investment 2016-2019
(in R$ billion)
Source: Sectorial Analysis Committee / BNDES: 2016-2019 , as of February,
2016.
Source: ANAC up to 2016 and IATA-Air Passenger Forecast
Global Report, as of February, 2016.
The pipeline of investments tend to benefit
the corporate segment.
Expected annual traffic growth of 2.5% from 2017 to 2034
traffic.
70
82 89 90 96 96 89
2010 2011 2012 2013 2014 2015 2016
214.1 
142.6 
87.1 
35.8 
32.9 
32.5 
17.0 
15.5 
5.8 
Energy
Telecoms
Highways
Sanitation
Railways
Urban mobility
Airports
Ports
Solid Residues
21
Source: ABLA, each company’s website on 01/23/2017 and Localiza´s 4Q16 Earnings Release
Airport locations Off-airport locations
Car Rental Locations in Brazil
Off‐airport market is still fragmented.
22
Market Share
Gross Revenue - Car Rental 2016
Source: ABLA and Companies’ Financial Statements.
Localiza’s market share is higher than the 2nd  and 3rd players together.
33.7%
13.5%
7.6%
45.2%
Localiza
(includes franchising)
Movida
Unidas
Others
Market size:
R$5.1 billion
23
1. Company overview
2. Main business divisions
 Car Rental
 Fleet Rental
 Seminovos
3. Financials
Appendix: Earnings release 4Q16
Agenda
24
Number of clients
Fleet Rental overview
Compact
cars 33.8%
Others
66.2%
2016 Fleet composition
34,960 cars
729 760 798 849 925
2012 2013 2014 2015 2016
End of period fleet
32,104 32,809 34,312 33,948 34,960
2012 2013 2014 2015 2016
25
Source: ABLA, Datamonitor and Localiza
Rented fleet penetration
Corporate fleet:
4,000,000*
Rented fleet:
440,737
34,960
Brazilian Market World
11.0% 8.9%
13.3%
16.5%
24.5%
37.4%
46.9%
58.3%
Drivers
*Localiza estimates
Low penetration of rented fleet in Brazil.
Market Share
Gross Revenue - Fleet Rental 2016
26
Source: ABLA, Companies’ Financial Statements.
Fragmented market with low entry barriers.
12.2%
3.8%
6.5%
8.1%
69.3%
Localiza
Movida
Unidas
Others
Locamerica
Market size:
R$5.4 billion
27
1. Company overview
2. Main business divisions
 Car Rental
 Fleet Rental
 Seminovos
3. Financials
Appendix: Earnings release 4Q16
Agenda
28
# of points of sale
Car sales – operating data
55
66 73 74 75
77 84
2010 2011 2012 2013 2014 2015 2016
47,285
50,772
56,664
62,641
70,621
64,305
68,449
2010 2011 2012 2013 2014 2015 2016
# Number of cars sold (quantity)
Efficiency gain on car sales.
29
Used car sales drivers:
affordability and penetration
Affordability to buy cars – Public Price of the most 
basic Gol
300  350 
380 
415 
465 
510 
545 
622 
678 
724 
788 
880 
84 
71  69 
61 
55 
51  49 
43  43  43  41  41 
 ‐
 10
 20
 30
 40
 50
 60
 70
 80
 90
‐100
 ‐
 100
 200
 300
 400
 500
 600
 700
 800
 900
200520062007200820092010201120122013201420152016
Minimum wage (R$) Minimum wages to buy a new car
7.9
7.7
7.3
6.9
6.5
6.0
5.7
5.3
5.0 4.9 4.8
2005 2006 2007 2008 2009 2010 2011 2012 2013 2014 2015
# of inhabitants per car – Brazil 2005 ‐ 2015
Source: Sindipeças ‐ Current Fleet Report 2016,  as of April 2016.
Developed countries maintain a ratio between 1 ‐ 2 
cars per inhabitant.
Source: BCB and Localiza
Reference: to calculate the minimum wages to buy a new car we used
the public price of the Vehicle type Gol.
8.4 8.9 9.0 9.4
10.1 9.9 10.0
3.3 3.5 3.6 3.6 3.3
2.5
2.0
2010 2011 2012 2013 2014 2015 2016
30
Brazilian car market:
new x used car market and affordability
New cars
Used cars
Source: FENABRAVE (light and commercial cars)
In million of cars
Total market of 12.0 million cars.
2.5x 2.5x2.6x 2.6x 3.1x 4.0x 5.0x
31
2015 Up to 2 years
419,085
2016 Brand new
1,986,3622016 Used cars
10,008,769
0.7% 3.4% 15.3%
Car sales – operating data
Source: Anfavea and Fenabrave
Unidas, Locamerrica and Movida websites
Examples • Retailers • Dealers • Rental operators • “Auto malls”
Points of sale • 48,000 (Fenauto) • 5,592 (Anfavea)
• +115 (Unidas,
Movida, Locamerica)
• 71 (Fenauto)
Main players
32
1. Company overview
2. Main business divisions
 Car Rental
 Fleet Rental
 Seminovos
3. Financials
Appendix: Earnings release 4Q16
Agenda
Message from the CEO – highlights
 Financial discipline and strong balance sheet
Cash position and debt profile to face the tough environment
High credit ratings
 The only company in the sector to create value for shareholders
Focused on leadership, commercial and operational excellence and on active cost management
 Long‐term global strategic alliance agreement with The Hertz Corporation
Expand its market share in inbound/outbound reservations
Use the Localiza‐Hertz brand through a co‐brand agreement
Exchange knowhow, technology and expertise
 Indisputable leadership in quality and service
Net Promoter Score of over  80 in 2016
 The most visited site in its category, with more than 7.6 million visitors in 2016
195,000 downloads of its mobile app
Facebook fan page with more than 515,000 followers and the highest engagement in the category
 Protagonist on innovation
Localiza FAST na app that allows clients to open the car door without going through the counter
 Brand
25ª most valuable brand in Brazil , among other brands across different sectors
 Highest standards of ethics and corporate governance
Honored as the best company in Transparency and Ethics at the Revista Exame 2016 ranking
 Car rental division with the biggest and most diversified fleet that is renewed yearly
More than 50 models of cars, from compact to premium brands such as Audi, BMW and Volvo
33Strong ambition towards growth and expanding its market leadership
3,812  3,780  3,871 
4,111 4,242  4,308 
4,846 
5,266 
1Q 2Q 3Q 4Q
76,755  94,156 
33,948 
34,960 13,992 
14,015 
124,695 
143,131 
2015 2016
Car Rental Fleet Rental Franchising 34
4Q16 and 2016 Operational Highlights
15,047  16,348 
13,839 
17,379 
20,883 
4Q15 1Q16 2Q16 3Q16 4Q16
Cars sold– consolidated
Rental days evolution (thousand)– Car Rental Average revenues per operating car (R$ thousand)
Fleet at end of the year
20.1  20.3 
2015 2016
2015 2016 2015  2016 2015  2016 2015  2016
Net Revenues - (R$ million) EBITDA - (R$ million)
Net Income (R$ million)
402.4 409.3
2015 2016
4Q16 and 2016 Financial Highlights
35
EBIT (R$ milhões)
338.7  402.2 
155.6  170.5 
499.2 
733.3 
993.5 
1,306.0 
4Q15 4Q16
Car Rental Fleet Rental Seminovos
228.0 
270.9 
4Q15 4Q16
175.0  202.0 
4Q15 4Q16
36
Number of Daily Rentals (thousand)
28.1% increase in car rental volume and
19.0% growth in net revenue in 4Q16 versus 4Q15
10,734 
12,794  13,749  14,242  15,416  15,566 
18,662 
4,111  5,266 
2010 2011 2012 2013 2014 2015 2016 4Q15 4Q16
Car Rental
802.2 
980.7 
1,093.7  1,163.5 
1,284.4  1,258.0 
1,428.0 
334.5  398.0 
2010 2011 2012 2013 2014 2015 2016 4Q15 4Q16
Net Revenues (R$ million)
69.1% 68.9%
70.8%
66.8%
69.9% 69.3%
73.4%
2010 2011 2012 2013 2014 2015 2016
37
Utilization Rate Evolution – Car Rental
The increase in the utilization rate offset the drop in the average rate, keeping the
average revenue per operating car stable
Car Rental
Average daily rental – In R$
19.5 19.1
20.4
19.7 
20.9 
20.1 
20.3 
2010 2011 2012 2013 2014 2015 2016
78.07  79.68  82.36  84.85  87.71  84.56 
79.67 
2010 2011 2012 2013 2014 2015 2016
Average annual revenues per operating car
(R$ thousand)
Car Rental network evolution
Number of car rental locations (Brazil and abroad)
13 new corporate locations were added to the network
Localiza´s branches - Brazil Franchisees´ branches - Brazil Franchisees´ branches - abroad
234 247 272 286 304 320 333
181 202 202 193 172 174 15861 47 50 63 64 70 70476 496 524 542 540 564 561
2010 2011 2012 2013 2014 2015 2016
+13
39
Fleet Rental
361.1
455.0
535.7 575.9 571.9 608.5 651.8
155.6 170.5
2010 2011 2012 2013 2014 2015 2016 4Q15 4Q16
8,044
9,603
10,601 10,844 10,363 10,901 11,240
2,702 2,922
2010 2011 2012 2013 2014 2015 2016 4Q15 4Q16
Net Revenues (R$ million)
Number of Daily Rentals (thousand)
8.1% growth in daily volume and
9.6% in net revenue in 4Q16 versus 4Q15
Purchases (includes accessories) Used car sales net revenues
Cars purchased Cars sold
40
Net investment Fleet Expansion* (quantity)
Net Investment in Fleet (R$ million)
9,178 2,011 7,10318,649
* It does not consider theft / crashed cars.
9,183
465
(273)
65,934 
59,950  58,655 
69,744 
79,804 
64,032 
87,833 
21,660 
27,921 
47,285  50,772  56,644 
62,641 
70,621  64,305  68,449 
15,047  20,883 
2010 2011 2012 2013 2014 2015 2016 4Q15 4Q16
1,910 1,777 1,619
2,026
2,483 2,278
3,290
838
1,0781,322 1,468 1,520 1,747
2,018 2,045
2,343
499
733
2010 2011 2012 2013 2014 2015 2016 4Q15 4Q16
Strong growth in the fleet to support the Company's growth
309 99
588 279 233
6,613
339
19,384
7,038
R$947
345
41
Number of points of sale
New stores will be added to the network to support the renewal of the fleet due to
the strong growth of the Car Rental Division
55
66
73 74 75 77
84
2010 2011 2012 2013 2014 2015 2016
+7
42
Period-end fleet
Quantity
61,445 64,688 65,086 70,717 77,573 76,755
94,156
26,615 31,629 32,104 32,809 34,312 33,948
34,960
10,652
12,958 14,545 14,233 13,339 13,992
14,015
98,712
109,275 111,735 117,759 125,224 124,695
143,131
2010 2011 2012 2013 2014 2015 2016
Car Rental Fleet Rental Franchising
The car rental fleet increased 17,401 cars to meet strong demand, maintaining the
utilization rate at a record level of 73.4%
+17,401
+1,012
1,175.3 1,450.0 1,646.7 1,758.9 1,874.0 1,883.1 2,096.8
494.3 572.7
1,321.9
1,468.1 1,520.0 1,747.3
2,018.2 2,044.9
2,342.5
499.2 733.3
2,497.2
2,918.1 3,166.7
3,506.2
3,892.2 3,928.0
4,439.3
993.5
1,306.0
2010 2011 2012 2013 2014 2015 2016 4Q15 4Q16
43
Consolidated net revenues
R$ million
Rental Used car sales
31.5% increase in consolidated revenue in 4Q16 versus 4Q15
The increase of 46.9% in 4Q16 in the revenue of the Seminovos is due to 5,836 cars sold more
than in 4Q15, and to the increase of 5.9% in the car prices
44
Consolidated EBITDA
R$ million
(*)From 2012 onwards, accessories and freight of new cars have been accounted directly in the cost line, impacting EBITDA but
reducing depreciation costs.
(**) It considers the new appropriation criteria of the overhead, which is also appropriated to Seminovos.
Divisions 2010* 2011* 2012 2013 2014** 2015 2016 4Q15 4Q16
Car Rental 45.3% 46.9% 40.9% 36.8% 38.7% 31.8% 32.3% 30.2% 31.5%
Fleet Rental 68.0% 68.6% 66.4% 65.5% 60.0% 62.2% 64.5% 64.0% 63.8%
Rental Consolidated 52.3% 53.8% 49.3% 46.5% 45.3% 41.7% 42.3% 40.8% 40.8%
Used Car Sales 2.6% 2.8% 4.2% 5.7% 6.0% 7.3% 5.5% 5.2% 5.0%
Increase of R$42.9 million in EBITDA in 4Q16
649.5
821.3 875.6 916.5 969.8 934.8 1,015.6
228.0 270.9
2010 2011 2012 2013 2014 2015 2016 4Q15 4Q16
+ R$42.9
45
Average depreciation per car (in R$)
Car Rental
1,536.0 1,683.9
1,895.8 1,452.4
1,270.0
622.1
1,251.2
2010 2011 2012 2013 2014 2015 2016
2,076.6
IPI Effect
3,972.4
Average Price of cars purchased
In R$ Thousand
29.41 
33.87  36.57 4.46  2.70 
Price 2014 Increase Price 2015 Increase Price 2016
2015 2016
The increase in the average depreciation per car of the RAC is a reflection of the
slowdown of the increase of the new cars price that reflects in the seminovos cars
46
Average depreciation per car (in R$)
The drop in depreciation is due to a longer cycle
The depreciation of the cars in this division benefits from the price increase of
new cars that occurs over the life of the car
3,509.7
4,133.0
4,311.3
4,592.3
4,202.1 3,935.2 3,714.0
2010 2011 2012 2013 2014 2015 2016
1,096.9
IPI Effect
5,408.2
Fleet Rental
47
Consolidated EBIT
R$ million
Divisions 2010 2011 2012 2013 2014 2015 2016 4Q15 4Q16
Car Rental 38.5% 38.8% 23.7% 32.8% 36.2% 34.3% 30.2% 28.7% 28.4%
Fleet Rental 46.2% 45.6% 36.9% 45.1% 44.3% 48.9% 51.2% 49.9% 52.4%
Consolidated 41.0% 41.1% 28.3% 37.1% 38.8% 39.1% 36.8% 35.4% 35.3%
Even with increased car depreciation of the Car Rental Division, EBIT Margin
remained stable in 4Q16
482.1
595.7
465.8
652.1
726.7 735.5 771.1
175.0 202.0
2010 2011 2012 2013 2014 2015 2016 4Q15 4Q16
144.5
IPI Effect
610.3
+ R$27.0
48
Consolidated net income
R$ million
Increase of 1.7% in 2016 profit even with the increase of
interest and depreciation
250.5
291.6
240.9
384.3 410.6 402.4 409.3
105.9 104.4
2010 2011 2012 2013 2014 2015 2016 4Q15 4Q16
336.3
95.4
IPI Effect
Reconciliation EBITDA x Net income 2010 2011 2012 2013 2014 2015 2016 Var. R$ Var. % 4Q15 4Q16 Var. R$ Var. %
Consolidated EBITDA 649.5 821.3 875.6 916.5 969.8 934.8 1,015.6 80.8 8.6% 228.0 270.9 42.9 18.8%
Cars depreciation (146.3) (201.5) (232.4) (229.0) (207.4) (163.6) (206.3) (42.7) 26.1% (44.0) (59.5) (15.5) 35.2%
Cars additional depreciation – IPI effect - - (144.5) - - - - - - - - - -
Other property depreciation and amortization (21.1) (24.1) (32.9) (35.4) (35.7) (35.7) (38.2) (2.5) 7.0% (9.0) (9.4) (0.4) 4.4%
EBIT 482.1 595.7 465.8 652.1 726.7 735.5 771.1 35.6 4.8% 175.0 202.0 27.0 15.4%
Financial expenses, net (130.1) (179.0) (138.7) (110.6) (151.1) (202.7) (243.5) (40.8) 20.1% (43.5) (72.7) (29.2) 67.1%
Income tax and social contribution (101.5) (125.1) (135.3) (157.2) (165.0) (130.4) (118.3) 12.1 -9.3% (25.6) (24.9) 0.7 -2.7%
Income tax and social contribution – IPI effect - - 49.1 - - - - - - - - - -
Net income of the period 250.5 291.6 240.9 384.3 410.6 402.4 409.3 6.9 1.7% 105.9 104.4 (1.5) -1.4%
49
Free cash flow - FCFFree cash flow
Free cash flow - R$ million 2010 2011 2012 2013 2014 2015 2016
w
Operations
EBITDA 649.5 821.3 875.6 916.5 969.8 934.8 1,015.6
Used car sale revenue, net from taxes (1,321.9) (1,468.1) (1,520.0) (1,747.3) (2,018.2) (2,044.9) (2,342.5)
Depreciated cost of cars sold 1,203.2 1,328.6 1,360.2 1,543.8 1,777.0 1,769.1 2,102.5
(-) Income tax and social contribution (57.8) (83.0) (100.9) (108.5) (113.1) (110.7) (93.3)
Change in working capital 54.5 (83.9) 37.1 2.9 (27.1) (30.0) 113.2
Cash generated by rental operations 527.5 514.9 652.0 607.4 588.4 518.3 795.5
Capex-
Renewals
Used car sale revenue, net from taxes 1,321.9 1,468.1 1,520.0 1,747.3 2,018.2 2,036.3 2,342.5
Fleet renewal investment (1,370.1) (1,504.5) (1,563.3) (1,819.7) (2,197.7) (2,278.4) (2,563.6)
Net investment for fleet renewal (48.2) (36.4) (43.3) (72.4) (179.5) (242.1) (221.1)
Fleet renewal – quantity 47,285 50,772 56,644 62,641 70,621 64,032 68,449
Investment, other property and intangibles (50.6) (59.9) (77.8) (47.5) (46.3) (29.7) (42.2)
Free cash flow from operations, net of fleet renewal capex 428.7 418.6 530.9 487.5 362.6 246.5 532.2
Capex-Growth
Fleet growth (investment) (540.3) (272.0) (55.5) (209.4) (286.8) 8.6 (726.0)
Change in accounts payable to car suppliers 111.3 32.7 (116.9) 89.7 334.4 (121.2) 190.7
Net investment for fleet growth (429.0) (239.3) (172.4) (119.7) 47.6 (112.6) (535.3)
Fleet increase / (reduction) – quantity 18,649 9,178 2,011 7,103 9,183 (273) 19,384
Free cash flow after growth, and before interest and new HQ (0.3) 179.3 358.5 367.8 410.2 133.9 (3.1)
New headquarters construction (0.5) (3.1) (2.4) (6.5) (148.3) (30.7) (84.4)
Free cash flow before interest (0.8) 176.2 356.1 361.3 261.9 103.2 (87.5)
50
Changes in net debt
R$ million
R$288.7 million of cash generation after interest was invested to increase the fleet
532.2 
(243.5)
(726.0)
190.7 
(84.4)
(139.4)
(25.0)
(2,084.0)
Net Debt
12/31/2016
(1,588.6)
Net Debt
12/31/2015
Free cash flow after
fleet renewal and
before headquarters
Interest
Fleet
Increase of
19,384 cars
Increase in
accounts
payable to
cars
suppliers
New
headquarters
construction
Dividends
+288.7 (535.3) (248.8)
Treasury
Shares
51
Debt maturity profile (principal)
R$ million
Strong cash position and comfortable debt profile to take advantage of growth
opportunities
As of December 31, 2016
‐
558.4 
335.7 
620.8  770.0  672.5  750.0 
2016 2017 2018 2019 2020 2021 2022
Cash
1,692.3
2016
1,514.9
52
Debt - ratios
Net debt vs. Fleet value
BALANCE AT THE END OF PERIOD 2010(*) 2011 2012 2013 2014 2015 2016
Net debt / Fleet value 52% 51% 48% 48% 40% 44% 45%
Net debt / EBITDA 2.0x 1.7x 1.4x 1.5x 1.4x 1.7x 2.1x
Net debt / Equity 1.4x 1.2x 0.9x 1.0x 0.8x 0.8x 0.9x
EBITDA / Net financial expenses 5.0x 4.6x 6.3x 8.3x 6.4x 4.6x 4.2x
(*) 2010 ratios based on USGAAP financial statements
Net debt Fleet value
Low leverage supports growth targets
1,281.1 1,363.4 1,231.2 1,332.8 1,322.3 1,588.6
2,084.0
2,446.7 2,681.7 2,547.6 2,797.9
3,296.3
3,642.7
4,623.6
2010 2011 2012 2013 2014 2015 2016
53
ROIC versus cost of debt after taxes
ROIC Cost of debt after taxes
7.3%
8.6%
6.3% 6.0%
8.0%
9.5% 10.2%
16.9% 17.1%
16.1% 16.5%
17.5% 17.0%
15.4%
2010 2011 2012 2013 2014 2015 2016
9.6p.p. 8.5p.p. 9.5p.p.
9.8p.p. 10.5p.p.
7.5p.p. 5.2p.p.
2010 to 2014 ROIC considered income tax rate of 30% and effective income tax rate from 2015 on
Spread of 5.2p.p. in line with the Company's short-term strategy
and expectation of a sharp drop in interest in 2017
54
Disclaimer
Website: www.localiza.com/ir E-mail: ri@localiza.com Phone: 55 31 3247-7024
Roberto Mendes
CFO and IR
Nora Lanari
Head of IR
Eugênio Mattar
CEO
The material presented is a presentation of general background information about LOCALIZA as of the date of the presentation. It is information in summary
form and does not purport to be complete. It is not intended to be relied upon as advice to potential investors. No representation or warranty, express or
implied, is made concerning, and no reliance should be placed on, the accuracy, fairness, or completeness of the information presented herein.
This presentation contains statements that are forward-looking within the meaning of Section 27A of the Securities Act of 1933 and Section 21E of the
Securities Exchange Act of 1934. Such forward-looking statements are only projections and are not guarantees of future performance. Investors are cautioned
that any such forward-looking statements are and will be, as the case may be, subject to many risks, uncertainties and factors relating to the operations and
business environments of LOCALIZA and its subsidiaries that may cause the actual results of the companies to be materially different from any future results
expressed or implied in such forward-looking statements.
Although LOCALIZA believes that the expectations and assumptions reflected in the forward-looking statements are reasonable based on information
currently available to LOCALIZA’s management, LOCALIZA cannot guarantee future results or events. LOCALIZA expressly disclaims a duty to update any of
the forward-looking statement.
Securities may not be offered or sold in the United States unless they are registered or exempt from registration under the Securities Act of 1933.
This presentation does not constitute an offer, invitation or solicitation of an offer to subscribe to or purchase any securities. Neither this presentation nor anything
contained herein shall form the basis of any contract or commitment whatsoever.
Maria Carolina Costa
IR Manager
Mariana Campolina
IR Manager

More Related Content

What's hot

Localiza institucional inglês
Localiza institucional   inglêsLocaliza institucional   inglês
Localiza institucional inglêsLocaliza
 
Localiza institucional inglês
Localiza institucional   inglêsLocaliza institucional   inglês
Localiza institucional inglêsLocaliza
 
Localiza institucional inglês
Localiza institucional   inglêsLocaliza institucional   inglês
Localiza institucional inglêsLocaliza
 
Localiza institucional inglês
Localiza institucional   inglêsLocaliza institucional   inglês
Localiza institucional inglêsLocaliza
 
Institucional Presentation - May/15
Institucional Presentation - May/15Institucional Presentation - May/15
Institucional Presentation - May/15Localiza
 
Localiza institucional inglês
Localiza institucional   inglêsLocaliza institucional   inglês
Localiza institucional inglêsLocaliza
 
Localiza institucional inglês
Localiza institucional inglêsLocaliza institucional inglês
Localiza institucional inglêsLocaliza
 
Institucional Presentation - May/16
Institucional Presentation - May/16Institucional Presentation - May/16
Institucional Presentation - May/16Localiza
 
Institucional Presentation - May/15
Institucional Presentation - May/15Institucional Presentation - May/15
Institucional Presentation - May/15Localiza
 
Institucional Presentation - May/15
Institucional Presentation - May/15Institucional Presentation - May/15
Institucional Presentation - May/15Localiza
 
Institucional Presentation - December/15
Institucional Presentation - December/15Institucional Presentation - December/15
Institucional Presentation - December/15Localiza
 
Localiza institucional inglês
Localiza institucional   inglêsLocaliza institucional   inglês
Localiza institucional inglêsLocaliza
 
Virtual Investor Conference OTC - May/16
Virtual Investor Conference OTC - May/16Virtual Investor Conference OTC - May/16
Virtual Investor Conference OTC - May/16Localiza
 
Institucional Presentation - March/16
Institucional Presentation - March/16Institucional Presentation - March/16
Institucional Presentation - March/16Localiza
 
Institucional Presentation - February/15
Institucional Presentation - February/15Institucional Presentation - February/15
Institucional Presentation - February/15Localiza
 
Localiza institucional ingles final
Localiza institucional   ingles finalLocaliza institucional   ingles final
Localiza institucional ingles finalLocaliza
 
Institutional Presentation - February, 2015
Institutional Presentation - February, 2015Institutional Presentation - February, 2015
Institutional Presentation - February, 2015Localiza
 
Localiza institucional eng final
Localiza institucional eng finalLocaliza institucional eng final
Localiza institucional eng finalLocaliza
 
Institucional Presentation - May/16
Institucional Presentation - May/16Institucional Presentation - May/16
Institucional Presentation - May/16Localiza
 

What's hot (19)

Localiza institucional inglês
Localiza institucional   inglêsLocaliza institucional   inglês
Localiza institucional inglês
 
Localiza institucional inglês
Localiza institucional   inglêsLocaliza institucional   inglês
Localiza institucional inglês
 
Localiza institucional inglês
Localiza institucional   inglêsLocaliza institucional   inglês
Localiza institucional inglês
 
Localiza institucional inglês
Localiza institucional   inglêsLocaliza institucional   inglês
Localiza institucional inglês
 
Institucional Presentation - May/15
Institucional Presentation - May/15Institucional Presentation - May/15
Institucional Presentation - May/15
 
Localiza institucional inglês
Localiza institucional   inglêsLocaliza institucional   inglês
Localiza institucional inglês
 
Localiza institucional inglês
Localiza institucional inglêsLocaliza institucional inglês
Localiza institucional inglês
 
Institucional Presentation - May/16
Institucional Presentation - May/16Institucional Presentation - May/16
Institucional Presentation - May/16
 
Institucional Presentation - May/15
Institucional Presentation - May/15Institucional Presentation - May/15
Institucional Presentation - May/15
 
Institucional Presentation - May/15
Institucional Presentation - May/15Institucional Presentation - May/15
Institucional Presentation - May/15
 
Institucional Presentation - December/15
Institucional Presentation - December/15Institucional Presentation - December/15
Institucional Presentation - December/15
 
Localiza institucional inglês
Localiza institucional   inglêsLocaliza institucional   inglês
Localiza institucional inglês
 
Virtual Investor Conference OTC - May/16
Virtual Investor Conference OTC - May/16Virtual Investor Conference OTC - May/16
Virtual Investor Conference OTC - May/16
 
Institucional Presentation - March/16
Institucional Presentation - March/16Institucional Presentation - March/16
Institucional Presentation - March/16
 
Institucional Presentation - February/15
Institucional Presentation - February/15Institucional Presentation - February/15
Institucional Presentation - February/15
 
Localiza institucional ingles final
Localiza institucional   ingles finalLocaliza institucional   ingles final
Localiza institucional ingles final
 
Institutional Presentation - February, 2015
Institutional Presentation - February, 2015Institutional Presentation - February, 2015
Institutional Presentation - February, 2015
 
Localiza institucional eng final
Localiza institucional eng finalLocaliza institucional eng final
Localiza institucional eng final
 
Institucional Presentation - May/16
Institucional Presentation - May/16Institucional Presentation - May/16
Institucional Presentation - May/16
 

Similar to Localiza institucional inglês

Institutional Presentation - February/17
Institutional Presentation - February/17Institutional Presentation - February/17
Institutional Presentation - February/17Localiza
 
Institucional Presentation - July/15
Institucional Presentation - July/15Institucional Presentation - July/15
Institucional Presentation - July/15Localiza
 
Institucional Presentation - Julho/15
Institucional Presentation - Julho/15Institucional Presentation - Julho/15
Institucional Presentation - Julho/15Localiza
 
Institucional Presentation - April/15
Institucional Presentation - April/15Institucional Presentation - April/15
Institucional Presentation - April/15Localiza
 
Institutional Presentation - October/16
Institutional Presentation - October/16Institutional Presentation - October/16
Institutional Presentation - October/16Localiza
 
Institutional Presentation - November, 2014
Institutional Presentation - November, 2014Institutional Presentation - November, 2014
Institutional Presentation - November, 2014Localiza
 
Localiza institucional inglês
Localiza institucional   inglêsLocaliza institucional   inglês
Localiza institucional inglêsLocaliza
 
Institucional Presentation - February/15
Institucional Presentation - February/15Institucional Presentation - February/15
Institucional Presentation - February/15Localiza
 
Localiza institucional inglês
Localiza institucional   inglêsLocaliza institucional   inglês
Localiza institucional inglêsLocaliza
 
Institutional Presentation
Institutional PresentationInstitutional Presentation
Institutional PresentationLocaliza
 
Institutional Presentation 2T14
Institutional Presentation 2T14Institutional Presentation 2T14
Institutional Presentation 2T14Localiza
 
Localiza institucional inglês
Localiza institucional   inglês Localiza institucional   inglês
Localiza institucional inglês Localiza
 
Institucional Presentation - December/15
Institucional Presentation - December/15Institucional Presentation - December/15
Institucional Presentation - December/15Localiza
 
Institucional Presentation - March/16
Institucional Presentation - March/16Institucional Presentation - March/16
Institucional Presentation - March/16Localiza
 
Institucional Presentation - March/16
Institucional Presentation - March/16Institucional Presentation - March/16
Institucional Presentation - March/16Localiza
 
Localiza institucional ingles 2018
Localiza institucional   ingles 2018 Localiza institucional   ingles 2018
Localiza institucional ingles 2018 Localiza
 
Localiza institucional inglês
Localiza institucional inglêsLocaliza institucional inglês
Localiza institucional inglêsLocaliza
 

Similar to Localiza institucional inglês (17)

Institutional Presentation - February/17
Institutional Presentation - February/17Institutional Presentation - February/17
Institutional Presentation - February/17
 
Institucional Presentation - July/15
Institucional Presentation - July/15Institucional Presentation - July/15
Institucional Presentation - July/15
 
Institucional Presentation - Julho/15
Institucional Presentation - Julho/15Institucional Presentation - Julho/15
Institucional Presentation - Julho/15
 
Institucional Presentation - April/15
Institucional Presentation - April/15Institucional Presentation - April/15
Institucional Presentation - April/15
 
Institutional Presentation - October/16
Institutional Presentation - October/16Institutional Presentation - October/16
Institutional Presentation - October/16
 
Institutional Presentation - November, 2014
Institutional Presentation - November, 2014Institutional Presentation - November, 2014
Institutional Presentation - November, 2014
 
Localiza institucional inglês
Localiza institucional   inglêsLocaliza institucional   inglês
Localiza institucional inglês
 
Institucional Presentation - February/15
Institucional Presentation - February/15Institucional Presentation - February/15
Institucional Presentation - February/15
 
Localiza institucional inglês
Localiza institucional   inglêsLocaliza institucional   inglês
Localiza institucional inglês
 
Institutional Presentation
Institutional PresentationInstitutional Presentation
Institutional Presentation
 
Institutional Presentation 2T14
Institutional Presentation 2T14Institutional Presentation 2T14
Institutional Presentation 2T14
 
Localiza institucional inglês
Localiza institucional   inglês Localiza institucional   inglês
Localiza institucional inglês
 
Institucional Presentation - December/15
Institucional Presentation - December/15Institucional Presentation - December/15
Institucional Presentation - December/15
 
Institucional Presentation - March/16
Institucional Presentation - March/16Institucional Presentation - March/16
Institucional Presentation - March/16
 
Institucional Presentation - March/16
Institucional Presentation - March/16Institucional Presentation - March/16
Institucional Presentation - March/16
 
Localiza institucional ingles 2018
Localiza institucional   ingles 2018 Localiza institucional   ingles 2018
Localiza institucional ingles 2018
 
Localiza institucional inglês
Localiza institucional inglêsLocaliza institucional inglês
Localiza institucional inglês
 

More from Localiza

Localiza institucional inglês
Localiza institucional  inglêsLocaliza institucional  inglês
Localiza institucional inglêsLocaliza
 
Localiza institucional português
Localiza institucional portuguêsLocaliza institucional português
Localiza institucional portuguêsLocaliza
 
Localiza institucional inglês
Localiza institucional   inglêsLocaliza institucional   inglês
Localiza institucional inglêsLocaliza
 
Localiza institucional português
Localiza institucional   portuguêsLocaliza institucional   português
Localiza institucional portuguêsLocaliza
 
Investor Relations Presentation - Jul/2018
Investor Relations Presentation - Jul/2018Investor Relations Presentation - Jul/2018
Investor Relations Presentation - Jul/2018Localiza
 
Apresentação Institucional - julho 2018
Apresentação Institucional - julho 2018Apresentação Institucional - julho 2018
Apresentação Institucional - julho 2018Localiza
 
Webcast - 2Q18
Webcast - 2Q18Webcast - 2Q18
Webcast - 2Q18Localiza
 
Webcast - 2T18
Webcast - 2T18Webcast - 2T18
Webcast - 2T18Localiza
 
Webcast - 1Q18
Webcast - 1Q18Webcast - 1Q18
Webcast - 1Q18Localiza
 
Webcast - 1T18
Webcast - 1T18Webcast - 1T18
Webcast - 1T18Localiza
 
Localiza institucional português
Localiza institucional portuguêsLocaliza institucional português
Localiza institucional portuguêsLocaliza
 
Localiza institucional inglês
Localiza institucional inglêsLocaliza institucional inglês
Localiza institucional inglêsLocaliza
 
Localiza institucional português
Localiza institucional portuguêsLocaliza institucional português
Localiza institucional portuguêsLocaliza
 
Localiza institucional portugues
Localiza institucional   portuguesLocaliza institucional   portugues
Localiza institucional portuguesLocaliza
 
Localiza institucional ingles
Localiza institucional inglesLocaliza institucional ingles
Localiza institucional inglesLocaliza
 
Localiza institucional portugues
Localiza institucional   portuguesLocaliza institucional   portugues
Localiza institucional portuguesLocaliza
 
Localiza institucional portugues
Localiza institucional   portugues Localiza institucional   portugues
Localiza institucional portugues Localiza
 
Webcast 4 q17 ing
Webcast 4 q17 ingWebcast 4 q17 ing
Webcast 4 q17 ingLocaliza
 
Webcast 4 t17 port
Webcast  4 t17 portWebcast  4 t17 port
Webcast 4 t17 portLocaliza
 
Localiza institucional portugues 2018
Localiza institucional   portugues 2018Localiza institucional   portugues 2018
Localiza institucional portugues 2018Localiza
 

More from Localiza (20)

Localiza institucional inglês
Localiza institucional  inglêsLocaliza institucional  inglês
Localiza institucional inglês
 
Localiza institucional português
Localiza institucional portuguêsLocaliza institucional português
Localiza institucional português
 
Localiza institucional inglês
Localiza institucional   inglêsLocaliza institucional   inglês
Localiza institucional inglês
 
Localiza institucional português
Localiza institucional   portuguêsLocaliza institucional   português
Localiza institucional português
 
Investor Relations Presentation - Jul/2018
Investor Relations Presentation - Jul/2018Investor Relations Presentation - Jul/2018
Investor Relations Presentation - Jul/2018
 
Apresentação Institucional - julho 2018
Apresentação Institucional - julho 2018Apresentação Institucional - julho 2018
Apresentação Institucional - julho 2018
 
Webcast - 2Q18
Webcast - 2Q18Webcast - 2Q18
Webcast - 2Q18
 
Webcast - 2T18
Webcast - 2T18Webcast - 2T18
Webcast - 2T18
 
Webcast - 1Q18
Webcast - 1Q18Webcast - 1Q18
Webcast - 1Q18
 
Webcast - 1T18
Webcast - 1T18Webcast - 1T18
Webcast - 1T18
 
Localiza institucional português
Localiza institucional portuguêsLocaliza institucional português
Localiza institucional português
 
Localiza institucional inglês
Localiza institucional inglêsLocaliza institucional inglês
Localiza institucional inglês
 
Localiza institucional português
Localiza institucional portuguêsLocaliza institucional português
Localiza institucional português
 
Localiza institucional portugues
Localiza institucional   portuguesLocaliza institucional   portugues
Localiza institucional portugues
 
Localiza institucional ingles
Localiza institucional inglesLocaliza institucional ingles
Localiza institucional ingles
 
Localiza institucional portugues
Localiza institucional   portuguesLocaliza institucional   portugues
Localiza institucional portugues
 
Localiza institucional portugues
Localiza institucional   portugues Localiza institucional   portugues
Localiza institucional portugues
 
Webcast 4 q17 ing
Webcast 4 q17 ingWebcast 4 q17 ing
Webcast 4 q17 ing
 
Webcast 4 t17 port
Webcast  4 t17 portWebcast  4 t17 port
Webcast 4 t17 port
 
Localiza institucional portugues 2018
Localiza institucional   portugues 2018Localiza institucional   portugues 2018
Localiza institucional portugues 2018
 

Recently uploaded

The Economic History of the U.S. Lecture 18.pdf
The Economic History of the U.S. Lecture 18.pdfThe Economic History of the U.S. Lecture 18.pdf
The Economic History of the U.S. Lecture 18.pdfGale Pooley
 
The Economic History of the U.S. Lecture 19.pdf
The Economic History of the U.S. Lecture 19.pdfThe Economic History of the U.S. Lecture 19.pdf
The Economic History of the U.S. Lecture 19.pdfGale Pooley
 
03_Emmanuel Ndiaye_Degroof Petercam.pptx
03_Emmanuel Ndiaye_Degroof Petercam.pptx03_Emmanuel Ndiaye_Degroof Petercam.pptx
03_Emmanuel Ndiaye_Degroof Petercam.pptxFinTech Belgium
 
Instant Issue Debit Cards - School Designs
Instant Issue Debit Cards - School DesignsInstant Issue Debit Cards - School Designs
Instant Issue Debit Cards - School Designsegoetzinger
 
VVIP Pune Call Girls Katraj (7001035870) Pune Escorts Nearby with Complete Sa...
VVIP Pune Call Girls Katraj (7001035870) Pune Escorts Nearby with Complete Sa...VVIP Pune Call Girls Katraj (7001035870) Pune Escorts Nearby with Complete Sa...
VVIP Pune Call Girls Katraj (7001035870) Pune Escorts Nearby with Complete Sa...Call Girls in Nagpur High Profile
 
VIP Kolkata Call Girl Serampore 👉 8250192130 Available With Room
VIP Kolkata Call Girl Serampore 👉 8250192130  Available With RoomVIP Kolkata Call Girl Serampore 👉 8250192130  Available With Room
VIP Kolkata Call Girl Serampore 👉 8250192130 Available With Roomdivyansh0kumar0
 
02_Fabio Colombo_Accenture_MeetupDora&Cybersecurity.pptx
02_Fabio Colombo_Accenture_MeetupDora&Cybersecurity.pptx02_Fabio Colombo_Accenture_MeetupDora&Cybersecurity.pptx
02_Fabio Colombo_Accenture_MeetupDora&Cybersecurity.pptxFinTech Belgium
 
Malad Call Girl in Services 9892124323 | ₹,4500 With Room Free Delivery
Malad Call Girl in Services  9892124323 | ₹,4500 With Room Free DeliveryMalad Call Girl in Services  9892124323 | ₹,4500 With Room Free Delivery
Malad Call Girl in Services 9892124323 | ₹,4500 With Room Free DeliveryPooja Nehwal
 
High Class Call Girls Nashik Maya 7001305949 Independent Escort Service Nashik
High Class Call Girls Nashik Maya 7001305949 Independent Escort Service NashikHigh Class Call Girls Nashik Maya 7001305949 Independent Escort Service Nashik
High Class Call Girls Nashik Maya 7001305949 Independent Escort Service NashikCall Girls in Nagpur High Profile
 
Call US 📞 9892124323 ✅ Kurla Call Girls In Kurla ( Mumbai ) secure service
Call US 📞 9892124323 ✅ Kurla Call Girls In Kurla ( Mumbai ) secure serviceCall US 📞 9892124323 ✅ Kurla Call Girls In Kurla ( Mumbai ) secure service
Call US 📞 9892124323 ✅ Kurla Call Girls In Kurla ( Mumbai ) secure servicePooja Nehwal
 
Log your LOA pain with Pension Lab's brilliant campaign
Log your LOA pain with Pension Lab's brilliant campaignLog your LOA pain with Pension Lab's brilliant campaign
Log your LOA pain with Pension Lab's brilliant campaignHenry Tapper
 
Russian Call Girls In Gtb Nagar (Delhi) 9711199012 💋✔💕😘 Naughty Call Girls Se...
Russian Call Girls In Gtb Nagar (Delhi) 9711199012 💋✔💕😘 Naughty Call Girls Se...Russian Call Girls In Gtb Nagar (Delhi) 9711199012 💋✔💕😘 Naughty Call Girls Se...
Russian Call Girls In Gtb Nagar (Delhi) 9711199012 💋✔💕😘 Naughty Call Girls Se...shivangimorya083
 
20240417-Calibre-April-2024-Investor-Presentation.pdf
20240417-Calibre-April-2024-Investor-Presentation.pdf20240417-Calibre-April-2024-Investor-Presentation.pdf
20240417-Calibre-April-2024-Investor-Presentation.pdfAdnet Communications
 
(DIYA) Bhumkar Chowk Call Girls Just Call 7001035870 [ Cash on Delivery ] Pun...
(DIYA) Bhumkar Chowk Call Girls Just Call 7001035870 [ Cash on Delivery ] Pun...(DIYA) Bhumkar Chowk Call Girls Just Call 7001035870 [ Cash on Delivery ] Pun...
(DIYA) Bhumkar Chowk Call Girls Just Call 7001035870 [ Cash on Delivery ] Pun...ranjana rawat
 
Independent Lucknow Call Girls 8923113531WhatsApp Lucknow Call Girls make you...
Independent Lucknow Call Girls 8923113531WhatsApp Lucknow Call Girls make you...Independent Lucknow Call Girls 8923113531WhatsApp Lucknow Call Girls make you...
Independent Lucknow Call Girls 8923113531WhatsApp Lucknow Call Girls make you...makika9823
 
Independent Call Girl Number in Kurla Mumbai📲 Pooja Nehwal 9892124323 💞 Full ...
Independent Call Girl Number in Kurla Mumbai📲 Pooja Nehwal 9892124323 💞 Full ...Independent Call Girl Number in Kurla Mumbai📲 Pooja Nehwal 9892124323 💞 Full ...
Independent Call Girl Number in Kurla Mumbai📲 Pooja Nehwal 9892124323 💞 Full ...Pooja Nehwal
 
Bladex Earnings Call Presentation 1Q2024
Bladex Earnings Call Presentation 1Q2024Bladex Earnings Call Presentation 1Q2024
Bladex Earnings Call Presentation 1Q2024Bladex
 
Andheri Call Girls In 9825968104 Mumbai Hot Models
Andheri Call Girls In 9825968104 Mumbai Hot ModelsAndheri Call Girls In 9825968104 Mumbai Hot Models
Andheri Call Girls In 9825968104 Mumbai Hot Modelshematsharma006
 

Recently uploaded (20)

Commercial Bank Economic Capsule - April 2024
Commercial Bank Economic Capsule - April 2024Commercial Bank Economic Capsule - April 2024
Commercial Bank Economic Capsule - April 2024
 
The Economic History of the U.S. Lecture 18.pdf
The Economic History of the U.S. Lecture 18.pdfThe Economic History of the U.S. Lecture 18.pdf
The Economic History of the U.S. Lecture 18.pdf
 
The Economic History of the U.S. Lecture 19.pdf
The Economic History of the U.S. Lecture 19.pdfThe Economic History of the U.S. Lecture 19.pdf
The Economic History of the U.S. Lecture 19.pdf
 
03_Emmanuel Ndiaye_Degroof Petercam.pptx
03_Emmanuel Ndiaye_Degroof Petercam.pptx03_Emmanuel Ndiaye_Degroof Petercam.pptx
03_Emmanuel Ndiaye_Degroof Petercam.pptx
 
Instant Issue Debit Cards - School Designs
Instant Issue Debit Cards - School DesignsInstant Issue Debit Cards - School Designs
Instant Issue Debit Cards - School Designs
 
VVIP Pune Call Girls Katraj (7001035870) Pune Escorts Nearby with Complete Sa...
VVIP Pune Call Girls Katraj (7001035870) Pune Escorts Nearby with Complete Sa...VVIP Pune Call Girls Katraj (7001035870) Pune Escorts Nearby with Complete Sa...
VVIP Pune Call Girls Katraj (7001035870) Pune Escorts Nearby with Complete Sa...
 
VIP Kolkata Call Girl Serampore 👉 8250192130 Available With Room
VIP Kolkata Call Girl Serampore 👉 8250192130  Available With RoomVIP Kolkata Call Girl Serampore 👉 8250192130  Available With Room
VIP Kolkata Call Girl Serampore 👉 8250192130 Available With Room
 
02_Fabio Colombo_Accenture_MeetupDora&Cybersecurity.pptx
02_Fabio Colombo_Accenture_MeetupDora&Cybersecurity.pptx02_Fabio Colombo_Accenture_MeetupDora&Cybersecurity.pptx
02_Fabio Colombo_Accenture_MeetupDora&Cybersecurity.pptx
 
Malad Call Girl in Services 9892124323 | ₹,4500 With Room Free Delivery
Malad Call Girl in Services  9892124323 | ₹,4500 With Room Free DeliveryMalad Call Girl in Services  9892124323 | ₹,4500 With Room Free Delivery
Malad Call Girl in Services 9892124323 | ₹,4500 With Room Free Delivery
 
High Class Call Girls Nashik Maya 7001305949 Independent Escort Service Nashik
High Class Call Girls Nashik Maya 7001305949 Independent Escort Service NashikHigh Class Call Girls Nashik Maya 7001305949 Independent Escort Service Nashik
High Class Call Girls Nashik Maya 7001305949 Independent Escort Service Nashik
 
Call US 📞 9892124323 ✅ Kurla Call Girls In Kurla ( Mumbai ) secure service
Call US 📞 9892124323 ✅ Kurla Call Girls In Kurla ( Mumbai ) secure serviceCall US 📞 9892124323 ✅ Kurla Call Girls In Kurla ( Mumbai ) secure service
Call US 📞 9892124323 ✅ Kurla Call Girls In Kurla ( Mumbai ) secure service
 
Log your LOA pain with Pension Lab's brilliant campaign
Log your LOA pain with Pension Lab's brilliant campaignLog your LOA pain with Pension Lab's brilliant campaign
Log your LOA pain with Pension Lab's brilliant campaign
 
Russian Call Girls In Gtb Nagar (Delhi) 9711199012 💋✔💕😘 Naughty Call Girls Se...
Russian Call Girls In Gtb Nagar (Delhi) 9711199012 💋✔💕😘 Naughty Call Girls Se...Russian Call Girls In Gtb Nagar (Delhi) 9711199012 💋✔💕😘 Naughty Call Girls Se...
Russian Call Girls In Gtb Nagar (Delhi) 9711199012 💋✔💕😘 Naughty Call Girls Se...
 
20240417-Calibre-April-2024-Investor-Presentation.pdf
20240417-Calibre-April-2024-Investor-Presentation.pdf20240417-Calibre-April-2024-Investor-Presentation.pdf
20240417-Calibre-April-2024-Investor-Presentation.pdf
 
Veritas Interim Report 1 January–31 March 2024
Veritas Interim Report 1 January–31 March 2024Veritas Interim Report 1 January–31 March 2024
Veritas Interim Report 1 January–31 March 2024
 
(DIYA) Bhumkar Chowk Call Girls Just Call 7001035870 [ Cash on Delivery ] Pun...
(DIYA) Bhumkar Chowk Call Girls Just Call 7001035870 [ Cash on Delivery ] Pun...(DIYA) Bhumkar Chowk Call Girls Just Call 7001035870 [ Cash on Delivery ] Pun...
(DIYA) Bhumkar Chowk Call Girls Just Call 7001035870 [ Cash on Delivery ] Pun...
 
Independent Lucknow Call Girls 8923113531WhatsApp Lucknow Call Girls make you...
Independent Lucknow Call Girls 8923113531WhatsApp Lucknow Call Girls make you...Independent Lucknow Call Girls 8923113531WhatsApp Lucknow Call Girls make you...
Independent Lucknow Call Girls 8923113531WhatsApp Lucknow Call Girls make you...
 
Independent Call Girl Number in Kurla Mumbai📲 Pooja Nehwal 9892124323 💞 Full ...
Independent Call Girl Number in Kurla Mumbai📲 Pooja Nehwal 9892124323 💞 Full ...Independent Call Girl Number in Kurla Mumbai📲 Pooja Nehwal 9892124323 💞 Full ...
Independent Call Girl Number in Kurla Mumbai📲 Pooja Nehwal 9892124323 💞 Full ...
 
Bladex Earnings Call Presentation 1Q2024
Bladex Earnings Call Presentation 1Q2024Bladex Earnings Call Presentation 1Q2024
Bladex Earnings Call Presentation 1Q2024
 
Andheri Call Girls In 9825968104 Mumbai Hot Models
Andheri Call Girls In 9825968104 Mumbai Hot ModelsAndheri Call Girls In 9825968104 Mumbai Hot Models
Andheri Call Girls In 9825968104 Mumbai Hot Models
 

Localiza institucional inglês

  • 2. 1. Company overview 2. Main business divisions  Car Rental  Fleet Rental  Seminovos 3. Financials Appendix: Earnings release 4Q16 Agenda 2
  • 3. Company: milestones Phase I – Rise to #1 1973 – Founded in Belo Horizonte/MG Late 70’s - Acquisitions in the Northeast of Brazil 1981 – Brazilian car rental leader in # of branches Phase II – Expansion 1984 – Expansion strategy by adjacencies: Franchising 1991 – Expansion strategy by adjacencies: Seminovos 1997 – Expansion strategy by adjacencies: Fleet Rental 1997 – PE firm DL&J enters at a market cap of US$ 150 mm Phase III – Reaching Scale 2005 – IPO: market cap of US$ 295 mm 2011 – Rated as investment grade by Moody’s, Fitch and S&P in 2012 2012 – ADR level I 12/31/2016 – Market cap of about US$2.2 bi with ADTV of US$11.3 million 1973 1982 1983 2004 2005 2016 3
  • 4. Company: integrated business platform Synergies: bargaining power cost reduction cross selling  14,015 cars  158 locations in Brazil  70 locations in South America  33 employees  49.8% sold to final consumer  84 stores  53 cities  1.029 employees  94,156 cars  6.4 million clients  333 locations  4,865 employees  34,948 cars  925 clients  397 employees Based on the 4Q16 4 Car Rental Fleet Rental SeminovosFranchising This integrated business platform gives Localiza flexibility and superior performance.
  • 5. 5  High fixed cost  Standard fleet  1 year cycle  High entry barriers  Gains of scale  Intensive capital  Consolidated in airport market  Fragmented off airport market  Support area  Reduces depreciation  Know How of used cars market  Low dependence on intermediates  Supplementary business  Important for distribution  High profitability  Low contribution in results Company: Business platform divisions Car Rental Rents to individuals and companies at airports and off airport locations. Franchising Contributes to expand the Localiza’s network. Fleet Rental Outsources fleet for 2-3 years term contracts. Used Car Sales Sells the used cars mainly to final consumers after the rental and estimates the residual values.  Low fixed cost  Customized fleet  3 years cycle  Low entry barriers  Intensive capital
  • 6. 6 Net car sale revenue R$31.61 year cycle Car Rental Division - 2016 Financial Cycle Per car R$35.2 Average car price (past 2 years) 1 2 3 4 5 6 7 8 9 10 11 12Expenses, interest and tax Revenue Total 1 year R$ % R$ % R$ Net revenues 20.3 100.0% 34.6 100.0% 55.0 Costs - fixed and variable (10.1) -49.5% (10.1) SG&A (3.7) -18.1% (3.1) -8.9% (6.8) Net revenues of car sold 31.6 91.1% 31.6 Book value of car sold (30.0) -86.6% (30.0) EBITDA 6.6 32.3% 1.6 4.6% 8.2 Cars Depreciation (1.3) -3.6% (1.3) Others depreciation (0.3) -1.7% (0.1) -0.4% (0.5) Financial expenses (2.5) -7.2% (2.5) Taxes (1.9) -9.2% 0.7 2.0% (1.2) Net Income (Loss) 4.4 21.5% (1.6) -4.6% 2.8 NOPAT 5.0 ROIC 14.2% Cost of debt after taxes 10.2% Car Rental Seminovos Per car soldPer operating car
  • 7. 7 Net car sale revenue R$29.2 3 year cycle Fleet Rental Division - 2016 Financial Cycle Per car 1 2 3 4 5 6 31 32 33 34 35 36Expenses, interest and tax Revenue R$42.9 Average car price (past 2 years) Total 3 years R$ % Seminovos % R$ Net revenues 61.3 100.0% 32.0 100.0% 93.3 Costs - fixed and variable (18.2) -29.7% (18.2) SG&A (3.6) -5.8% (2.9) -8.9% (6.4) Net revenues of car sold 29.2 91.1% 29.2 Book value of car sold (25.7) -80.4% (25.7) EBITDA 39.5 64.5% 3.4 10.7% 42.9 Cars Depreciation (11.1) -34.8% (11.1) Others depreciation (0.3) -0.4% (0.2) -0.5% (0.4) Financial expenses (6.5) -20.2% (6.5) Taxes (11.8) -19.2% 4.3 13.5% (7.5) Net Income (Loss) 27.5 44.8% (10.1) -31.4% 17.4 Net Income (Loss) - per year 9.2 44.8% (3.4) -31.4% 5.8 NOPAT 8.1 ROIC 18.9% Cost of debt after taxes 10.2% Per operating car Fleet Rental Seminovos Per car sold
  • 8. 8 2016 Consolidated breakdown R$ million R$ 128 13% R$ 420 41% R$ 468 46% R$ 334 43% R$ 437 57% Net Revenues R$4,439 EBITDA R$1,016 R$ 2,343 53% R$ 652 15% R$ 1,445 32% EBIT* R$771 *Seminovos results recorded in the Car Rental and Fleet Rental Divisions Company’s profitability comes from  Car Rental and Fleet Rental Divisions.
  • 9. Raising money Buying cars Renting Cars Selling Cars Cash to renew the fleet or pay debt $ Profitability comes from rental divisions Competitive advantages $ 9 43 years of experience in managing assets and generating value.
  • 10. Competitive advantages: raising money Global Scale National Scale As of February, 2017. BB+ Fitch Ba2 Moody’s BB+ S&P Baa1 Moody´s B+ S&P Ba3 Moody´s BB- S&P brAA+ S&P Aa1.br Moody’s AAA(bra) Fitch brAA- S&P AA- (bra) Fitch A- (bra) Fitch brA+ S&P AA- (bra) Fitch brA S&P A(bra) Fitch 10 Investment grade: lower spreads and longer tenors Source: Bloomberg . Raising money Buying cars Renting Cars Selling Cars $ Localiza raises money with better conditions then its competitors.
  • 11. Raising money Buying cars Renting Cars Selling Cars 11 Competitive advantages: buying cars Number of cars purchased - 2016 * Includes Franchising. Source: each company website and ANFAVEA Localiza’s share in the internal sales of the OEMs - 2016 4.7% $ Localiza buys cars with better conditions due to the volume of purchases. 92,671  45,114  26,709  9,122  Localiza Movida Unidas Locamerica *
  • 12. Raising money Buying cars Renting Cars Selling Cars 12 Competitive advantages: renting cars Brand Brazilian distribution #ofbranches#ofcities Source: Each company website on 01/23/2017, 4Q16 Earnings Release.. $ The Company is present in 180 cities where the other largest networks do not operate. 502 92 227 183 Localiza Competitors 491 360 153 63 96 Localiza Unidas Hertz Movida
  • 13. Raising money Buying cars Renting Cars Selling Cars 13 Localiza Fast® Mobile‐based counter bypass: Provides agility and control over the car rental experience. Customers can pick‐up car bypassing our counter Localiza Way® New platform to offer  value‐added services Mobile Checklist More quality, control and agility  in providing cars for rental Fast Checkout More operational productivity  and agility in returning the cars  after rental Connected Shuttle Optimization of  customer shuttle service  at airports Anti fraud Taylor‐made solution for  fraud prevention in car  rentals Competitive advantages: Innovation $ Constant innovations allow maintenance of the premium service.
  • 14. 14 Integrated technology solution that  increases competitive intelligence  and leverages productivity gains. CONNECTED FLEET Integrated mobile solution to fleet rental services for  drivers  and contract manager. MOBILE SOLUTION Rapid diagnosis and friendly  vision of the fleet  by the  customer. ONLINE FLEET RENTAL Competitive advantages: Innovation Raising money Buying cars Renting Cars Selling Cars $ Differentiated offer with higher added value to the customer.
  • 15. Raising money Buying cars Renting Cars Selling Cars 15 Sales to final consumer Competitive advantages: selling cars Buffer: additional fleet during peaks of demand Large database $ Deep know how of used car market: consumer preference, pricing and residual value NPS of 70 (survey made 90 days after the purchase)
  • 16. 7.3% 8.6% 6.3% 6.0% 8.0% 9.5% 10.2% 16.9% 17.1% 16.1% 16.5% 17.5% 17.0% 15.4% 2010 2011 2012 2013 2014 2015 2016 16 ROIC versus cost of debt after taxes ROIC Cost of debt after taxes 9.6p.p. 8.5p.p. 9.5p.p. 9.8p.p. 10.5p.p. 7.5p.p. 5.2p.p. 2010 to 2014 ROIC considered income tax rate of 30% and effective income tax rate from 2015 on Spread of 5.2p.p. in line with the Company's short-term strategy and expectation of a sharp drop in interest in 2017
  • 17. 17 1. Company overview 2. Main business divisions  Car Rental  Fleet Rental  Seminovos 3. Financials Appendix: Earnings release 4Q16 Agenda
  • 18. 18 Car Rental overview Compact cars 55.9% Others 44.1% 2016 Fleet composition 94,156 cars Corporate fleet size 65,086 70,717 77,573 76,755 94,156 2012 2013 2014 2015 2016 Car rental distribution (Brazil) 474 479 476 494 491 2012 2013 2014 2015 2016
  • 19. 19 Drivers Source: BCB and Localiza rates Car rental affordability Source: IPEADATA , Localiza’s loyalty program and SPC Brasil research * jun/2013 6.4 million 84 million Adult population (age > 20 years) Class A+B+C 65 million Credit Card Owners Increasing affordability and low penetration in leisure trips brings growth opportunities. 180 200 240 260 300350 380 415 465 510 545 622 678 724 788 880 38% 37% 35% 31% 27% 22% 20% 18% 16% 15% 15% 13% 13% 12% 11% 9% 2001 2002 2003 2004 2005 2006 2007 2008 2009 2010 2011 2012 2013 2014 2015 2016 Monthly minimum salary (R$) Daily rental price over minimum salary (%) * The research indicated that 77% of the population owns at least one credit card. The population was 80% class A,B and C members and 20% class D and E members.
  • 20. 20 Drivers # domestic air traffic passengers In million Expected investment 2016-2019 (in R$ billion) Source: Sectorial Analysis Committee / BNDES: 2016-2019 , as of February, 2016. Source: ANAC up to 2016 and IATA-Air Passenger Forecast Global Report, as of February, 2016. The pipeline of investments tend to benefit the corporate segment. Expected annual traffic growth of 2.5% from 2017 to 2034 traffic. 70 82 89 90 96 96 89 2010 2011 2012 2013 2014 2015 2016 214.1  142.6  87.1  35.8  32.9  32.5  17.0  15.5  5.8  Energy Telecoms Highways Sanitation Railways Urban mobility Airports Ports Solid Residues
  • 21. 21 Source: ABLA, each company’s website on 01/23/2017 and Localiza´s 4Q16 Earnings Release Airport locations Off-airport locations Car Rental Locations in Brazil Off‐airport market is still fragmented.
  • 22. 22 Market Share Gross Revenue - Car Rental 2016 Source: ABLA and Companies’ Financial Statements. Localiza’s market share is higher than the 2nd  and 3rd players together. 33.7% 13.5% 7.6% 45.2% Localiza (includes franchising) Movida Unidas Others Market size: R$5.1 billion
  • 23. 23 1. Company overview 2. Main business divisions  Car Rental  Fleet Rental  Seminovos 3. Financials Appendix: Earnings release 4Q16 Agenda
  • 24. 24 Number of clients Fleet Rental overview Compact cars 33.8% Others 66.2% 2016 Fleet composition 34,960 cars 729 760 798 849 925 2012 2013 2014 2015 2016 End of period fleet 32,104 32,809 34,312 33,948 34,960 2012 2013 2014 2015 2016
  • 25. 25 Source: ABLA, Datamonitor and Localiza Rented fleet penetration Corporate fleet: 4,000,000* Rented fleet: 440,737 34,960 Brazilian Market World 11.0% 8.9% 13.3% 16.5% 24.5% 37.4% 46.9% 58.3% Drivers *Localiza estimates Low penetration of rented fleet in Brazil.
  • 26. Market Share Gross Revenue - Fleet Rental 2016 26 Source: ABLA, Companies’ Financial Statements. Fragmented market with low entry barriers. 12.2% 3.8% 6.5% 8.1% 69.3% Localiza Movida Unidas Others Locamerica Market size: R$5.4 billion
  • 27. 27 1. Company overview 2. Main business divisions  Car Rental  Fleet Rental  Seminovos 3. Financials Appendix: Earnings release 4Q16 Agenda
  • 28. 28 # of points of sale Car sales – operating data 55 66 73 74 75 77 84 2010 2011 2012 2013 2014 2015 2016 47,285 50,772 56,664 62,641 70,621 64,305 68,449 2010 2011 2012 2013 2014 2015 2016 # Number of cars sold (quantity) Efficiency gain on car sales.
  • 29. 29 Used car sales drivers: affordability and penetration Affordability to buy cars – Public Price of the most  basic Gol 300  350  380  415  465  510  545  622  678  724  788  880  84  71  69  61  55  51  49  43  43  43  41  41   ‐  10  20  30  40  50  60  70  80  90 ‐100  ‐  100  200  300  400  500  600  700  800  900 200520062007200820092010201120122013201420152016 Minimum wage (R$) Minimum wages to buy a new car 7.9 7.7 7.3 6.9 6.5 6.0 5.7 5.3 5.0 4.9 4.8 2005 2006 2007 2008 2009 2010 2011 2012 2013 2014 2015 # of inhabitants per car – Brazil 2005 ‐ 2015 Source: Sindipeças ‐ Current Fleet Report 2016,  as of April 2016. Developed countries maintain a ratio between 1 ‐ 2  cars per inhabitant. Source: BCB and Localiza Reference: to calculate the minimum wages to buy a new car we used the public price of the Vehicle type Gol.
  • 30. 8.4 8.9 9.0 9.4 10.1 9.9 10.0 3.3 3.5 3.6 3.6 3.3 2.5 2.0 2010 2011 2012 2013 2014 2015 2016 30 Brazilian car market: new x used car market and affordability New cars Used cars Source: FENABRAVE (light and commercial cars) In million of cars Total market of 12.0 million cars. 2.5x 2.5x2.6x 2.6x 3.1x 4.0x 5.0x
  • 31. 31 2015 Up to 2 years 419,085 2016 Brand new 1,986,3622016 Used cars 10,008,769 0.7% 3.4% 15.3% Car sales – operating data Source: Anfavea and Fenabrave Unidas, Locamerrica and Movida websites Examples • Retailers • Dealers • Rental operators • “Auto malls” Points of sale • 48,000 (Fenauto) • 5,592 (Anfavea) • +115 (Unidas, Movida, Locamerica) • 71 (Fenauto) Main players
  • 32. 32 1. Company overview 2. Main business divisions  Car Rental  Fleet Rental  Seminovos 3. Financials Appendix: Earnings release 4Q16 Agenda
  • 33. Message from the CEO – highlights  Financial discipline and strong balance sheet Cash position and debt profile to face the tough environment High credit ratings  The only company in the sector to create value for shareholders Focused on leadership, commercial and operational excellence and on active cost management  Long‐term global strategic alliance agreement with The Hertz Corporation Expand its market share in inbound/outbound reservations Use the Localiza‐Hertz brand through a co‐brand agreement Exchange knowhow, technology and expertise  Indisputable leadership in quality and service Net Promoter Score of over  80 in 2016  The most visited site in its category, with more than 7.6 million visitors in 2016 195,000 downloads of its mobile app Facebook fan page with more than 515,000 followers and the highest engagement in the category  Protagonist on innovation Localiza FAST na app that allows clients to open the car door without going through the counter  Brand 25ª most valuable brand in Brazil , among other brands across different sectors  Highest standards of ethics and corporate governance Honored as the best company in Transparency and Ethics at the Revista Exame 2016 ranking  Car rental division with the biggest and most diversified fleet that is renewed yearly More than 50 models of cars, from compact to premium brands such as Audi, BMW and Volvo 33Strong ambition towards growth and expanding its market leadership
  • 34. 3,812  3,780  3,871  4,111 4,242  4,308  4,846  5,266  1Q 2Q 3Q 4Q 76,755  94,156  33,948  34,960 13,992  14,015  124,695  143,131  2015 2016 Car Rental Fleet Rental Franchising 34 4Q16 and 2016 Operational Highlights 15,047  16,348  13,839  17,379  20,883  4Q15 1Q16 2Q16 3Q16 4Q16 Cars sold– consolidated Rental days evolution (thousand)– Car Rental Average revenues per operating car (R$ thousand) Fleet at end of the year 20.1  20.3  2015 2016 2015 2016 2015  2016 2015  2016 2015  2016
  • 35. Net Revenues - (R$ million) EBITDA - (R$ million) Net Income (R$ million) 402.4 409.3 2015 2016 4Q16 and 2016 Financial Highlights 35 EBIT (R$ milhões) 338.7  402.2  155.6  170.5  499.2  733.3  993.5  1,306.0  4Q15 4Q16 Car Rental Fleet Rental Seminovos 228.0  270.9  4Q15 4Q16 175.0  202.0  4Q15 4Q16
  • 36. 36 Number of Daily Rentals (thousand) 28.1% increase in car rental volume and 19.0% growth in net revenue in 4Q16 versus 4Q15 10,734  12,794  13,749  14,242  15,416  15,566  18,662  4,111  5,266  2010 2011 2012 2013 2014 2015 2016 4Q15 4Q16 Car Rental 802.2  980.7  1,093.7  1,163.5  1,284.4  1,258.0  1,428.0  334.5  398.0  2010 2011 2012 2013 2014 2015 2016 4Q15 4Q16 Net Revenues (R$ million)
  • 37. 69.1% 68.9% 70.8% 66.8% 69.9% 69.3% 73.4% 2010 2011 2012 2013 2014 2015 2016 37 Utilization Rate Evolution – Car Rental The increase in the utilization rate offset the drop in the average rate, keeping the average revenue per operating car stable Car Rental Average daily rental – In R$ 19.5 19.1 20.4 19.7  20.9  20.1  20.3  2010 2011 2012 2013 2014 2015 2016 78.07  79.68  82.36  84.85  87.71  84.56  79.67  2010 2011 2012 2013 2014 2015 2016 Average annual revenues per operating car (R$ thousand)
  • 38. Car Rental network evolution Number of car rental locations (Brazil and abroad) 13 new corporate locations were added to the network Localiza´s branches - Brazil Franchisees´ branches - Brazil Franchisees´ branches - abroad 234 247 272 286 304 320 333 181 202 202 193 172 174 15861 47 50 63 64 70 70476 496 524 542 540 564 561 2010 2011 2012 2013 2014 2015 2016 +13
  • 39. 39 Fleet Rental 361.1 455.0 535.7 575.9 571.9 608.5 651.8 155.6 170.5 2010 2011 2012 2013 2014 2015 2016 4Q15 4Q16 8,044 9,603 10,601 10,844 10,363 10,901 11,240 2,702 2,922 2010 2011 2012 2013 2014 2015 2016 4Q15 4Q16 Net Revenues (R$ million) Number of Daily Rentals (thousand) 8.1% growth in daily volume and 9.6% in net revenue in 4Q16 versus 4Q15
  • 40. Purchases (includes accessories) Used car sales net revenues Cars purchased Cars sold 40 Net investment Fleet Expansion* (quantity) Net Investment in Fleet (R$ million) 9,178 2,011 7,10318,649 * It does not consider theft / crashed cars. 9,183 465 (273) 65,934  59,950  58,655  69,744  79,804  64,032  87,833  21,660  27,921  47,285  50,772  56,644  62,641  70,621  64,305  68,449  15,047  20,883  2010 2011 2012 2013 2014 2015 2016 4Q15 4Q16 1,910 1,777 1,619 2,026 2,483 2,278 3,290 838 1,0781,322 1,468 1,520 1,747 2,018 2,045 2,343 499 733 2010 2011 2012 2013 2014 2015 2016 4Q15 4Q16 Strong growth in the fleet to support the Company's growth 309 99 588 279 233 6,613 339 19,384 7,038 R$947 345
  • 41. 41 Number of points of sale New stores will be added to the network to support the renewal of the fleet due to the strong growth of the Car Rental Division 55 66 73 74 75 77 84 2010 2011 2012 2013 2014 2015 2016 +7
  • 42. 42 Period-end fleet Quantity 61,445 64,688 65,086 70,717 77,573 76,755 94,156 26,615 31,629 32,104 32,809 34,312 33,948 34,960 10,652 12,958 14,545 14,233 13,339 13,992 14,015 98,712 109,275 111,735 117,759 125,224 124,695 143,131 2010 2011 2012 2013 2014 2015 2016 Car Rental Fleet Rental Franchising The car rental fleet increased 17,401 cars to meet strong demand, maintaining the utilization rate at a record level of 73.4% +17,401 +1,012
  • 43. 1,175.3 1,450.0 1,646.7 1,758.9 1,874.0 1,883.1 2,096.8 494.3 572.7 1,321.9 1,468.1 1,520.0 1,747.3 2,018.2 2,044.9 2,342.5 499.2 733.3 2,497.2 2,918.1 3,166.7 3,506.2 3,892.2 3,928.0 4,439.3 993.5 1,306.0 2010 2011 2012 2013 2014 2015 2016 4Q15 4Q16 43 Consolidated net revenues R$ million Rental Used car sales 31.5% increase in consolidated revenue in 4Q16 versus 4Q15 The increase of 46.9% in 4Q16 in the revenue of the Seminovos is due to 5,836 cars sold more than in 4Q15, and to the increase of 5.9% in the car prices
  • 44. 44 Consolidated EBITDA R$ million (*)From 2012 onwards, accessories and freight of new cars have been accounted directly in the cost line, impacting EBITDA but reducing depreciation costs. (**) It considers the new appropriation criteria of the overhead, which is also appropriated to Seminovos. Divisions 2010* 2011* 2012 2013 2014** 2015 2016 4Q15 4Q16 Car Rental 45.3% 46.9% 40.9% 36.8% 38.7% 31.8% 32.3% 30.2% 31.5% Fleet Rental 68.0% 68.6% 66.4% 65.5% 60.0% 62.2% 64.5% 64.0% 63.8% Rental Consolidated 52.3% 53.8% 49.3% 46.5% 45.3% 41.7% 42.3% 40.8% 40.8% Used Car Sales 2.6% 2.8% 4.2% 5.7% 6.0% 7.3% 5.5% 5.2% 5.0% Increase of R$42.9 million in EBITDA in 4Q16 649.5 821.3 875.6 916.5 969.8 934.8 1,015.6 228.0 270.9 2010 2011 2012 2013 2014 2015 2016 4Q15 4Q16 + R$42.9
  • 45. 45 Average depreciation per car (in R$) Car Rental 1,536.0 1,683.9 1,895.8 1,452.4 1,270.0 622.1 1,251.2 2010 2011 2012 2013 2014 2015 2016 2,076.6 IPI Effect 3,972.4 Average Price of cars purchased In R$ Thousand 29.41  33.87  36.57 4.46  2.70  Price 2014 Increase Price 2015 Increase Price 2016 2015 2016 The increase in the average depreciation per car of the RAC is a reflection of the slowdown of the increase of the new cars price that reflects in the seminovos cars
  • 46. 46 Average depreciation per car (in R$) The drop in depreciation is due to a longer cycle The depreciation of the cars in this division benefits from the price increase of new cars that occurs over the life of the car 3,509.7 4,133.0 4,311.3 4,592.3 4,202.1 3,935.2 3,714.0 2010 2011 2012 2013 2014 2015 2016 1,096.9 IPI Effect 5,408.2 Fleet Rental
  • 47. 47 Consolidated EBIT R$ million Divisions 2010 2011 2012 2013 2014 2015 2016 4Q15 4Q16 Car Rental 38.5% 38.8% 23.7% 32.8% 36.2% 34.3% 30.2% 28.7% 28.4% Fleet Rental 46.2% 45.6% 36.9% 45.1% 44.3% 48.9% 51.2% 49.9% 52.4% Consolidated 41.0% 41.1% 28.3% 37.1% 38.8% 39.1% 36.8% 35.4% 35.3% Even with increased car depreciation of the Car Rental Division, EBIT Margin remained stable in 4Q16 482.1 595.7 465.8 652.1 726.7 735.5 771.1 175.0 202.0 2010 2011 2012 2013 2014 2015 2016 4Q15 4Q16 144.5 IPI Effect 610.3 + R$27.0
  • 48. 48 Consolidated net income R$ million Increase of 1.7% in 2016 profit even with the increase of interest and depreciation 250.5 291.6 240.9 384.3 410.6 402.4 409.3 105.9 104.4 2010 2011 2012 2013 2014 2015 2016 4Q15 4Q16 336.3 95.4 IPI Effect Reconciliation EBITDA x Net income 2010 2011 2012 2013 2014 2015 2016 Var. R$ Var. % 4Q15 4Q16 Var. R$ Var. % Consolidated EBITDA 649.5 821.3 875.6 916.5 969.8 934.8 1,015.6 80.8 8.6% 228.0 270.9 42.9 18.8% Cars depreciation (146.3) (201.5) (232.4) (229.0) (207.4) (163.6) (206.3) (42.7) 26.1% (44.0) (59.5) (15.5) 35.2% Cars additional depreciation – IPI effect - - (144.5) - - - - - - - - - - Other property depreciation and amortization (21.1) (24.1) (32.9) (35.4) (35.7) (35.7) (38.2) (2.5) 7.0% (9.0) (9.4) (0.4) 4.4% EBIT 482.1 595.7 465.8 652.1 726.7 735.5 771.1 35.6 4.8% 175.0 202.0 27.0 15.4% Financial expenses, net (130.1) (179.0) (138.7) (110.6) (151.1) (202.7) (243.5) (40.8) 20.1% (43.5) (72.7) (29.2) 67.1% Income tax and social contribution (101.5) (125.1) (135.3) (157.2) (165.0) (130.4) (118.3) 12.1 -9.3% (25.6) (24.9) 0.7 -2.7% Income tax and social contribution – IPI effect - - 49.1 - - - - - - - - - - Net income of the period 250.5 291.6 240.9 384.3 410.6 402.4 409.3 6.9 1.7% 105.9 104.4 (1.5) -1.4%
  • 49. 49 Free cash flow - FCFFree cash flow Free cash flow - R$ million 2010 2011 2012 2013 2014 2015 2016 w Operations EBITDA 649.5 821.3 875.6 916.5 969.8 934.8 1,015.6 Used car sale revenue, net from taxes (1,321.9) (1,468.1) (1,520.0) (1,747.3) (2,018.2) (2,044.9) (2,342.5) Depreciated cost of cars sold 1,203.2 1,328.6 1,360.2 1,543.8 1,777.0 1,769.1 2,102.5 (-) Income tax and social contribution (57.8) (83.0) (100.9) (108.5) (113.1) (110.7) (93.3) Change in working capital 54.5 (83.9) 37.1 2.9 (27.1) (30.0) 113.2 Cash generated by rental operations 527.5 514.9 652.0 607.4 588.4 518.3 795.5 Capex- Renewals Used car sale revenue, net from taxes 1,321.9 1,468.1 1,520.0 1,747.3 2,018.2 2,036.3 2,342.5 Fleet renewal investment (1,370.1) (1,504.5) (1,563.3) (1,819.7) (2,197.7) (2,278.4) (2,563.6) Net investment for fleet renewal (48.2) (36.4) (43.3) (72.4) (179.5) (242.1) (221.1) Fleet renewal – quantity 47,285 50,772 56,644 62,641 70,621 64,032 68,449 Investment, other property and intangibles (50.6) (59.9) (77.8) (47.5) (46.3) (29.7) (42.2) Free cash flow from operations, net of fleet renewal capex 428.7 418.6 530.9 487.5 362.6 246.5 532.2 Capex-Growth Fleet growth (investment) (540.3) (272.0) (55.5) (209.4) (286.8) 8.6 (726.0) Change in accounts payable to car suppliers 111.3 32.7 (116.9) 89.7 334.4 (121.2) 190.7 Net investment for fleet growth (429.0) (239.3) (172.4) (119.7) 47.6 (112.6) (535.3) Fleet increase / (reduction) – quantity 18,649 9,178 2,011 7,103 9,183 (273) 19,384 Free cash flow after growth, and before interest and new HQ (0.3) 179.3 358.5 367.8 410.2 133.9 (3.1) New headquarters construction (0.5) (3.1) (2.4) (6.5) (148.3) (30.7) (84.4) Free cash flow before interest (0.8) 176.2 356.1 361.3 261.9 103.2 (87.5)
  • 50. 50 Changes in net debt R$ million R$288.7 million of cash generation after interest was invested to increase the fleet 532.2  (243.5) (726.0) 190.7  (84.4) (139.4) (25.0) (2,084.0) Net Debt 12/31/2016 (1,588.6) Net Debt 12/31/2015 Free cash flow after fleet renewal and before headquarters Interest Fleet Increase of 19,384 cars Increase in accounts payable to cars suppliers New headquarters construction Dividends +288.7 (535.3) (248.8) Treasury Shares
  • 51. 51 Debt maturity profile (principal) R$ million Strong cash position and comfortable debt profile to take advantage of growth opportunities As of December 31, 2016 ‐ 558.4  335.7  620.8  770.0  672.5  750.0  2016 2017 2018 2019 2020 2021 2022 Cash 1,692.3 2016 1,514.9
  • 52. 52 Debt - ratios Net debt vs. Fleet value BALANCE AT THE END OF PERIOD 2010(*) 2011 2012 2013 2014 2015 2016 Net debt / Fleet value 52% 51% 48% 48% 40% 44% 45% Net debt / EBITDA 2.0x 1.7x 1.4x 1.5x 1.4x 1.7x 2.1x Net debt / Equity 1.4x 1.2x 0.9x 1.0x 0.8x 0.8x 0.9x EBITDA / Net financial expenses 5.0x 4.6x 6.3x 8.3x 6.4x 4.6x 4.2x (*) 2010 ratios based on USGAAP financial statements Net debt Fleet value Low leverage supports growth targets 1,281.1 1,363.4 1,231.2 1,332.8 1,322.3 1,588.6 2,084.0 2,446.7 2,681.7 2,547.6 2,797.9 3,296.3 3,642.7 4,623.6 2010 2011 2012 2013 2014 2015 2016
  • 53. 53 ROIC versus cost of debt after taxes ROIC Cost of debt after taxes 7.3% 8.6% 6.3% 6.0% 8.0% 9.5% 10.2% 16.9% 17.1% 16.1% 16.5% 17.5% 17.0% 15.4% 2010 2011 2012 2013 2014 2015 2016 9.6p.p. 8.5p.p. 9.5p.p. 9.8p.p. 10.5p.p. 7.5p.p. 5.2p.p. 2010 to 2014 ROIC considered income tax rate of 30% and effective income tax rate from 2015 on Spread of 5.2p.p. in line with the Company's short-term strategy and expectation of a sharp drop in interest in 2017
  • 54. 54 Disclaimer Website: www.localiza.com/ir E-mail: ri@localiza.com Phone: 55 31 3247-7024 Roberto Mendes CFO and IR Nora Lanari Head of IR Eugênio Mattar CEO The material presented is a presentation of general background information about LOCALIZA as of the date of the presentation. It is information in summary form and does not purport to be complete. It is not intended to be relied upon as advice to potential investors. No representation or warranty, express or implied, is made concerning, and no reliance should be placed on, the accuracy, fairness, or completeness of the information presented herein. This presentation contains statements that are forward-looking within the meaning of Section 27A of the Securities Act of 1933 and Section 21E of the Securities Exchange Act of 1934. Such forward-looking statements are only projections and are not guarantees of future performance. Investors are cautioned that any such forward-looking statements are and will be, as the case may be, subject to many risks, uncertainties and factors relating to the operations and business environments of LOCALIZA and its subsidiaries that may cause the actual results of the companies to be materially different from any future results expressed or implied in such forward-looking statements. Although LOCALIZA believes that the expectations and assumptions reflected in the forward-looking statements are reasonable based on information currently available to LOCALIZA’s management, LOCALIZA cannot guarantee future results or events. LOCALIZA expressly disclaims a duty to update any of the forward-looking statement. Securities may not be offered or sold in the United States unless they are registered or exempt from registration under the Securities Act of 1933. This presentation does not constitute an offer, invitation or solicitation of an offer to subscribe to or purchase any securities. Neither this presentation nor anything contained herein shall form the basis of any contract or commitment whatsoever. Maria Carolina Costa IR Manager Mariana Campolina IR Manager