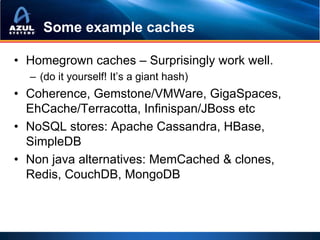
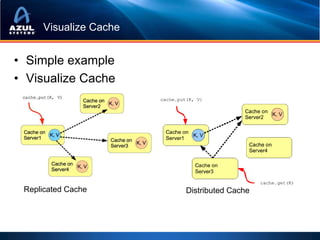
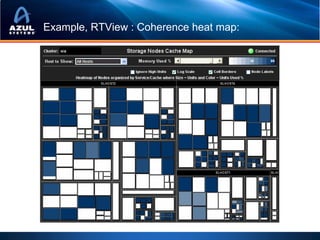
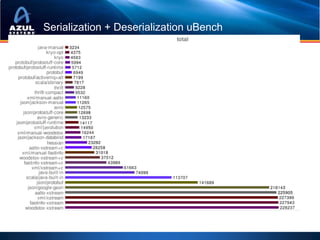
This document discusses strategies for optimizing cache performance in Java applications. It begins by providing examples of different caching technologies like Coherence, Gemfire, Ehcache, Cassandra and Memcached. It then discusses key metrics for measuring cache performance like insert, read and update latencies. The document outlines concepts like data locality, hit ratios and expiration policies that impact cache performance. It also demonstrates visualizing cache usage and heatmaps. Finally, it discusses techniques for optimizing the Java virtual machine for big data workloads, including reducing object overhead, using non-blocking collections to avoid locks, tuning garbage collection and avoiding memory leaks.

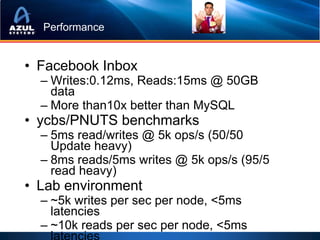
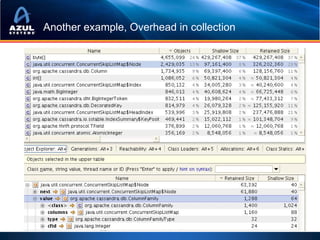
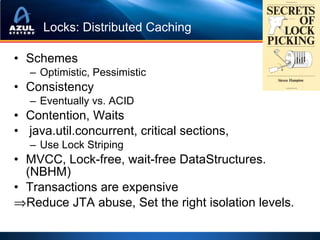
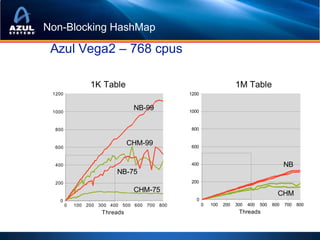
![JVM in BigData Land!
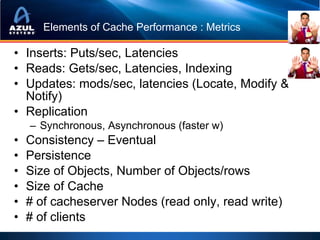
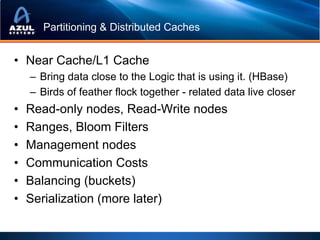
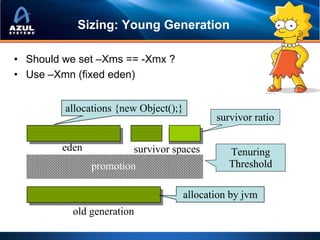
A few limits for scale
• Object overhead
– average enterprise collection has 3 elements!
– Use byte[ ], primitives where possible!
• Locks : synchronized
– Can’t use all my multi-cores!
– java.util.collections also hold locks
– Use non-blocking collections!
• (de) Serialization is expensive
– Hampers object portability, cluster-scaleability
– Use avro, thrift!
• Garbage Collection
– Can’t throw memory at the problem!?
– Mitigate, Monitor, Measure footprint](https://image.slidesharecdn.com/localhomesrisdownloadscmecacheiskinghowtostopworryingandstartcachinginjava-101209145529-phpapp01/85/Cache-is-King-Or-How-To-Stop-Worrying-And-Start-Caching-in-Java-at-Chicago-Mercantile-Group-2010-24-320.jpg)
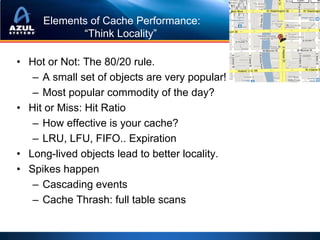
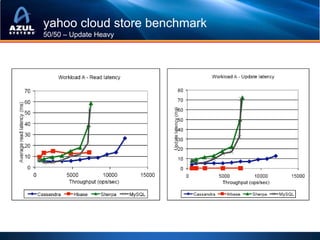
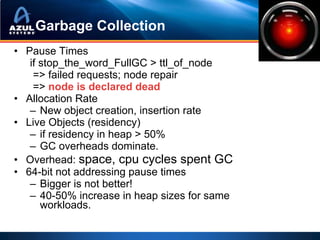
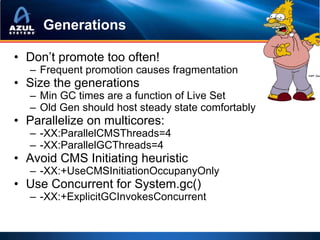
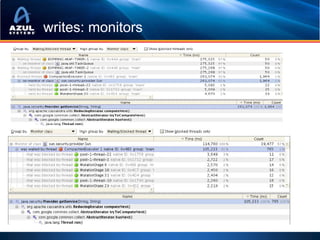
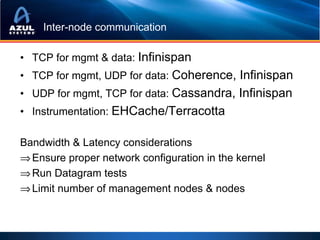
![Java Limits: Objects are not cheap!
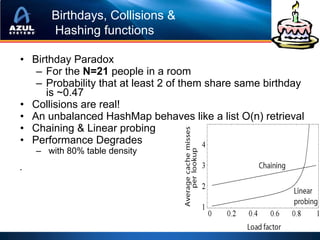
• How many bytes for a 8 char String ?
• (assume 32-bit)
String
A. 64bytes
JVM Overhead book keeping fields Pointer 31% overhead
char[] 16 bytes 12 bytes 4 bytes
Size of String
data
JVM Overhead
16 bytes
Varies with JVM
16 bytes
• How many objects in a Tomcat idle
instance?](https://image.slidesharecdn.com/localhomesrisdownloadscmecacheiskinghowtostopworryingandstartcachinginjava-101209145529-phpapp01/85/Cache-is-King-Or-How-To-Stop-Worrying-And-Start-Caching-in-Java-at-Chicago-Mercantile-Group-2010-26-320.jpg)
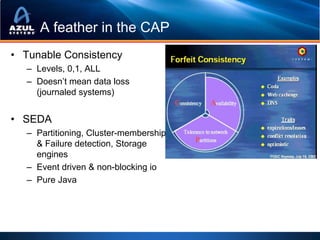
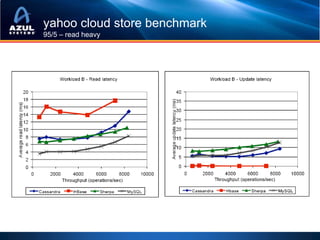
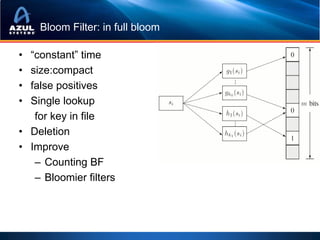
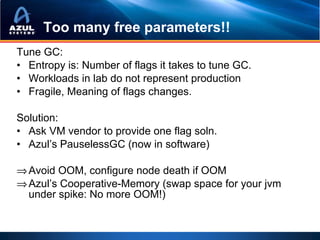
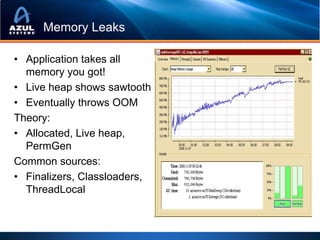
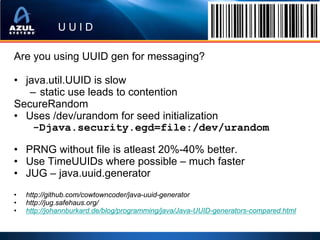
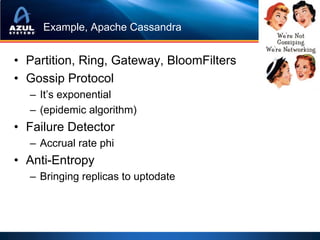
![Picking the right collection: Mozart or Bach?
TreeMap
• 100 elements of Treemap Fixed Overhead: 48 bytes
TreeMap$Entry
of <Double, Double>
Per-entry Overhead: 40 bytes
– 82% overhead, 88 bytes constant cost
per element
– Enables updates while maintaining
order data
• double[], double[] – Double double
– 2% overhead, amortized
– [con: load-then-use] JVM Overhead data
16 bytes 8 bytes
• Sparse collections, Empty
collections,
• Wrong collections for the *From one 32-bit JVM.
Varies with JVM Architecture
problem](https://image.slidesharecdn.com/localhomesrisdownloadscmecacheiskinghowtostopworryingandstartcachinginjava-101209145529-phpapp01/85/Cache-is-King-Or-How-To-Stop-Worrying-And-Start-Caching-in-Java-at-Chicago-Mercantile-Group-2010-27-320.jpg)
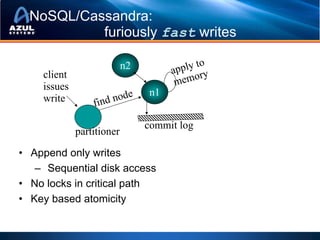
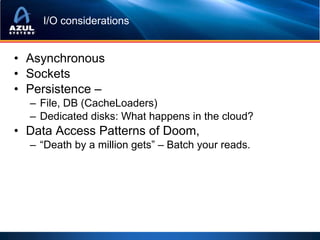
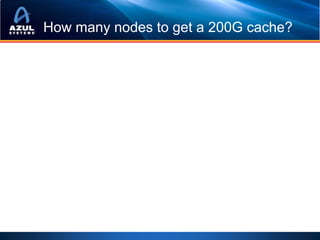
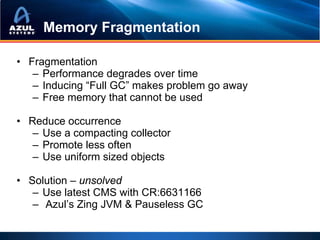
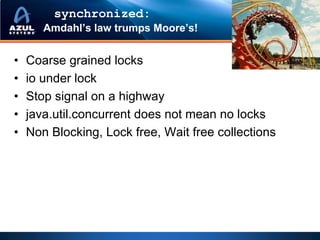
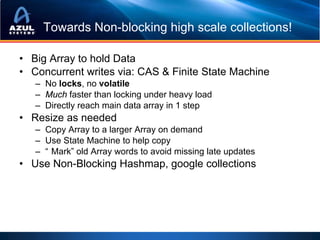
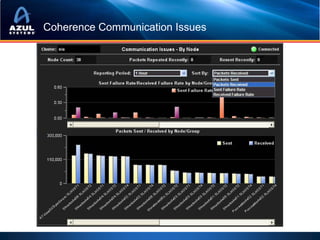
![JEE is not cheap either! Million Objects
allocated live
JBoss 5.1 20 4
Apache Tomcat 6.0 0.25 0.1
JBoss 5.1 Apache Tomcat 6.0
Allocated Allocated
Class name Size (B) Count Avg (B) Class name Size (B) Count Avg (B)
Total 1,410,764,512 19,830,135 71.1 Total 21,580,592 228,805 94.3
char[] 423,372,528 4,770,424 88.7 char[] 4,215,784 48,574 86.8
byte[] 347,332,152 1,971,692 176.2 byte[] 3,683,984 5,024 733.3
int[] 85,509,280 1,380,642 61.9 Built‐in VM methodKlass 2,493,064 16,355 152.4
java.lang.String 73,623,024 3,067,626 24 Built‐in VM constMethodKlass 1,955,696 16,355 119.6
java.lang.Object[] 64,788,840 565,693 114.5 Built‐in VM constantPoolKlass 1,437,240 1,284 1,119.30
java.util.regex.Matcher 51,448,320 643,104 80 Built‐in VM instanceKlass 1,078,664 1,284 840.1
java.lang.reflect.Method 43,374,528 301,212 144
java.lang.Class[] 922,808 45,354 20.3
java.util.HashMap$Entry[] 27,876,848 140,898 197.9
Built‐in VM constantPoolCacheK 903,360 1,132 798
java.util.TreeMap$Entry 22,116,136 394,931 56 Live
java.lang.String 753,936 31,414 24
java.util.HashMap$Entry 19,806,440 495,161 40
java.lang.Object[] 702,264 8,118 86.5
java.nio.HeapByteBuffer 17,582,928 366,311 48
java.lang.reflect.Method 310,752 2,158 144
java.nio.HeapCharBuffer 17,575,296 366,152 48
java.lang.StringBuilder 15,322,128 638,422 24 short[] 261,112 3,507 74.5
java.util.TreeMap$EntryIterator 15,056,784 313,683 48 java.lang.Class 255,904 1,454 176
java.util.ArrayList 11,577,480 289,437 40 int[][] 184,680 2,032 90.9
java.util.HashMap 7,829,056 122,329 64 java.lang.String[] 173,176 1,746 99.2
java.util.TreeMap 7,754,688 107,704 72 java.util.zip.ZipEntry 172,080 2,390 72](https://image.slidesharecdn.com/localhomesrisdownloadscmecacheiskinghowtostopworryingandstartcachinginjava-101209145529-phpapp01/85/Cache-is-King-Or-How-To-Stop-Worrying-And-Start-Caching-in-Java-at-Chicago-Mercantile-Group-2010-28-320.jpg)
![Marshal Arts:
Serialization/Deserialization
• java.io.Serializable is S.L..O.…W
• Use “transient”
• jserial, avro, etc
• + Google Protocol Buffers,
• PortableObjectFormat (Coherence)
• + JBossMarshalling
• + Externalizable + byte[]
• + Roll your own](https://image.slidesharecdn.com/localhomesrisdownloadscmecacheiskinghowtostopworryingandstartcachinginjava-101209145529-phpapp01/85/Cache-is-King-Or-How-To-Stop-Worrying-And-Start-Caching-in-Java-at-Chicago-Mercantile-Group-2010-45-320.jpg)


![JavaOne2016 - Microservices: Terabytes in Microseconds [CON4516]](https://cdn.slidesharecdn.com/ss_thumbnails/javaone2016microservicesfinal-160922163749-thumbnail.jpg?width=640&height=640&fit=bounds)


![JavaOne2016 - Microservices: Terabytes in Microseconds [CON4516]](https://cdn.slidesharecdn.com/ss_thumbnails/javaone2016microservicesfinal-160922165618-thumbnail.jpg?width=640&height=640&fit=bounds)


![Getting Started with Apache Spark: Big Data Made Simple [Free Meetup]](https://cdn.slidesharecdn.com/ss_thumbnails/apachesparkgettingstarted-260203175547-8361bcc3-thumbnail.jpg?width=640&height=640&fit=bounds)


