This document provides an analysis of developing liquefied natural gas (LNG) infrastructure at the Port of Piraeus in Greece to establish it as an LNG bunkering hub for the Mediterranean and Adriatic regions. It discusses tightening environmental regulations for shipping emissions and outlines the benefits of LNG as a marine fuel. Ship traffic data at the Port of Piraeus is analyzed to estimate future LNG demand. The potential for a network of LNG supply and bunkering facilities at Piraeus and satellite ports is examined. Developing this infrastructure could help meet emission limits while providing economic benefits to ship owners.

![▪ Class B (≥ 1.000 berths)
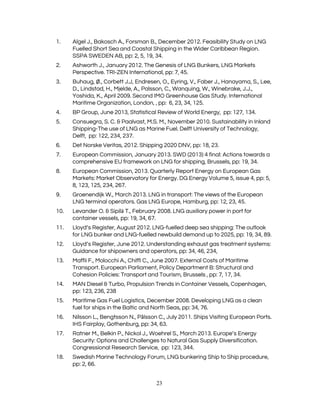
The number of ships of Class B is a slightly larger than the number of ships of Class A.
However, larger cruise ships have made more arrivals than smaller cruise ships: 478
Class B arrivals, as compared to 292 Class A arrivals.
➢ Costal Vessels
Ships of this class are coastal vessels and exhibited the largest number of arrivals at
the port of Piraeus, with large seasonal fluctuations. Indeed, these ships are
considered ideal for LNG use as they spend their entire time cruising emission control
areas. We must emphasize that ferries to the islands of the Saronic Gulf will not be
studied in the context of this work, since their fleet is much older.
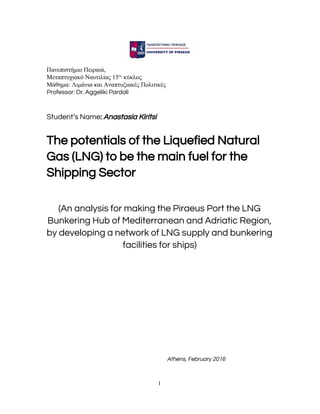
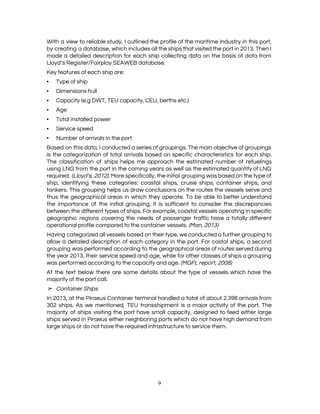
❖ Vessels Serving Cyclades
In this paragraph we will deal with the description of the geographical area of the
Cyclades. This market segment was based on the assumption mentioned above about
the service speed. In Table 1 we can observe the main features of each category, i.e.
the number of arrivals, the total installed capacity, the service speed and age.
Table 1. Characteristics of ships arriving from Cycladic islands.
“Small Ro-Ro/Pax” “Large Ro-Ro/Pax”
Number of Arrivals 1132 756
Average Total installed power [kW] 12.735,6 29.090,4
Average Service speed [knots] 22,2 36,0
Average age 20,4 10,2
The "Small Ro-Ro/Pax" made 1132 arrivals, 74% of which by ships whose age was
below 15 years. In the third quarter, there were 327 arrivals by "Small Ro-Ro/Pax" by
527 "Large Ro-Ro/Pax".
❖ Vessels Serving Crete
In this paragraph we will deal with the arrivals of passenger vessels from ports of
Crete. In Table 2 we can observe the basic characteristics of each category.
Table 2. Characteristics of ships having arrived from Crete
“Small Ro-Ro/Pax” “Large Ro-Ro/Pax”
Number of Arrivals 664 708
Average Total installed power [kW] 19.946,1 58.200,0
Average Service speed [knots] 21,2 29,4
Average Age 29,0 12,25
Regarding the "Small Ro-Ro/Pax" segment, all arrivals were conducted by ships whose
age was more than 15 years, in contrast to the "Big Ro-Ro/Pax" whose age was below
15 years.
In the third quarter there were 236 arrivals from "Small Ro-Ro/Pax" and 237 "Large
Ro-Ro/Pax".
13](https://image.slidesharecdn.com/8855f60f-f099-4541-8b12-b1847adb7f8d-160411162819/85/LNGinShippingIndustry-docx-13-320.jpg)
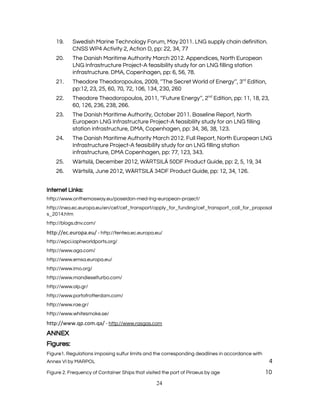
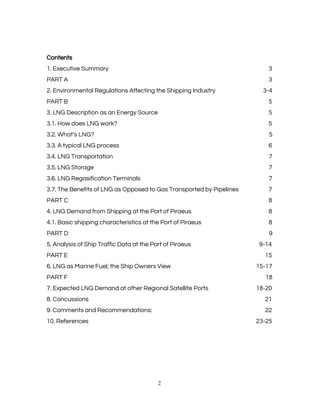
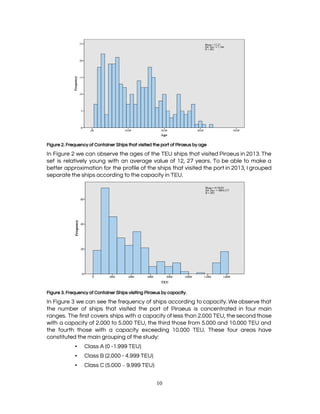
![❖ Vessels Serving Northern Aegean
In this paragraph we will deal with the analysis of arrivals from the ports of Northern
Aegean. In Table 3 we can observe the basic characteristics of each category.
Table 3. Characteristics of ships arriving from the North Aegean islands.
“Small Ro-Ro/Pax” “Large Ro-Ro/Pax”
Number of Arrivals 116 408
Average Total installed power [kW] 14.594,5 31.209,5
Average Service speed [knots] 18,75 26,08
Average age 39,00 13,50
All "Small Ro-Ro/Pax" arrivals were by ships whose age was over 25 years, in contrast
to the "Big Ro-Ro/Pax", whose age was below 10 years. In the third quarter there were
46 arrivals from "Small Ro-Ro/Pax" and 179 from "Large Ro-Ro/Pax".
❖ Vessels Serving the Dodecanese
In this paragraph we will deal with the description of arrivals from the islands of the
Dodecanese.
In Table 4 we can observe the basic characteristics of each category.
Table 4. Ship statistics of arrivals from Dodecanese
“Small Ro-Ro/Pax” “Large Ro-Ro/Pax”
Number of Arrivals 238 274
Average Total installed power [kW] 10.815,5 44.480,00
Average Service speed [knots] 21,0 20,0
Average age 30,0 13,0
All "Small Ro-Ro/Pax" arrivals were by ships whose age was over 25 years, in contrast
to the "Big Ro-Ro/Pax", whose age was below 10 years.
In the third quarter were 64 arrivals from "Small Ro-Ro/Pax" and 88 "Large Ro-Ro/Pax”.
PART
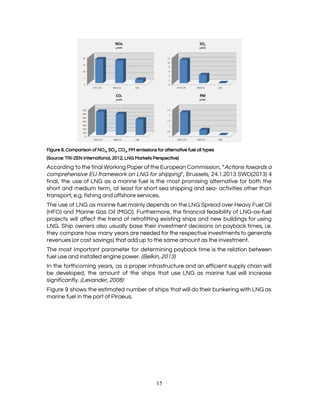
6. LNG as Marine Fuel; Ship Owners View
The engines using LNG as fuel have proven to be a reliable solution as well as the LNG
is an environmentally friendly fuel with low sulfur content. The exhaust emissions, such
as SOX and PM using LNG are negligible. The NOX emissions can be reduced by about
80-90% for four-stroke Otto and 10-20% for two-stroke engines. Still LNG contains less
carbon than the other fuels, reducing CO2 emissions by approximately 20%. In Figure 8
we can see the significant environmental advantages of the LNG fuel as compared to
other alternatives. Finally, and this is usually forgotten, due to the nature of the
combustion and the more balanced movements of the mechanical parts, engines are
significantly more quiet when using LNG. (Palsson, 2011)
14](https://image.slidesharecdn.com/8855f60f-f099-4541-8b12-b1847adb7f8d-160411162819/85/LNGinShippingIndustry-docx-14-320.jpg)
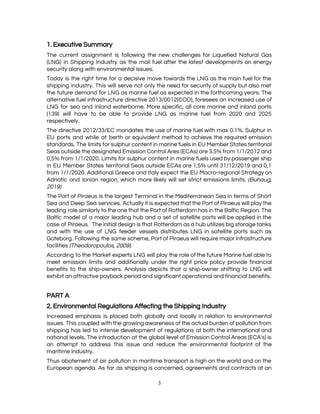
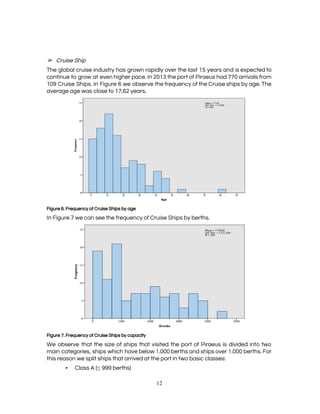
![PART
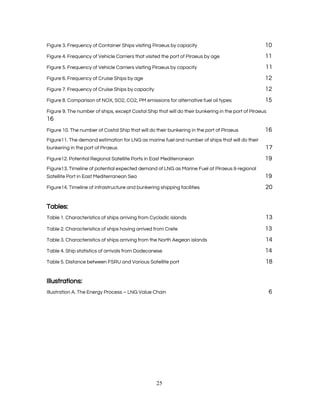
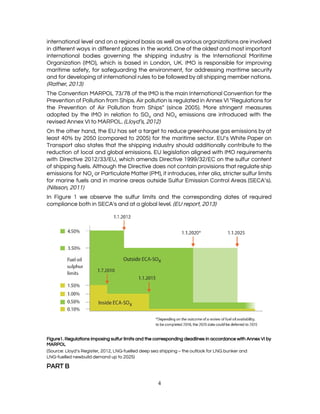
7. Expected LNG Demand at other Regional Satellite Ports
The EU in the White Paper on Transport has set a target to reduce greenhouse gas
emissions at least 40% by 2050 (compared to 2005) in the maritime sector. It also
states that the shipping industry should also contribute to the reduction of local and
global emissions. EU legislation aligned with IMO requirements with Directive
2012/33/EU, which amends Directive 1999/32/EC on the sulfur content of shipping
fuels. (DNV report, 2012)
The European Commission has planned a strategy to shift to cleaner fuels and
proposes installing LNG fueling stations at a total of 139 marine and inland ports
(generally around 10% of all ports in Europe) for the TEN-T (Trans European Core
Network) from 2020 and 2025 respectively. These stations are not based on large gas
terminals, but are either fixed or mobile refueling stations covering all major ports of
the EU. (EU Com. Report, 2013)
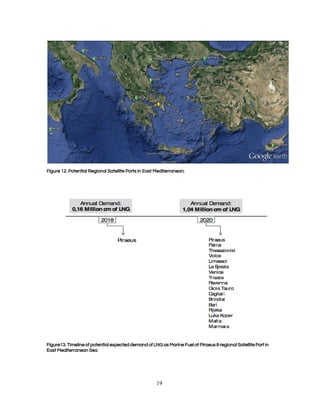
The strategic geographical position of FSRU offer a great opportunity to supply with
LNG the Ports considered in the study. A sample of these ports is shown in Table 5.
Table 5. Distance between FSRU and Various Satellite port.
Distance between ports
Port of Patrai 305 nm
Port of Thessaloniki 251 nm
Port of Volos 186 nm
Port of Brindisi [Italy] 540 nm
Port of Bari[Italy] 598 nm
Port of Limassol [Cyprus] 532 nm
Port of Malta [Malta] 534 nm
Port of Marmara [Turkey] 290 nm
18](https://image.slidesharecdn.com/8855f60f-f099-4541-8b12-b1847adb7f8d-160411162819/85/LNGinShippingIndustry-docx-18-320.jpg)