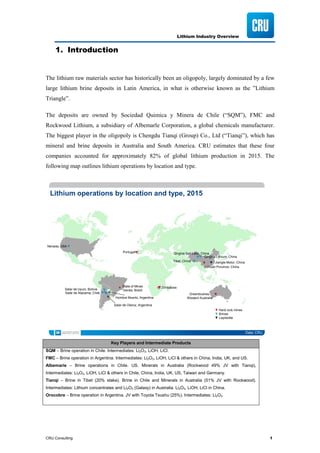
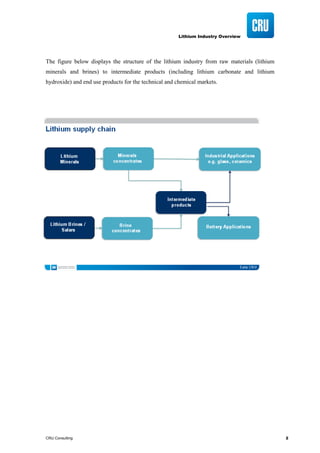
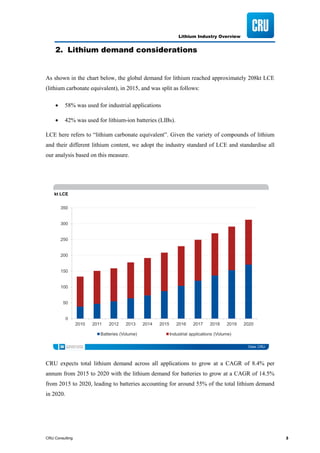
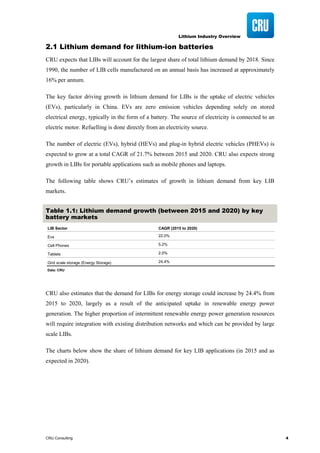
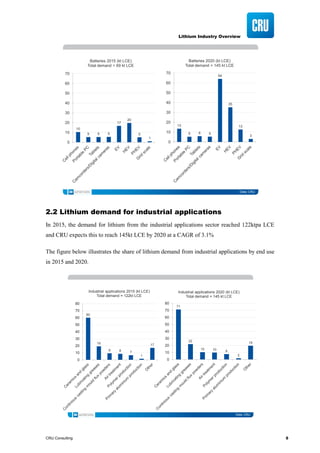
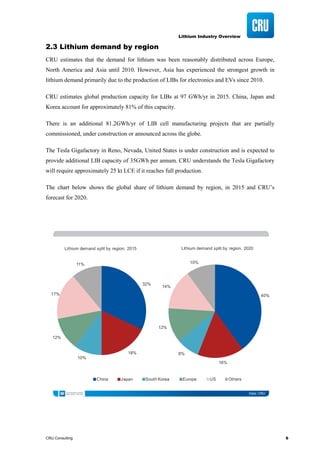
If you’re interested in learning about the environment surrounding Lithium at the moment, take a look at this report written by industry experts and find out why lithium has become so exciting!
The presentation highlights the following :
a) Current status of Renewable Energy in India
b) The issue of duck curve due to high volume of solar energy
c) Demand increase due to Electric Vehicle (EV) will lead to more demand for Renewable Energy
d) Global & Indian Market Scenario for Electric Vehicle (EV)
e) Recommendation of Niti Aayog for development of Electric Vehicle (EV) market in India
Market Research Report : Electric vehicle market in india 2014 - SampleNetscribes, Inc.
For the complete report, get in touch with us at: info@netscribes.com
Abstract :
Electric vehicle market is expected to witness phenomenal growth in the coming years. Increasing fuel costs, rise in pollution level and increasing government support will boost the adoption of electric vehicles in India.
The report highlights the analysis of the drivers and explains the factors for growth of the industry. Government Initiatives, Rise in fuel costs, Low operating and maintenance cost and foreign dependence for crude oil are the key drivers for the Electric Vehicle Market in India. Recently, MNRE had implemented the Alternate Fuels for Surface Transportation Program to subsidize the purchase of electric vehicles. Domestic electric vehicle industry has witnessed significant short term growth owing to the various initiatives undertaken by the Indian government. Fuel costs play a vital role in influencing the consumer’s automobile purchase decision. Indian automobile industry has been witnessing sluggish demand and one of the primary reasons for this is increase in fuel prices. Use of electric vehicles is likely to reduce the increasing dependence on foreign crude oil as electricity can be generated from various natural resources in India. As electric vehicles are considered to be zero-polluting, increasing usage of such vehicles can aid in bringing down the country’s level of pollution.
Table of Contents :
Slide 1: Executive Summary
Macroeconomic Indicators
Slide 2: Economic Indicators: GDP at cost factor cost: Quarterly (2011-12- 2014-15) & Inflation rate Monthly (Jul-Aug 2013 – Nov-Dec 2013)
Slide 3: Gross fiscal deficit: Monthly (Feb-2013-Jul 2013) & Exchange Rate: Monthly (Apr 2014- Sep 2014)
Slide 4: Lending rate: Annual (2011-12-2013-14); Trade Balance: Annual (2010-11-2013-14) & FDI: Annual (2009-10-2012-13)
Introduction
Slide 5: Electric Vehicle – Introduction and Types of Electric Vehicles – Technology-wise
Slide 6: Electric Vehicle Market – Transition
Slide 7: Shift towards Electric Mobility
Market Overview
Electric Vehicle
Slide 8: Electric Vehicle Market – Overview, Market Size and Growth (2013-2018e) (Value wise), Market Share – Segment-wise (2012-13)
Slide 9: Vehicle Lifecycle Cost Comparison across Supply Chain – Electric Vehicle vs. ICE Vehicles
Slide 10: Cost Comparison across Manufacturing Process – Electric Vehicle vs. ICE Vehicles
Major Segments
Slide 11: Electric Four Wheelers Market – Overview, Market Size and Growth (2013-2018e) (Value wise), Consumer Preference – Electric Vehicle Technology-wise
Slide 12-13: Electric Two Wheelers Market – Overview, Market Size and Growth (2013-2018e) (Value wise), Consumer Preference, Low Speed and High Speed Electric Two Wheeler Specifications
Slide 13: Electric Three Wheelers – Overview, Market Size and Growth (2013-2018e) (Value wise)
Market Analysis
Slide 14: Matrix of Key Challenges to Electric Vehicle Adoption – Segme
Market Research Report : Electric vehicle market in india 2013 Netscribes, Inc.
For the complete report, get in touch with us at : info@netscribes.com
Electric vehicle market is expected to witness phenomenal growth in the coming years. Increasing fuel costs, rise in pollution level and increasing government support will boost the adoption of electric vehicles in India.
This document outlines India's roadmap for electric vehicle implementation. It discusses the necessity of EVs in India to reduce emissions, lessen dependence on oil, and promote sustainable development. Global EV trends in countries like Norway, the US, China, and France are examined in terms of drivers, policies, incentives, and public investments supporting EV adoption. India's progress toward EVs since 2012 is reviewed. Key aspects of India's EV implementation roadmap are identified, including developing indigenous battery technology, securing lithium imports, expanding charging infrastructure, making EVs affordable, addressing consumer concerns about range, and establishing social acceptance. The roadmap highlights challenges but presents a path for India to realize its EV goals.
March 2014 Edition of BEACON, A Monthly Newsletter by SIMCON.
Inside this issue:
INDUSTRY ANALYSIS : Power Sector
COMPANY ANALYSIS : Tata Power
Concept of the Month
Quiz
Did You Know?
2010 deep research report on china new energy vehiclesqyresearch
The document is a 216-page professional report on new energy vehicles in China published in 2010. It provides:
1) A comprehensive overview of the development status and classifications of various new energy vehicles in China and globally, such as hybrid, battery electric, fuel cell, hydrogen, and gas vehicles.
2) Detailed profiles and analyses of the major Chinese and international manufacturers in the new energy vehicle industry, including their product lineups, production capacities, and development strategies.
3) Insights into key supporting technologies and industries such as batteries, as well as forecasts of market trends, investment opportunities and risks in China's burgeoning new energy vehicle sector.
Vietnam's electricity demand is growing at 15% annually, but it needs $123 billion in investments to build new generation capacity to meet this demand. Reforms are being implemented to attract more private and foreign investment by making the power industry more transparent and liberalizing electricity prices. Currently, hydropower generators receive the lowest prices for their electricity, but they have the lowest costs and should benefit the most from price liberalization as prices rise closer to market rates.
Vietnam has experienced rapid growth in primary energy consumption over the last decade. Domestic oil and gas production is unable to keep up with rising demand, requiring increased imports. Vietnam is seeking to develop new oil and gas resources through foreign investment and expansion of exploration and production activities abroad. However, domestic oil production is expected to decline significantly by 2020 while demand continues to rise. To address this, Vietnam is planning to bring new refineries online to increase refining capacity and reduce imports of petroleum products, but deficits in liquefied petroleum gas are still expected after 2020. Oil and gas stocks are currently favored investments on Vietnam's stock market due to rising commodity prices and industry fundamentals.
The document discusses the opportunities and growth of electric vehicles (EVs) in India. It notes that EVs have significant potential as fossil fuels are limited, and EVs can be generated through various means with less global warming. The Indian government is prioritizing the shift to EVs to meet carbon reduction targets. In the 2019 budget, Rs. 10,000 crore was allocated to the FAME II scheme to accelerate EV adoption. Major automakers are introducing new EV models for the Indian market in response to government support and changing consumer preferences. However, challenges remain around developing charging infrastructure nationwide and lowering battery costs to boost widespread EV adoption in India.
Vietnam, a hidden gem in power development & investingPhat Nguyen
1) Vietnam has experienced rapid growth in electricity demand but faces power shortages due to reliance on state-owned utilities for generation and distribution.
2) The government aims to diversify energy sources and increase private sector investment in power projects including IPPs, BOT, and joint ventures.
3) Opportunities exist for private companies to invest in hydropower, coal, gas, and renewable energy generation projects to help meet Vietnam's projected electricity demand and alleviate power shortages.
Impact of Paris Agreement on India's Automobile industry pranjulgupta20
This document summarizes the impact of the Paris Agreement on India's automobile industry. It discusses key points of the Paris Agreement, including commitments by India to reduce greenhouse gas emissions and increase renewable energy. It then discusses how electric vehicles will disrupt the automotive ecosystem by changing automakers, dealers and suppliers, end customers, and government regulations. It also covers issues around expanding electric vehicle range and charging infrastructure. Finally, it summarizes the impact of transitioning to stricter BS-6 emission standards in India on increasing vehicle prices and requiring automakers to invest over $10 billion in new technology.
Blu-Smart has carried out a comparative of India Vs countries like China, Belgium, Germany, Italy and many more with respect to electric vehicle policies, tax benefits & incentives applicable.
The global stock of electric vehicles surpassed 1 million in 2015, up significantly from previous years. Policy support has lowered costs and extended vehicle range, helping more countries achieve over 1% electric car market share in 2015. China became the largest electric car market in 2015, surpassing the United States for the first time. Substantial new electric vehicle charging infrastructure was also installed globally in 2015 to support electric vehicle deployment. Further technological progress and economies of scale are still needed to achieve cost parity with gasoline vehicles and facilitate widespread electric vehicle adoption.
The Electric Vehicles are the future of our country. The Government also target to switch to e-vehicles in the near future which is better alternative to fuel-based automobiles to mitigate air pollution. The Indian government aims to build a network of charging infrastructure throughout the country which is good opportunity for the start-up and also giving the incentive for generation of green energy. As the most of the auto industry has been complaining about the lack of charging support directly discouraging their interest in switching vehicles to electric. The lack of Charging Stations develop the fear that if vehicle will run out of charge and no charging station near them what they will do. So our mission is to provide E service on battery charging, battery replacement, Pickup the vehicle and unload to nearby garage, and if any excess of generation of electricity sold to DISCOM at government decided rate., which will boost the public interest in commuting between cities, enabling a smooth and sustainable transition to a future-oriented mobility solution. Our company will use the solar system to provide the charging service to the customers. Our future plans is to reach the different states and remote areas for providing charging stations which encourage the people to buy the Electric Vehicle
The global power and utilities sector is undergoing significant transformation, which is challenging traditional business models, and paving way for new technologies. In all major developed economies, utility companies face a tough operating environment, and this is resulting in several new business models that are mainly based on technological advancements and customer services.
Electricity transmission grid, historically a regulated and traditionally run entity, is also moving in the same direction, and adopting several new technologies, such as Smart, energy storage, and high voltage capacity corridors. Evolution is mostly seen in developed regions with a mature power and utility sector, such as Germany, the UK and the US. However, developing economies too are looking to leapfrog to new models, and currently building plans for the future. The global smart grid market is considered as the grid of the future and is pegged at US$70 billion by 2023.
Saur Energy talks to Tata Power on 'EV Market in India' Tata Power
The document discusses the challenges facing electric vehicles (EVs) in India. It summarizes perspectives from industry experts on current policy challenges and whether India's target of 30% EV market share by 2030 is achievable. Key challenges mentioned include the high cost of EVs, lack of charging infrastructure, unclear regulations around EV charging prices, and difficulties in setting up charging stations due to issues like real estate costs and lack of financing support. However, experts also believe the target is achievable if policy implementation improves, private sector participation increases, and subsidies help boost initial adoption rates.
Power Markets in Emerging Economies - Market Outlook, Capacity and Generation...ReportsnReports
This report analyzes power markets in seven emerging economies - India, China, Russia, Brazil, South Africa, Mexico, and Indonesia - through 2020. It provides historical and forecast data on generation capacity and electricity consumption for each country. The report finds that these seven countries currently account for over one-third of global power consumption, and are expected to contribute half of new global generation capacity additions by 2020. Key opportunities for growth include expanding renewable energy, while challenges involve improving infrastructure and meeting rising electricity demand.
The document summarizes the key points from a presentation on the Union Budget and electric vehicles in India. Some of the main points included in the Union Budget to promote electric vehicles are income tax rebates up to ₹1.5 lakh for customers purchasing electric vehicles and customs duty exemption on lithium-ion cells to lower battery costs. The FAME II scheme allocates ₹10,000 crore over three years to support electric vehicle adoption and charging infrastructure development. The presentation outlines the objectives and features of the FAME II scheme to encourage faster adoption of electric vehicles and establish necessary charging infrastructure.
How an Electric Vehicle can be a potential threat to CNG. What is Govt Initiative that is a boon to the electric vehicle industry are discussed & how various stakeholders are showing their interest in EV.
Electric vehicle battery recycling industrymaheshb73
This document provides a research report on the electric vehicle battery recycling industry forecast for 2025. It discusses how battery recycling helps address environmental challenges from vehicle batteries and the growing demand for electric vehicles. The global market for electric vehicle battery recycling is estimated to reach $3 billion by 2025, driven by factors like stringent emissions regulations and rising disposable income. The report segments the market and provides forecasts for different regions. Asia Pacific currently holds the largest market share and is expected to grow rapidly due to developing battery recycling industries and growing electric vehicle adoption.
AMERICAN MANGANESE CATHODE RECYCLING TECHNOLOGYLarry Reaugh
New Technologies That May Change the Economics of Recycling Lithium-Ion Batteries
The Cobalt Conference 2017
Cobalt Development Institute
Marrakech, Morocco - May 17/18, 2017
Cognitive Market Research provides detailed analysis of erw steel pipes and tubes in our recently published report titled, "erw steel pipes and tubes 2021" The market study focuses on industry dynamics including driving factors to provide the key elements fueling the current market growth. The report also identifies restraints and opportunities to identify high growth segments involved in the erw steel pipes and tubes market. Key industrial factors such as macroeconomic and microeconomic factors are studied in detail with help of PESTEL analysis in order to have a holistic view of factors impacting erw steel pipes and tubes market growth across the globe. Market growth is forecasted with the help of complex algorithms such as regression analysis, sentiment analysis of end-users, etc. #erwsteelpipesandtubesReport #erwsteelpipesandtubesMarketForecast #erwsteelpipesandtubesMarketStatus #erwsteelpipesandtubesMarket2021
According to the Central Electricity Authority (CEA), the average per capita electricity consumption in India is about 704 kWh as compared to global world wide per capita consumption of 2,752 kWh. The Government of India is keen to increase per capita consumption of energy to raise living standards in the country. An average Indian consumes 0.53 tonnesof oil equivalent (TOE) of energy compared to the global average of 1.82 TOE.Higher economic growth is driving income growth, which in turn is driving up industrial investment and fuel consumption. In general, demand exceeds supply and there is a broad-based energy shortage, which is either met by imports or remains unmet.
Coverage includes - EV Type & technology used, charging options, adoption, sales trends, recent investments, market share of top countries, India's initiatives to boost EV, charging infra., challenges, etc.
4th Energy Wave Fuel Cell and Hydrogen Annual Review, 2015Kerry-Ann Adamson
The 2015 4th Energy Wave Fuel Cell and Hydrogen Annual Review is the latest in an unbroken record of publishing a qualitative and quantitative analysis of the global fuel cell industry.
Authored since 2008 by Dr. Kerry-Ann Adamson, then of Fuel Cell Today and now the CEO of 4th Energy Wave, the report presents the only review of the growing sector produced from primary information gathering.
Since 2010, the world has added more solar photovoltaic (PV) capacity than in the previous four decades. New systems were installed in 2013 at a rate of 100 megawatts (MW) of capacity per day. Total global capacity overtook 150 gigawatts (GW) in early 2014. The geographical pattern of deployment is rapidly changing. While a few European countries, led by Germany and Italy, initiated large-scale PV development, PV systems are now expanding in other parts of the world, often under sunnier skies. Since 2013, the People’s Republic of China has led the global PV market, followed by Japan and the United States. PV system prices have been divided by three in six years in most markets, while module prices have been divided by five. The cost of electricity from new built systems varies from USD 90 to USD 300/MWh depending on the solar resource; the type, size and cost of systems; maturity of markets and costs of capital. This roadmap envisions PV’s share of global electricity reaching 16% by 2050, a significant increase from the 11% goal in the 2010 roadmap. PV generation would contribute 17% to all clean electricity, and 20% of all renewable electricity. China is expected to continue leading the global market, accounting for about 37% of global capacity by 2050. Achieving this roadmap’s vision of 4 600 GW of installed PV capacity by 2050 would avoid the emission of up to 4 gigatonnes (Gt) of carbon dioxide (CO2) annually. This roadmap assumes that the costs of electricity from PV in different parts of the world will converge as markets develop, with an average cost reduction of 25% by 2020, 45% by 2030, and 65% by 2050, leading to a range of USD 40 to 160/MWh, assuming a cost of capital of 8%. To achieve the vision in this roadmap, the total PV capacity installed each year needs to rise rapidly, from 36 GW in 2013 to 124 GW per year on average, with a peak of 200 GW per year between 2025 and 2040. Including the cost of repowering – the replacement of older installations – annual investment needs to reach an average of about USD 225 billion, more than twice that of 2013.
Lithium Consolidated Mineral Exploration Ltd (LCME) is launching an IPO to fund lithium exploration and mining operations. LCME owns the largest land plot in Nevada's Big Smokey Valley, a lithium-rich region near a successful lithium mine. The project has ideal geology and is close to Tesla's Gigafactory, ensuring demand for its product. LCME has an experienced mining team led by specialists with successful track records developing lithium projects. Global demand for lithium from battery technologies is growing exponentially, making this an opportune time for the IPO.
TradersCircle provides trading education and support to help individuals achieve their trading goals. It is a corporate authorised representative of OzFinancial Pty Ltd and offers comprehensive trading courses taught by an ASX education partner to fast track students to trade like professionals. The courses include strategies for any market, risk management rules, and support from a personal trainer.
TradersCircle provides trading education and support services. It is an authorized representative of OzFinancial Pty Ltd and partners with the ASX for education. TradersCircle teaches strategies for picking stock price directions like a professional trader, along with risk management rules. Students receive daily updates, recommendations and support from a personal trainer to help achieve their trading goals.
Warren 10 Crucial Reasons For Warren Buffett’s Unstoppable SuccessReach Markets
Warren Buffett is undeniably a genius and arguably the most successful investor on the planet! .
Take a look below to learn what we think are the 10 most crucial reasons for Warren Buffett’s extraordinary success that every investor needs to know.
Who Trades? A closer look at who the typical trader is at TradersCircleReach Markets
The document discusses the profile of typical traders. It states that traders come from all walks of life and have a variety of motivations for trading such as income, protecting investments, or enjoyment. Traders range in age from 16 to 84 years old and come from various professions including retired, finance, IT, and management. Traders are located all over Australia and some are women. Learning strategies for picking directions, different trading strategies, and risk management is important for becoming a confident trader.
3 Things That Separates Traders From Successful TradersReach Markets
Trading on the stock market can be a stressful experience, especially for beginners and novices alike. Sometimes it can feel like you're simply gambling and other times it can feel like you're going through a pressure cooker of extreme emotions.
What's stopping you from being a successful trader?
Successful traders are like any other trader except they've learnt how to manage these stresses using three key techniques. These techniques are designed to remove unnecessary emotions and to ensure that they are using the right strategy, at the right time, for the right stock.
The document discusses the profile of typical traders. It states that traders come from all backgrounds and walks of life, with varying motivations for starting to trade such as earning income, protecting investments, or enjoying it as a hobby. The youngest trader discussed was 16 years old, while the oldest was 84, and traders come from a variety of professions including retired individuals, those in finance, IT, management, and accounting. It emphasizes that the most important part of trading is learning strategies, direction picking, risk management, and having support and education to practice implementing these skills.
3 Things You Should Know if You're Going To Trade - TradersCircleReach Markets
Three things you should know if you're going to trade.
If you would like to learn more about our trading education and course, view our website here: http://traderscircle.com.au/
The Trading Mastery Program by TradersCircleReach Markets
This document describes the Trading Mastery Program offered by TradersCircle Pty Ltd. The program teaches trading strategies and principles to beginner, experienced, and successful traders through direct education from a professional trader and support from a dedicated trainer. Participants will learn how to pick market direction, strategies for all conditions, and risk management. The goal is for traders to graduate as independent traders who can successfully implement what they've learned.
Spread Trading using Options - A simple guide for traders and investorsReach Markets
Spread trading can have some significant advantages for traders and investors, and with education and practise, the full potential of trading options can be utilised.
By understanding spread strategies, a trader has the ability to profit from up, down and sideways moving markets. Spread strategies can even be utilised when a trader doesn’t know which way the market will move, as long as it moves either up or down.
Depending on the strategies, with spreads we can:
• Design trades for varying market conditions
• Use strategies that minimise risk
• Trade with smaller amounts of capital
This presentation will help you unlock the full potential of options, by understanding puts, calls and spread trading.
Exchange Traded Options: An Introduction to Trading Options on the ASXReach Markets
Exchange traded options are a leveraged financial product provided by the ASX. They are classified as a derivative, which means their value derives from a company share.
This guide is part one in our series to help traders and investors understand how to utilise options.
April 2016 Trading Mastery Program Testimonials Reach Markets
The document discusses the benefits of exercise for mental health. Regular physical activity can help reduce anxiety and depression and improve mood and cognitive functioning. Exercise causes chemical changes in the brain that may help protect against mental illness and improve symptoms.
March 2015 Trading Mastery Program TestimonialsReach Markets
The document discusses the benefits of exercise for mental health. Regular physical activity can help reduce anxiety and depression and improve mood and cognitive functioning. Exercise causes chemical changes in the brain that may help protect against developing mental illness and improve symptoms for those who already have a condition.
The document provides information for those interested in owning and operating a Subway franchise. It details that the initial franchise fee is $15,000-$15,000 USD and the total investment is $116,000-$263,000 USD. Franchisees pay 12.5% of weekly gross sales in royalty and advertising fees. Subway offers training, support, and assistance with site selection, construction, and purchasing. The application process is the first step to learning more about franchise opportunities.
The document provides guidance on creating an effective trading plan. It recommends starting with a defined risk capital amount that would not cause financial hardship if lost. The plan should include goals for monthly profit targets or annual returns. Factors like trading odds, desired profit per trade, and maximum loss per trade should be considered to determine the number of trades needed per month to achieve goals. Maintaining higher trading odds and limiting losses while taking larger profits per successful trade are key to success.
Lithium demand is growing rapidly due to increasing adoption of lithium-ion batteries for electric vehicles, energy storage systems, and electronics. Global investments totaling over $400 billion are driving significant capacity expansions in battery megafactories and electric vehicle production. As battery usage grows, demand for raw materials like lithium, graphite, cobalt, and nickel is expected to increase substantially. Lithium-ion battery manufacturers and automakers seek long-term, scalable supplies of high-quality lithium from geopolitically stable jurisdictions to ensure reliable delivery.
- Lithium demand is growing rapidly due to increased use of lithium-ion batteries in electric vehicles, energy storage systems, and electronics. Major automakers and battery megafactories are investing hundreds of billions to expand electric vehicle and battery production.
- Lithium is primarily sourced from brine deposits in South America and hard rock deposits in Australia. Meeting growing demand will require establishing new lithium supplies that can reliably produce high quality, battery-grade lithium with secure, long-term access.
- Attributes like long mine life, scalability, and consistent product quality are important for supplying the lithium needs of automakers and megafactories. Sources must also be located in stable geopol
This document provides an overview of the battery supply chain in Europe, including raw materials, bottlenecks, and potential solutions. It discusses the growth of the EV market in Europe and increasing demand for battery materials like lithium, cobalt, and nickel through 2030. Current supply chain disruptions are outlined, with Europe heavily reliant on other regions for raw materials. Proposed solutions focus on developing secondary supply chains through battery reuse, recycling, and investing in recycling facilities. Long-term strategies include alliances to diversify raw material sourcing and funding to encourage domestic refining and production.
The document summarizes key developments in critical minerals markets in 2022 and 2023:
- Demand for critical minerals used in clean energy technologies like batteries and electric vehicles grew rapidly due to record deployment, driving up prices and market size.
- Many critical minerals experienced high price volatility in 2021-2022, though most prices moderated later in 2022, highlighting the importance of stable mineral supplies for affordable energy transitions.
- Countries are implementing new policies to diversify critical mineral supplies and enhance sustainability, shown by nearly 200 policies tracked by the IEA in recent years.
The inaugural Critical Minerals Market Review from the IEA provides the following key findings:
- Demand for critical minerals is growing rapidly driven by record deployment of clean energy technologies like EVs and batteries. This is straining supply chains and contributing to price volatility.
- Countries are implementing new policies to diversify critical mineral supplies and investing heavily in mining projects, but questions remain around the adequacy and sustainability of future supply.
- The battery sector is transforming with new technologies like sodium-ion batteries emerging while recycling is ramping up, but remains concentrated in China for now.
- Automakers and others are increasingly investing directly in critical mineral supply chains to secure materials, but diversified midstream supply
The document summarizes key findings from the IEA's Global EV Outlook 2022 report. It finds that electric vehicle sales doubled in 2021 to 6.6 million but that mineral supply constraints for batteries are looming. China accounted for half of 2021's EV sales growth and has the lowest price gap between EVs and gasoline vehicles. Infrastructure rollout needs to accelerate and heavy-duty vehicle electrification is in early stages. The report provides recommendations to maintain EV support policies, kickstart heavy-duty electrification, and promote EV adoption in emerging economies.
IEA publication, May 2024
Critical minerals, which are essential for a range of clean energy technologies, have risen up the policy agenda in recent years due to increasing demand, volatile price movements, supply chain bottlenecks and geopolitical concerns. The dynamic nature of the market necessitates greater transparency and reliable information to facilitate informed decision-making, as underscored by the request from Group of Seven (G7) ministers for the IEA to produce medium- and long-term outlooks for critical minerals.
The Global Critical Minerals Outlook 2024 follows the IEA’s inaugural review of the market last year. It provides a snapshot of industry developments in 2023 and early 2024 and offers medium- and long-term outlooks for the demand and supply of key energy transition minerals based on the latest technology and policy trends.
The report also assesses key risks to the reliability, sustainability and diversity of critical mineral supply chains and analyses the consequences for policy and industry stakeholders. It will be accompanied by an updated version of the Critical Minerals Data Explorer, an interactive online tool that allows users to explore the latest IEA projections.
China, Japan, and South Korea accounted for about 93% of global lithium-ion battery production in 2013. China's lithium-ion battery industry is growing faster than the global average, at 10-13% higher, and production capacity is increasingly relocating to China. Global demand for lithium-ion batteries is expected to increase from 67.07 million kWh in 2014 to 131.20 million kWh in 2016, driving the industry's revenues over $35 billion globally by 2016. The growth is driven by increasing demand from China's alternative energy vehicle industry, which is supported by favorable government policies.
1) Battery demand is expected to grow exponentially due to increasing EV adoption and energy storage needs, reaching around 940 GWh by 2025 and 2,300 GWh by 2030.
2) There is expected to be a shift in battery chemistries towards less cobalt-intensive but more nickel-intensive types like NMC811 and NMC622 in order to reduce raw material costs and dependence on cobalt.
3) The rapid growth in battery demand is likely to outstrip available supplies of cobalt and high-purity nickel by 2025, potentially hampering further EV adoption, unless mining output can be significantly increased.
THE PATH TOWARDS THE US BATTERY SUPPLY CHAIN INDEPENDENCEiQHub
This document summarizes a presentation on global battery supply chains and the implications of the US Inflation Reduction Act. It discusses growing demand for electric vehicle batteries and the need for increased production capacity of battery components like cathodes, anodes, lithium and nickel. It notes most battery production currently occurs in China and outlines requirements in the Inflation Reduction Act aimed at establishing more domestic US and allied country supply chains. The Act provides tax credits for electric vehicles meeting certain battery mineral and component sourcing standards from the US and allies.
Start Production Unit of Lithium Ion Battery. Beneficial Business of Li-ion B...Ajjay Kumar Gupta
Start Production Unit of Lithium Ion Battery. Beneficial Business of Li-ion Battery Assembling for New Entrepreneur.
A lithium-ion battery, sometimes known as a Li-ion battery, is a rechargeable battery type. Lithium-ion batteries are widely utilised in portable gadgets and electric cars, and their employment in military and aerospace applications is increasing. During discharge, lithium ions travel from the negative electrode to the positive electrode via an electrolyte, and vice versa while charging. The positive electrode of a lithium-ion battery is made of an intercalated lithium compound, while the negative electrode is usually made of graphite.
For more details: https://bit.ly/3hWeXCn
Contact us
NIIR PROJECT CONSULTANCY SERVICES
An ISO 9001:2015 Company
ENTREPRENEUR INDIA
106-E, Kamla Nagar, Opp. Mall ST,
New Delhi-110007, India.
Email: npcs.ei@gmail.com, info@entrepreneurindia.co
Tel: +91-11-23843955, 23845654, 23845886
Mobile: +91-9097075054, 8800733955
Website: https://www.entrepreneurindia.co
https://www.niir.org
Li-ion Battery Production Business. Lithium Ion Battery (LIB) Assembling Industry
Global Lithium Ion Battery market was valued at $30,186.8 million in 2017, and is projected to reach $100,433.7 million by 2025.
Lithium-ion batteries (LIB) are a family of rechargeable batteries having high energy density and commonly used in consumer electronics. Unlike the disposable lithium primary battery, a LIB uses intercalated lithium compound instead of metallic lithium as its electrode.
Usually, LIBs are significantly lighter than other kinds of rechargeable batteries of similar size. LIBs are heavily used in portable electronics. These batteries can be commonly found in PDAs, iPods, cell phones, laptops, etc. This term is also known as a LI-ion.
See more
https://bit.ly/2Z0LbjV
https://bit.ly/32AKDU6
Contact us:
Niir Project Consultancy Services
An ISO 9001:2015 Company
106-E, Kamla Nagar, Opp. Spark Mall,
New Delhi-110007, India.
Email: npcs.ei@gmail.com , info@entrepreneurindia.co
Tel: +91-11-23843955, 23845654, 23845886, 8800733955
Mobile: +91-9811043595
Website: www.entrepreneurindia.co , www.niir.org
Tags
#Lithium_Ion_Battery, #Lithium_Ion_Battery_Assembly, #Li_Ion_Battery_Assembling, #Lithium_Ion_Battery_Assembly_Plant, Lithium Ion Battery Assembly Process, How to Assemble Lithium-Ion Battery, #Lithium_Ion_Battery_(LIB)_Manufacturing_Industry, Lithium-Ion Battery Manufacturing, Manufacturing of Lithium-Ion Batteries, #Lithium_Battery_Manufacturing, #Project_Report_on_Lithium_Ion_Battery_Assembling_Unit, Battery Assembly Plant, Lithium Ion Battery Production, Lithium-Ion Batteries Manufacturing Process, How to Set Up Lithium Ion Battery Plant in India, #Lithium_Ion_Battery_Business, Lithium-Ion Battery Manufacture, #Lithium_Ion_Battery_Manufacture_in_India, Lithium Ion Battery Manufacturing Plant Cost in India, Lithium Ion Battery Manufacturing Plant Project Report, Cost of Setting Up Lithium Ion Battery Manufacturing Plant, Lithium-Ion Battery Production Business, How to Start Lithium Ion Battery Manufacturing Business in India, Li-Ion Battery Assembling Business, Producing Lithium-Ion Batteries, #Detailed_Project_Report_on_Li_Ion_Battery_Assembling, Project Report on Li-Ion Battery Assembling, Pre-Investment Feasibility Study on Lithium-Ion Battery Manufacturing Business, Techno-Economic feasibility study on Lithium-Ion Battery Manufacturing Business, Feasibility report on Lithium-Ion Battery Manufacturing Business, Free Project Profile on Lithium-Ion Battery Manufacturing Business, Project profile on Li-Ion Battery Assembling, Download free project profile on Li-Ion Battery Assembling
Project report on lithium ion battery manufacturing and assembling unitSudhir Gupta
This document provides a project report on setting up a lithium-ion battery assembling unit. It includes details of the market position and future demand for lithium-ion batteries, an overview of the manufacturing process, cost estimation for setting up a 167 unit per day plant, and analysis of the lithium-ion battery market in India. The report finds that the Indian lithium-ion battery market is expected to grow at a CAGR of 29.26% from 2018-2023 due to decreasing battery costs and growth in electric vehicles and renewable energy storage.
2012 deep research report on global and china lithium ion battery industrysmarter2011
This document provides a 161-page research report on the global and Chinese lithium-ion battery industry from 2012. It begins with background knowledge on lithium-ion batteries and then provides statistics and analysis on production, capacity, costs, profits and market share for 26 global battery manufacturers. It also examines the lithium-ion battery market for applications such as mobile phones, power tools, automotive and energy storage. The report is available for purchase from QY Research Group for US$2,500 and contains 217 tables and figures providing in-depth data and analysis of the lithium-ion battery industry.
2012 deep research report on global and china lithium ion battery industrysmarter2011
This document provides a 161-page research report on the global and Chinese lithium-ion battery industry from 2012. It analyzes the industry's supply chains, key companies, production volumes, prices and other metrics. Specifically, the report profiles 26 global manufacturers and 18 Chinese manufacturers. It also examines production, demand, costs and other trends. Finally, it includes a feasibility analysis for a hypothetical 30 million piece per year lithium-ion battery project in China. The report aims to provide an in-depth look at the lithium-ion battery industry worldwide and within China.
2010 deep research report on china new energy vehiclesqyresearch
The document is a 216-page professional report on new energy vehicles in China published in 2010. It provides:
1) A comprehensive overview of the development status and classifications of various new energy vehicles in China and globally, such as hybrid, battery electric, fuel cell, hydrogen, and gas vehicles.
2) Detailed profiles and analyses of the major Chinese and international manufacturers in the new energy vehicle industry, including their product lines, production capacities, and development strategies.
3) In-depth discussion of key industry topics like new energy vehicle technology evolution, battery analysis, product development prospects, investment opportunities and risks.
The report aims to inform clients about the real-time status, trends, demands and
Energy Storage Battery. An executive summary of batteries, driver and forecastIwan Susanto
The document discusses batteries and forecasts for battery markets. It notes that increasing production volume will lower battery prices. Battery demand is driven by electric vehicles and renewable energy storage and is expected to grow substantially by 2030. However, battery production faces constraints from limited supplies of metals like lithium, cobalt, and nickel. The document outlines global reserves of lithium and forecasts continued growth in demand for batteries outpacing current production capacity. It also summarizes several battery manufacturing projects planned or underway in Indonesia.
Income Fund - Secured High Yield Convertable Note Reach Markets
This Income Fund has been set up for a one-year period to provide expansion capital to two underlying assets both of which are asset rich and cash-flow positive, with strong asset coverage ratios.
With a fully underwritten return of up to 18% p.a paid monthly, this is an opportunity to take advantage of a high yield investment whilst interest rates are low and the worldwide economic picture remains hard to predict.
Toro Energy Investor Presentation (15 June)Reach Markets
This document provides a summary of risks associated with acting on advice from OzFinancial without seeking personal advice. It notes that any advice is general in nature and does not consider individual circumstances. It advises readers to review OzFinancial's Financial Services Guide and relevant product disclosure statements to understand associated risks, which include the potential for losses greater than the value invested. Past performance is not a reliable indicator of future returns, and successful trading strategies do not guarantee profits due to inherent risks when trading and investing.
TradersCircle provides trading education programs taught by professional traders to help students learn trading strategies and skills. It offers comprehensive courses, support from a personal trainer, and daily trade recommendations and updates to guide students. Testimonials from past students praise the informative training and supportive staff for providing them with trading knowledge and abilities.
This document summarizes an investment opportunity in Toro Energy Limited, an Australian uranium exploration and development company. The key points are:
1. Toro Energy is offering a Share Purchase Plan (SPP) to continue reducing production costs and explore potential gold assets at its uranium projects in Western Australia.
2. The SPP offers shares at $0.025 per share, with a minimum $2,500 and maximum $15,000 investment amount. Applications are due by June 25th.
3. OzFinancial Australia is advising on the SPP and may receive fees depending on the level of investment. Investors are advised to consider the risks and read all documentation carefully before investing.
Berkshire Hathaway Investment Overview Series 39Reach Markets
1. The document advertises an international investment opportunity with exposure to international markets through a $11,975 net investment providing $50,000 in exposure, managed by a world class investment manager over a three year term, with the maximum loss capped at the initial investment amount.
2. It provides contact information for OzFinancial and TradersCircle and notes that any advice is general in nature and potential investors should consider risks and consult their professional advisors before deciding to invest.
3. The investment is presented as suitable for those seeking international exposure, an investment with capped downside, and world class investment management.
Active Income From Portfolio - Education Course Reach Markets
The document discusses strategies to generate additional portfolio income on a monthly basis. It describes how investors can boost portfolio yield, build their portfolio faster, and create cash flow to improve lifestyle. The company helps people learn these strategies by teaching step-by-step, providing support, and sharing research reports. The goal is to increase portfolio yield, reduce volatility, and boost cash flow.
TradersCircle Pty Ltd and OzFinancial Pty Ltd offer trading education courses taught by professional traders to help students learn trading strategies and skills. Their comprehensive courses provide trading knowledge, strategies for any market, and risk management rules. Students receive support from a personal trainer and daily trade recommendations. Testimonials from past students praise the courses for providing a strong foundation and ongoing support for learning to trade professionally.
The document is an IPO presentation for Mako Gold Limited, an exploration company focused on gold projects in West Africa. It introduces Mako's management team which has a proven track record of gold discoveries in the region from previous work with Orbis Gold. Mako has secured two projects in Burkina Faso and a third project in Côte d'Ivoire through a farm-in agreement. The presentation provides details on Mako's IPO terms, proposed timeline and cash uses as well as an overview of its projects which show potential through initial drilling and soil/auger sampling.
This document describes a diversified global investment fund offered by OzFinancial Australia. The fund provides exposure to international markets through investments managed by several well-known global fund managers. It offers a $100,000 exposure while only requiring a $9,960 net investment due to an upfront interest payment. The investment has a four-year term and caps the investor's downside risk at $9,960 while providing uncapped upside potential. Annual performance coupons may also be paid depending on fund returns.
Mako Gold IPO Presentation 2018 - 9 March Reach Markets
The document is an IPO presentation for Mako Gold Limited, an exploration company focused on gold projects in West Africa. It introduces Mako's management team which has extensive experience in the region, including previous discoveries. Mako has secured three highly prospective projects in Cote d'Ivoire and Burkina Faso through agreements and options. The projects show potential for multi-million ounce gold deposits based on their locations in fertile Birimian greenstone belts similar to other major gold districts in West Africa. The IPO aims to raise $6 million to fund exploration programs to evaluate targets across the projects.
TradersCircle Pty Ltd and OzFinancial Pty Ltd provide trading education and support services. They teach trading strategies, rules for picking stock price direction, and risk/money management. Their courses aim to fast track students' knowledge and skills to trade like professionals. Students receive daily updates and trade recommendations while being supported by a personal trainer. Testimonials praise the organizations' professionalism, knowledge, and support.
This document promotes an investment opportunity in Mako Gold, an IPO mining company exploring for gold in West Africa. It highlights Mako Gold's team of experts who have previously discovered over 2.6 million ounces of gold in West Africa. It notes the region is highly prospective and under-explored with over 80 million ounces of gold discovered. It provides details on Mako Gold's assets, team, and reputation, as well as key offer details for the IPO such as minimum subscription of $5 million and proposed listing date on the ASX of March 23, 2018 under the code MKG. It encourages investors to apply now to best ensure an allocation in the IPO and provides contact details to speak with an advisor.
Woomera Exploration Limited (WEX) is an exploration company that holds tenements prospective for lithium and base metals in Western Australia and South Australia. WEX's tenements include hard rock lithium projects near Pilbara Minerals' Pilgangoora deposit and Galaxy Lithium's Mt Cattlin mine, as well as lithium brine prospects over several salt lakes. WEX also holds tenements in the Musgrave Province under a heads of agreement with OZ Minerals, which cover copper-nickel targets. WEX will acquire the tenements upon relisting through the acquisition of other companies.
Diversified Global Funds - Investment Overview Reach Markets
This document provides information about a diversified global funds investment opportunity offered by Oz Financial. It has a four year term with $9,960 maximum risk but $100,000 of exposure across multiple global asset managers. This investment is designed to provide upside potential while protecting against downside risk through a mix of long and short assets that can perform in varying market conditions. It offers international exposure through top fund managers with a long history of managing billions of dollars in assets.
This document summarizes an investment opportunity in BlackEarth Minerals NL, an IPO that gives exposure to a mining exploration company. The company has assets in six locations in Australia and Madagascar, and an experienced management team with diverse skills in the resources sector. A minimum subscription of $4.5 million is sought, with shares offered at $0.20 each. The general closing date for applications is December 14, 2017.
OzFinancial Australia Pty Ltd is a corporate authorised representative that provides advice on investments, including an IPO opportunity for BlackEarth Minerals NL, a company with graphite projects in Western Australia and Madagascar. BlackEarth has an experienced management team with successful experience in the African mining sector and graphite. The IPO offers exposure to multiple graphite projects and a growing market demand for graphite in batteries and electronics.
This document provides information about an initial public offering from BlackEarth Minerals NL, an Australian company focused on graphite exploration and production. BlackEarth has graphite assets in six locations across Western Australia and Madagascar. The company is led by an experienced management team with successful track records in the African mining sector and expertise in graphite. Global demand for graphite is increasing due to its use in lithium-ion batteries and other applications. BlackEarth aims to unlock shareholder value by advancing its portfolio of assets, some of which will be in production phases while others are explored.
OzFinancial Australia Pty Ltd is promoting an IPO opportunity for BlackEarth Minerals NL, a company with graphite assets in Western Australia and Madagascar. BlackEarth has an experienced management team with successful experience in the African mining sector and expertise in graphite. The IPO offers exposure to multiple graphite projects located in highly prospective areas that are expected to deliver staged value to shareholders. Global demand for graphite is increasing due to its use in lithium-ion batteries and electronics.
OzFinancial Australia Pty Ltd is promoting an IPO for BlackEarth Minerals NL, a company with graphite assets in Western Australia and Madagascar. BlackEarth has an experienced management team with a track record in the African mining sector and expertise in graphite. The IPO offers exposure to multiple graphite projects and a growing market demand driven by electric vehicles and batteries. The minimum subscription is $4.5 million with a minimum investment of $2,000. OzFinancial encourages investors to apply now to secure an allocation in the IPO.
This document summarizes an investment opportunity in Bojun Agriculture Holdings, a Chinese company that produces fruit-based products from Nanfeng mandarins. It describes Bojun as an established, highly profitable business experiencing 40% annual growth that operates in the large and growing Chinese healthcare market. The investment opportunity features Bojun's plans for rapid expansion in this strong market using its established distribution channels. Key details provided include a minimum $2,000 investment amount and expected November listing on the ASX under the code BAH. Risk disclosures note that any investment comes with risks and potential investors should carefully review the full prospectus.
TEST BANK Principles of cost accounting 17th edition edward j vanderbeck mari...Donc Test
TEST BANK Principles of cost accounting 17th edition edward j vanderbeck maria r mitchell.docx
Vicinity Jobs’ data includes more than three million 2023 OJPs and thousands of skills. Most skills appear in less than 0.02% of job postings, so most postings rely on a small subset of commonly used terms, like teamwork.
Laura Adkins-Hackett, Economist, LMIC, and Sukriti Trehan, Data Scientist, LMIC, presented their research exploring trends in the skills listed in OJPs to develop a deeper understanding of in-demand skills. This research project uses pointwise mutual information and other methods to extract more information about common skills from the relationships between skills, occupations and regions.
University of North Carolina at Charlotte degree offer diploma Transcripttscdzuip
办理美国UNCC毕业证书制作北卡大学夏洛特分校假文凭定制Q微168899991做UNCC留信网教留服认证海牙认证改UNCC成绩单GPA做UNCC假学位证假文凭高仿毕业证GRE代考如何申请北卡罗莱纳大学夏洛特分校University of North Carolina at Charlotte degree offer diploma Transcript
Dr. Alyce Su Cover Story - China's Investment Leadermsthrill
In World Expo 2010 Shanghai – the most visited Expo in the World History
https://www.britannica.com/event/Expo-Shanghai-2010
China’s official organizer of the Expo, CCPIT (China Council for the Promotion of International Trade https://en.ccpit.org/) has chosen Dr. Alyce Su as the Cover Person with Cover Story, in the Expo’s official magazine distributed throughout the Expo, showcasing China’s New Generation of Leaders to the World.
An accounting information system (AIS) refers to tools and systems designed for the collection and display of accounting information so accountants and executives can make informed decisions.
Independent Study - College of Wooster Research (2023-2024) FDI, Culture, Glo...AntoniaOwensDetwiler
"Does Foreign Direct Investment Negatively Affect Preservation of Culture in the Global South? Case Studies in Thailand and Cambodia."
Do elements of globalization, such as Foreign Direct Investment (FDI), negatively affect the ability of countries in the Global South to preserve their culture? This research aims to answer this question by employing a cross-sectional comparative case study analysis utilizing methods of difference. Thailand and Cambodia are compared as they are in the same region and have a similar culture. The metric of difference between Thailand and Cambodia is their ability to preserve their culture. This ability is operationalized by their respective attitudes towards FDI; Thailand imposes stringent regulations and limitations on FDI while Cambodia does not hesitate to accept most FDI and imposes fewer limitations. The evidence from this study suggests that FDI from globally influential countries with high gross domestic products (GDPs) (e.g. China, U.S.) challenges the ability of countries with lower GDPs (e.g. Cambodia) to protect their culture. Furthermore, the ability, or lack thereof, of the receiving countries to protect their culture is amplified by the existence and implementation of restrictive FDI policies imposed by their governments.
My study abroad in Bali, Indonesia, inspired this research topic as I noticed how globalization is changing the culture of its people. I learned their language and way of life which helped me understand the beauty and importance of cultural preservation. I believe we could all benefit from learning new perspectives as they could help us ideate solutions to contemporary issues and empathize with others.
Independent Study - College of Wooster Research (2023-2024) FDI, Culture, Glo...
Lithium Industry Review
1.
2. Lithium Industry Overview
CRU Consulting
Page
Contents
1. Introduction............................................................................. 1
2. Lithium demand considerations............................................. 3
2.1 Lithium demand for lithium-ion batteries.........................................................4
2.2 Lithium demand for industrial applications .....................................................5
2.3 Lithium demand by region..............................................................................6
2.4 Upside factors for lithium demand growth ......................................................7
3. Lithium supply considerations ............................................... 9
3.1 Geology and sources of lithium......................................................................9
3.2 Lithium production by region and processing route ........................................9
3.3 Major lithium producers................................................................................10
3.4 Lithium projects: new capacity growth..........................................................11
4. Lithium price considerations ............................................... 12
3. Lithium Industry Overview
CRU Consulting 1
Nevada, USA
State of Minas
Gerais, BrazilSalar de Uyuni, Bolivia
Hombre Muerto, Argentina
Salar de Olaroz, Argentina
Salar de Atacama, Chile
Zimbabwe
Portugal
Tibet, China
Sichuan Province, China
Greenbushes,
Western Australia
▼ Hard rock mines
▼ Brines
▼ Lepidolite
Qinghai Salt Lake, China
Qinghai Lithium, China
Jiangte Motor, China
Data: CRU
Lithium operations by location and type, 2015
1. Introduction
The lithium raw materials sector has historically been an oligopoly, largely dominated by a few
large lithium brine deposits in Latin America, in what is otherwise known as the ”Lithium
Triangle”.
The deposits are owned by Sociedad Quimica y Minera de Chile (“SQM”), FMC and
Rockwood Lithium, a subsidiary of Albemarle Corporation, a global chemicals manufacturer.
The biggest player in the oligopoly is Chengdu Tianqi (Group) Co., Ltd (“Tianqi”), which has
mineral and brine deposits in Australia and South America. CRU estimates that these four
companies accounted for approximately 82% of global lithium production in 2015. The
following map outlines lithium operations by location and type.
Key Players and Intermediate Products
SQM – Brine operation in Chile. Intermediates: Li2O3, LiOH, LiCl.
FMC – Brine operation in Argentina. Intermediates: Li2O3, LiOH, LiCl & others in China, India, UK, and US.
Albemarie – Brine operations in Chile. US. Minerals in Australia (Rockwood 49% JV with Tianqi),
Intermediates: Li2O3, LiOH, LiCl & others in Chile, China, India, UK, US, Taiwan and Germany.
Tianqi – Brine in Tibet (20% stake). Brine in Chile and Minerals in Australia (51% JV with Rockwood).
Intermediates: Lithium concentrates and Li2O3 (Galaxy) in Australia. Li2O3, LiOH, LiCl in China.
Orocobre – Brine operation in Argentina. JV with Toyota Tsushu (25%). Intermediates: Li2O3.
4. Lithium Industry Overview
CRU Consulting 2
The figure below displays the structure of the lithium industry from raw materials (lithium
minerals and brines) to intermediate products (including lithium carbonate and lithium
hydroxide) and end use products for the technical and chemical markets.
5. Lithium Industry Overview
CRU Consulting 3
2. Lithium demand considerations
As shown in the chart below, the global demand for lithium reached approximately 208kt LCE
(lithium carbonate equivalent), in 2015, and was split as follows:
• 58% was used for industrial applications
• 42% was used for lithium-ion batteries (LIBs).
LCE here refers to “lithium carbonate equivalent”. Given the variety of compounds of lithium
and their different lithium content, we adopt the industry standard of LCE and standardise all
our analysis based on this measure.
CRU expects total lithium demand across all applications to grow at a CAGR of 8.4% per
annum from 2015 to 2020 with the lithium demand for batteries to grow at a CAGR of 14.5%
from 2015 to 2020, leading to batteries accounting for around 55% of the total lithium demand
in 2020.
Data: CRU
kt LCE
0
50
100
150
200
250
300
350
2010 2011 2012 2013 2014 2015 2016 2017 2018 2019 2020
Batteries (Volume) Industrial applications (Volume)
6. Lithium Industry Overview
CRU Consulting 4
2.1 Lithium demand for lithium-ion batteries
CRU expects that LIBs will account for the largest share of total lithium demand by 2018. Since
1990, the number of LIB cells manufactured on an annual basis has increased at approximately
16% per annum.
The key factor driving growth in lithium demand for LIBs is the uptake of electric vehicles
(EVs), particularly in China. EVs are zero emission vehicles depending solely on stored
electrical energy, typically in the form of a battery. The source of electricity is connected to an
electric motor. Refuelling is done directly from an electricity source.
The number of electric (EVs), hybrid (HEVs) and plug-in hybrid electric vehicles (PHEVs) is
expected to grow at a total CAGR of 21.7% between 2015 and 2020. CRU also expects strong
growth in LIBs for portable applications such as mobile phones and laptops.
The following table shows CRU’s estimates of growth in lithium demand from key LIB
markets.
Table 1.1: Lithium demand growth (between 2015 and 2020) by key
battery markets
CRU also estimates that the demand for LIBs for energy storage could increase by 24.4% from
2015 to 2020, largely as a result of the anticipated uptake in renewable energy power
generation. The higher proportion of intermittent renewable energy power generation resources
will require integration with existing distribution networks and which can be provided by large
scale LIBs.
The charts below show the share of lithium demand for key LIB applications (in 2015 and as
expected in 2020).
LIB Sector CAGR (2015 to 2020)
Evs 22.0%
Cell Phones 5.2%
Tablets 2.0%
Grid scale storage (Energy Storage) 24.4%
Data: CRU
7. Lithium Industry Overview
CRU Consulting 5
2.2 Lithium demand for industrial applications
In 2015, the demand for lithium from the industrial applications sector reached 122ktpa LCE
and CRU expects this to reach 145kt LCE by 2020 at a CAGR of 3.1%
The figure below illustrates the share of lithium demand from industrial applications by end use
in 2015 and 2020.
Data: CRU
10
5 5 5
17
20
5
1
0
10
20
30
40
50
60
70
Batteries 2015 (kt LCE)
Total demand = 69 kt LCE
13
5 6 5
64
35
13
3
0
10
20
30
40
50
60
70
Batteries 2020 (kt LCE)
Total demand = 145 kt LCE
Data: CRU
60
19
9 8 7
1
17
0
10
20
30
40
50
60
70
80
Industrial applications 2015 (kt LCE)
Total demand = 122kt LCE
71
22
10 10 8
2
19
0
10
20
30
40
50
60
70
80
Industrial applications 2020 (kt LCE)
Total demand = 145 kt LCE
8. Lithium Industry Overview
CRU Consulting 6
2.3 Lithium demand by region
CRU estimates that the demand for lithium was been reasonably distributed across Europe,
North America and Asia until 2010. However, Asia has experienced the strongest growth in
lithium demand primarily due to the production of LIBs for electronics and EVs since 2010.
CRU estimates global production capacity for LIBs at 97 GWh/yr in 2015. China, Japan and
Korea account for approximately 81% of this capacity.
There is an additional 81.2GWh/yr of LIB cell manufacturing projects that are partially
commissioned, under construction or announced across the globe.
The Tesla Gigafactory in Reno, Nevada, United States is under construction and is expected to
provide additional LIB capacity of 35GWh per annum. CRU understands the Tesla Gigafactory
will require approximately 25 kt LCE if it reaches full production.
The chart below shows the global share of lithium demand by region, in 2015 and CRU’s
forecast for 2020.
Data: CRU
40%
16%
8%
12%
14%
10%
Lithium demand split by region, 2020
China Japan South Korea Europe US Others
32%
18%
10%
12%
17%
11%
Lithium demand split by region, 2015
9. Lithium Industry Overview
CRU Consulting 7
2.4 Upside factors for lithium demand growth
(1) Vehicle electrification
The scaling of the electrification of vehicles is the most significant growth driver for LIB
materials demand, and could be depend on a number of factors, including:
• The ongoing progress being made in lowering the manufacturing cost of a battery cell;
and
• Growth in ride sharing and / or the potential introduction of autonomous vehicles,
should lead to considerably higher use of electric vehicles and facilitate more rapid
amortization of the upfront cost of an EV.
(2) Growth in lithium demand from China
China has increased its share of the global EVs market from 7% in 2012 to 48% in 2015. The
Chinese government has announced and issued incentives such as subsidies and financial
support for electric transportation. CRU forecasts an increase in sales of EVs in China at a
CAGR of 34% from 2015 to 2020.
Key factors behind this forecast are:
• Cash incentive and tax subsidies from governments looking to make their cities more
environmentally friendly.
• Government target of 5m New Energy Vehicles on the road by 2020. Along with:
Financial incentives to purchase EVs
No restrictions on license plates or waiting times for EVs
EVs exempted from rush hour restriction
Mandated EVs purchases by public institutions to 50%
• A potential introduction of an air pollution levy by the Chinese government in the
coming years, to narrow the gap between EVs and traditional vehicles (in terms of the
total ownership cost).
• Strong near term growth in hybrid and electric bus penetration (underpinned by the
various government initiatives).
10. Lithium Industry Overview
CRU Consulting 8
(3) Growth in the renewable energy sector
CRU predicts significant upside to lithium demand growth from an increase in renewable
energy power generation and smart grid systems which involve the development of low cost
grid storage systems including LIBs. CRU also expects renewable energy generation to grow at
a CAGR of 11% from 2015 to 2020. This could lead to an additional 2 kt LCE demand for LIBs
for energy storage by 2020.
The following charts demonstrate CRU’s forecast of renewable energy generation growth and
its impact on lithium demand growth.
0
200
400
600
800
1,000
1,200
1,400
1,600
1,800
2,000
Renewable energy generation (TWh)
Data: CRU
0
50
100
150
200
250
300
350
KtLCE Growth in renewable energy and storage
Industrial applications (Volume)
Electronics
Electric vehicles (HEV, PHEV, EV)
Grid scale storage
11. Lithium Industry Overview
CRU Consulting 9
3. Lithium supply considerations
3.1 Geology and sources of lithium
According to the US Geological Survey (USGS), identified global lithium resources and
reserves are estimated to be approximately 201 Mt LCE and 76 Mt LCE respectively1
.
Approximately 60% – 65% of those reserves are located in the ‘Lithium Triangle’. The majority
of the remainder is located in China and Australia.
3.2 Lithium production by region and processing route
CRU estimates suggest that in 2015 Chile, Australia, Argentina and China accounted for 90% –
95% of global lithium production with Chile and Australia being the major producers. In 2015,
lithium production is estimated to have increased 5.5% to 187kt LCE up from 177kt LCE in
1
US Geological Survey, www.usgs.gov
Data: USGS
0
5
10
15
20
25
30
35
40
45
Chile China Australia Argentina United
States
Resources (Mt LCE)
0
5
10
15
20
25
30
35
40
45
Chile China Australia Argentina United
States
Reserves (Mt LCE)
Global lithium resources and reserves
12. Lithium Industry Overview
CRU Consulting 10
2014. The majority of the production gain came from Argentina with Orocobre Limited’s
(“Orocobre”) Salar de Olaroz starting production.
Lithium brine production has historically, been the dominant source of lithium given its
relatively lower production costs compared to hard rock mining.
However, hard rock based lithium production has increased from 35% of global production in
2005 to 54% in 2015. This has been underpinned by the double digit growth in demand and the
inability of brine based operations to keep up with this demand.
3.3 Major lithium producers
The lithium industry is highly concentrated with only a dozen or so large-scale operations.
CRU estimates that in 2015, Tianqi Lithium, Albermarle Corporation (“Albermale”), Sociedad
Quimica y Minera de Chile (“SQM”), FMC and Orocobre accounted for approximately 90 –
95% of global production.
Data: CRU
0
20
40
60
80
100
120
140
160
180
200
2010 2011 2012 2013 2014 2015
Lithium production by region,2010 - 2015 (kt LCE)
Australia Argentina Chile China USA Zimbabwe Portugal Brazil
13. Lithium Industry Overview
CRU Consulting 11
Tianqi Lithium is the world’s largest producer of lithium from operations in Greenbushes,
Western Australia and Zhabuye Salt Lake, Tibet (20% ownership). Tianqi is likely to expand
further from probable operations in Cuola, Sichuan.
The companies listed in the following chart supply to the international markets for lithium.
3.4 Lithium projects: new capacity growth
CRU estimates cumulative potential production from projects currently at various stages of
development to be in excess of 400 ktpa LCE, of which approximately 150 Ktpa LCE could be
in operation by 2020.
It is difficult to estimate the timing and the amount of capacity that will be added as there has
been a history of setbacks in delivering new capacity (and in some cases, maintaining and
utilizing existing capacity at optimal levels). For example, Orocobre initially announced the
completion of its large-scale Olaroz lithium brine mine in Argentina, in early 2014, but the
project has still not reached nameplate lithium carbonate production.
The lithium manufacturing industry is small in comparison to other natural resources industries
and undergoing unprecedented levels of growth. There is no well-defined manufacturing
process and new entrants lack the capabilities of the incumbents. Lithium in brines need to be
Data: CRU
36%
13%
8%
6%
7%
6%
6%
6%
6%
3%
3%
Production share (%)
Tianqi
SQM
Albemarle
Galaxy Resources & General Mining
Xizang Chengtou
FMC
Orocobre
Qinghai Guoan
Jinxin Mining
14. Lithium Industry Overview
CRU Consulting 12
upgraded through complex processes for export and sale as a solid-state product. Lithium as a
stand-alone element is highly unstable and highly reactive with air, making it challenging to
establish and maintain production capacity.
A significant amount of the latent lithium producing capacity and reserves are located in the
“golden triangle” of Chile, Argentina and Bolivia. Political and regulatory risks, could impact
supply from existing and new lithium mines in the region.
4. Lithium price considerations
The price of lithium carbonate has risen from 2005 due to the growth in LIB demand. Given the
higher costs involved in bringing new lithium projects to life, there was a gap between supply
and demand up until 2008. As a result, over this period, battery grade lithium carbonate prices
more than doubled to around US$6,000/t, but fell by 7.5%, to $US 5,658/t following the global
financial crisis (2009 to 2012). Battery grade lithium carbonate prices increased by 5% between
2012 and 2013, but since 2014 prices have almost doubled. This increase has been driven by
greater demand for LIBs for EVs, portable electronics and grid storage. The following chart
illustrates the historical lithium battery grade carbonate prices from 2005 to 2016.
Data: CRU
0
1000
2000
3000
4000
5000
6000
7000
8000
9000
2005 2006 2007 2008 2009 2010 2011 2012 2013 2014 2015 2016
Nominal, $/t
Lithium carbonate historical nominal prices
Lithium carbonate >99%