Libertad económica en el Mundo 2015
•
0 likes•417 views

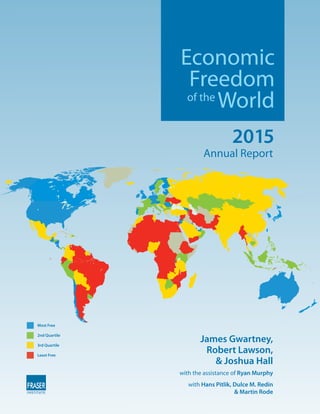
Informe del Fraser Institute sobre Libertad Económica para 2015.

Recommended
More Related Content
What's hot
What's hot (20)
Viewers also liked
Viewers also liked (17)
Similar to Libertad económica en el Mundo 2015
Similar to Libertad económica en el Mundo 2015 (20)
More from Ysrrael Camero
More from Ysrrael Camero (20)
Recently uploaded
Recently uploaded (20)
Libertad económica en el Mundo 2015
- 1. Economic Freedom of the World Annual Report Most Free 2nd Quartile 3rd Quartile Least Free 2015 James Gwartney, Robert Lawson, & Joshua Hall with the assistance of Ryan Murphy with Hans Pitlik, Dulce M. Redín & Martin Rode
- 3. EconomicFreedom oftheWorld 2015AnnualReport James Gwartney Robert Lawson Joshua Hall Florida State University Southern Methodist University West Virginia University with the assistance of Ryan Murphy Southern Methodist University with Hans Pitlik Dulce M. Redín Martin Rode Austrian Institute University of Navarra University of Navarra of Economic Research 2015
- 4. Fraser Institute ©2015 • www.fraserinstitute.org • www.freetheworld.com Copyright ©2015 by the Fraser Institute. All rights reserved. No part of this book may be reproduced in any manner whatsoever without written permission except in the case of brief quotations embodied in critical articles and reviews. The authors of this book have worked independently and opinions expressed by them are, therefore, their own and do not necessarily reflect the opinions of the supporters, directors, or staff of the Fraser Institute. This publication in no way implies that the Fraser Institute, its directors, or staff are in favor of, or oppose the passage of, any bill; or that they support or oppose any particular political party or candidate. Published in cooperation with the Economic Freedom Network Cover design by Bill Ray Printed and bound in Canada Data available to researchers The full data set, including all of the data published in this report as well as data omitted due to limited space, can be downloaded for free at <http://www.freetheworld.com>. The data file available there con- tains the most up-to-date and accurate data for the Economic Freedom of the World index. Some vari- able names and data sources have evolved over the years since the first publication in 1996; users should consult earlier editions of Economic Freedom of the World for details regarding sources and descriptions for those years. All editions of the report are available in PDF and can be downloaded for free from <http://www.freetheworld.com>. However, users are always strongly encouraged to use the data from this most recent data file as updates and corrections, even to earlier years’ data, do occur. Users doing long- term or longitudinal studies are encouraged to use the chain-linked index as it is the most consistent through time. If you have difficulty downloading the data, please contact Fred McMahon via e-mail to <freetheworld@fraserinstitute.org>. If you have technical questions about the data itself, please contact Joshua Hall <joshua.c.hall@gmail.com> or Robert Lawson <robert.a.lawson@gmail.com>. Please cite the data in your bibliography as: Authors: James Gwartney, Robert Lawson, and Joshua Hall Title: 2015 Economic Freedom Dataset, published in Economic Freedom of the World: 2015 Annual Report Publisher: Fraser Institute Year: 2015 URL: <http://www.freetheworld.com/datasets_efw.html> Cite this publication Authors: James Gwartney, Robert Lawson, and Joshua Hall Title: Economic Freedom of the World: 2015 Annual Report Publisher: Fraser Institute Date of publication: 2015 Digital copy available from <www.fraserinstitute.org> and <www.freetheworld.com> Publishing history See page 244 for a list of all volumes of Economic Freedom of the World and associated publications. Cataloguing Information Gwartney, James D. Economic freedom of the world … annual report / James D. Gwartney. Annual. Description based on: 1997 2015 issue by James Gwartney, Robert Lawson, and Joshua Hall, with the assistance of Ryan Murphy, and with Hans Pitlik, Dulce M. Redín, and Martin Rode. Issued also online. ISSN 1482-471X; ISBN 978-0-88975-363-1 (2015 edition). 1. Economic history--1990- --Periodicals. 2. Economic indicators--Periodicals. I. Fraser Institute (Vancouver, B.C.) II. Title
- 5. www.freetheworld.com • www.fraserinstitute.org • Fraser Institute ©2015 Table of Contents Executive Summary / v Chapter 1 Economic Freedom of the World in 2013 / 1 Chapter 2 Country Data Tables / 27 Chapter 3 Economic Freedom, Individual Perceptions of Life Control, and Life Satisfaction / 185 by Hans Pitlik, Dulce M. Redín, and Martin Rode Appendix Explanatory Notes and Data Sources / 203 About the Authors / 217 About the Contributors / 218 Acknowledgments / 219 The Economic Freedom Network / 220 Publishing History / 244
- 6. Fraser Institute ©2015 • www.fraserinstitute.org • www.freetheworld.com
- 7. Economic Freedom of the World: 2015 Annual Report • v www.freetheworld.com • www.fraserinstitute.org • Fraser Institute ©2015 Executive Summary Economic Freedom of the World The index published in Economic Freedom of the World measures the degree to which the policies and institutions of countries are supportive of economic freedom. The cornerstones of economic freedom are personal choice, voluntary exchange, free- dom to enter markets and compete, and security of the person and privately owned property. Forty-two data points are used to construct a summary index and to mea- sure the degree of economic freedom in five broad areas: 1 size of government: expenditures, taxes, and enterprises; 2 legal structure and security of property rights; 3 access to sound money; 4 freedom to trade internationally; and 5 regulation of credit, labor, and business. Since our first publication in 1996, numerous studies have used the data pub- lished in Economic Freedom of the World to examine the impact of economic free- dom on investment, economic growth, income levels, and poverty rates. Virtually without exception, these studies have found that countries with institutions and policies more consistent with economic freedom have higher investment rates, more rapid economic growth, higher income levels, and a more rapid reduction in poverty rates.1 The EFW index now ranks 157 countries and territories. The nations added this year are: Bhutan, Guinea, Libya, and the Seychelles. Data are available for just over 100 nations and territories back to 1980, and many back to 1970.2 This data set makes it possible for scholars to analyze the impact of both cross-country differ- ences in economic freedom and changes in that freedom across four decades. 1 For a review of the these studies, see: Hall, Joshua, and Robert Lawson (2014). Economic Freedom of the World: An Accounting of the Literature. Contemporary Economic Policy. <http://onlinelibrary.wiley.com/doi/10.1111/coep.12010/abstract>. 2 A comprehensive data set is available at <www.freetheworld.com>.
- 8. vi • Economic Freedom of the World: 2015 Annual Report Fraser Institute ©2015 • www.fraserinstitute.org • www.freetheworld.com Economic freedom around the world Average chain-linked rating The average chain-linked economic freedom rating for the 102 countries with con- tinuous ratings since 1980 has increased from 5.31 in 1980 to 5.77 in 1990 before jumping to 6.74 in 2000 and finally to 6.86 in 2013. The global average increased slightly this past year. Top-rated countries Hong Kong and Singapore, once again, occupy the top two positions. The other nationsinthetop10areNewZealand,Switzerland,UnitedArabEmirates,Mauritius, Jordan, Ireland, Canada, and the United Kingdom. Other major countries The rankings of some other major countries are the United States (16th), Japan (26th ), Germany (29th), South Korea (39th), Italy (68th), France (70th), Mexico (93st), Russia (99th), China (111th), India (114th), and Brazil (118th ). Lowest-rated countries The 10 lowest-rated countries are: Angola, Central African Republic, Zimbabwe, Algeria, Argentina, Syria, Chad, Libya, the Republic of Congo, and, in last place, Venezuela. Economic freedom and human progress • Nations that are economically free out-perform non-free nations in indicators of well-being. • Nations in the top quartile of economic freedom had an average per-capita GDP of $38,601 in 2013, compared to $6,986 for bottom quartile nations (2013, PPP constant 2011 US$) (exhibit 1.6). • In the top quartile, the average income of the poorest 10% was $9,881, compared to $1,629 in the bottom quartile in 2013 (2013 PPP constant 2011 US$) (exhibit 1.9). Interestingly, the average income of the poorest 10% in the most economically free nations is about 50% greater than the overall average income in the least free nations. • Life expectancy is 80.1 years in the top quartile compared to 63.1 years in the bottom quartile (exhibit 1.10). • Political and civil liberties are considerably higher in economically free nations than in unfree nations (exhibit 1.11). Chapter 1: Economic Freedom of the World in 2013 The authors of the report, James Gwartney, Robert Lawson, and Joshua Hall, pro- vide an overview of the report and discuss why economic freedom is important. They also analyze the decline of economic freedom in the United States and its potential consequences. They note that the 7.73 US chain-linked score in 2013 was more than 0.9 units lower than the 2000 rating. This decline in economic freedom
- 9. Economic Freedom of the World: 2015 Annual Report • vii www.freetheworld.com • www.fraserinstitute.org • Fraser Institute ©2015 is more than three times greater than the average decline in the OECD. It could cut the US historic growth rate of 3% by half. The decline in US scores has been concentrated in Area 4: Freedom to Trade Internationally, Area 5: Regulation, and Area 2: Legal System and Protection of Property Rights, where there has been a particularly large and alarming decline. Likely culprits are increased use of eminent domain to transfer property to powerful political interests, the ramifications of the wars on terrorism and drugs, and the violation of the property rights of bondhold- ers in the auto-bailout case. Chapter 2: Country Data Tables The chapter provides detailed historical information for each of the 157 countries and territories in the index. Chapter 3: Economic Freedom, Individual Perceptions of Life Control, and Life Satisfaction by Hans Pitlik, Dulce M. Redín, and Martin Rode. Happiness economics has shown that the degree to which people feel they are in control of their lives positively correlates with personal life satisfaction. In a parallel manner, economic freedom has been found to exert an independent impact on life satisfaction over and above the impact on per-capita income levels and other indi- cators of material well-being. In this chapter, the authors put both of these strands together and establish that economic freedom exerts a strong and persistent impact on both individual life control and life satisfaction. Employing data from the World Values Survey and the European Values Study, their findings show that living in a country with high overall economic freedom is a major determinant of perceived personal control over one’s life. Thus, the authors show that economic freedom has a direct positive influence on life satisfaction and also influences individual happi- ness by providing people with more control over their own lives.
- 10. Fraser Institute ©2015 • www.fraserinstitute.org • www.freetheworld.com
- 11. www.freetheworld.com • www.fraserinstitute.org • Fraser Institute ©2015 Chapter 1 Economic Freedom of theWorld in 2013 Nearly three decades have now passed since Milton and Rose Friedman joined Michael Walker and the Fraser Institute as the hosts of the initial conference designed to define and develop a measure of economic freedom. Six conferences focusing on this issue were held between 1986 and 1994. The index published in Economic Freedom of the World (EFW) was an outgrowth of this series of confer- ences. Approximately 60 scholars assisted with the development of the index, and dozens of others have contributed following the 1996 publication of the Economic Freedom of the World: 1975–1995 and the establishment of the Economic Freedom Network (Gwartney, Lawson, and Block, 1996). During the two decades following the initial EFW report, academic interest in the impact of economic and political institutions on the performance of econo- mies grew rapidly. There was a virtual explosion of scholarly literature in this area that is now known as the New Institutional Economics. We are delighted that the EFW measure has been widely used by scholars seeking to identify how economic institutions, along with other factors, influence various indicators of performance and quality of life. As work was going forward on the EFW project, Milton Friedman often reminded participants that our goal was to develop an accurate measure of eco- nomic freedom that would move the discussion from emotionally charged state- ments to scholarly research. At least to a modest degree, this has been the case. The EFW data have been used in nearly 500 scholarly articles to address a wide variety of issues. We are particularly proud of the fact that it has played a role in shifting the focus of scholarly research from subjective statements about what people think toward objective research examining the impact of economic freedom and other factors on various economic indicators. The concept of economic freedom The cornerstones of economic freedom are (1) personal choice, (2) voluntary exchange coordinated by markets, (3) freedom to enter and compete in mar- kets, and (4) protection of persons and their property from aggression by oth- ers. Economic freedom is present when individuals are permitted to choose for themselves and engage in voluntary transactions as long as they do not harm the person or property of others. Individuals have a right to their own time, talents, and resources, but they do not have a right to take things from others or demand
- 12. 2 • Economic Freedom of the World: 2015 Annual Report Fraser Institute ©2015 • www.fraserinstitute.org • www.freetheworld.com that others provide things for them. The use of violence, theft, fraud, and physi- cal invasions are not permissible in an economically free society, but otherwise, individuals are free to choose, trade, and cooperate with others, and compete as they see fit. In an economically free society, the primary role of government is to pro- tect individuals and their property from aggression by others. The EFW index is designed to measure the extent to which the institutions and policies of a nation are consistent with this protective function. Put another way, the EFW measure is an effort to identify how closely the institutions and policies of a country correspond with a limited government ideal, where the government protects property rights and arranges for the provision of a limited set of “public goods” such as national defense and access to money of sound value, but little beyond these core functions. In order to receive a high EFW rating, a country must provide secure protection of privately owned property, even-handed enforcement of contracts, and a stable monetary environment. It also must keep taxes low, refrain from creating barriers to both domestic and international trade, and rely more fully on markets rather than government spending and regulation to allocate goods and resources. In many ways, a country’s EFW summary rating is a measure of how closely its institutions and policies compare with the idealized structure implied by standard textbook analysis of microeconomics. The Economic Freedom of the World index for 2013 Accurate measurement of economic freedom has always been the sole objective of the Economic Freedom of the World project. In recent years, social scientists have focused on identification and measurement of the impact of economic, political, legal, and cultural factors on the growth and development of economies. The EFW data set provides the most comprehensive measure of the degree to which countries rely on voluntary exchange and market institutions to allocate resources. A quality measure of differences in economic freedom across countries and over time is essen- tial for the ongoing scholarly research in this important area. The EFW index now covers 157 countries with data available for approximately 100 countries back to 1980. This data set enables scholars to analyze the impact of both cross-country differences in economic freedom and changes in that freedom across a time frame of more than three decades. The EFW measure will also help scholars examine the contribution of economic institutions more thoroughly and better disentangle it from political, climatic, locational, cultural, and historical fac- tors as determinants of growth and development. The construction of the index published in Economic Freedom of the World is based on three important methodological principles. First, objective components are always preferred to those that involve surveys or value judgments. Given the multi-dimensional nature of economic freedom and the importance of legal and regulatory elements, it is sometimes necessary to use data based on surveys, expert panels, and generic case studies. To the fullest extent possible, however, the index uses objective components. Second, the data used to construct the index ratings are from external sources such as the International Monetary Fund, World Bank, and World Economic Forum that provide data for a large number of countries. Data pro- vided directly from a source within a country are rarely used. Importantly, the value
- 13. Chapter 1: Economic Freedom of the World in 2013 • 3 www.freetheworld.com • www.fraserinstitute.org • Fraser Institute ©2015 judgments of the authors or others in the Economic Freedom Network are never used to alter the raw data or the rating of any country. Third, transparency is present throughout. The report provides information about the data sources, the method- ology used to transform raw data into component ratings, and how the component ratings are used to construct both the area and summary ratings. Methodological details can be found in the Appendix: Explanatory Notes and Data Sources of this report. The entire data set used in the construction of the index is freely available to researchers at <freetheworld.com>. Structure of the EFW index Exhibit 1.1 indicates the structure of the EFW index. The index measures the degree of economic freedom present in five major areas: [1] Size of Government; [2] Legal System and Security of Property Rights; [3] Sound Money; [4] Freedom to Trade Internationally; [5] Regulation. Within the five major areas, there are 24 components in the index. Many of those components are themselves made up of several sub-components. In total, the index comprises 42 distinct variables. Each component and sub-component is placed on a scale from 0 to 10 that reflects the distribution of the underlying data. When sub- components are present, the sub-component ratings are averaged to derive the com- ponent rating. The component ratings within each area are then averaged to derive ratings for each of the five areas. In turn, the five area ratings are averaged to derive the summary rating for each country. The following section provides an overview of the five major areas. 1 Size of Government The four components of Area 1 indicate the extent to which countries rely on the political process to allocate resources and goods and services. When government spending increases relative to spending by individuals, households, and businesses, government decision-making is substituted for personal choice and economic free- dom is reduced. The first two components address this issue. Government con- sumptionasashareoftotalconsumption(1A)andtransfersandsubsidiesasashare of GDP (1B) are indicators of the size of government. When government consump- tion is a larger share of the total, political choice is substituted for personal choice. Similarly, when governments tax some people in order to provide transfers to others, they reduce the freedom of individuals to keep what they earn. The third component (1C) in this area measures the extent to which countries use private investment and enterprises rather than government investment and firms to direct resources. Governments and state-owned enterprises play by rules that are different from those to which private enterprises are subject. They are not dependent on consumers for their revenue or on investors for capital. They often operate in protected markets. Thus, economic freedom is reduced as government enterprises produce a larger share of total output. The fourth component (1D) is based on (1Di) the top marginal income tax rate and (1Dii) the top marginal income and payroll tax rate and the income threshold at which these rates begin to apply. These two sub-components are averaged to cal- culate the top marginal tax rate (1D). High marginal tax rates that apply at relatively low income levels are also indicative of reliance upon government. Such rates deny individuals the fruits of their labor. Thus, countries with high marginal tax rates and low income thresholds are rated lower.
- 14. 4 • Economic Freedom of the World: 2015 Annual Report Fraser Institute ©2015 • www.fraserinstitute.org • www.freetheworld.com Exhibit 1.1: Areas, Components, and Sub-components of the EFW Index 1. Size of Government A. Government consumption B. Transfers and subsidies C. Government enterprises and investment D. Top marginal tax rate (i) Top marginal income tax rate (ii) Top marginal income and payroll tax rate 2. Legal System and Property Rights A. Judicial independence B. Impartial courts C. Protection of property rights D. Military interference in rule of law and politics E. Integrity of the legal system F. Legal enforcement of contracts G. Regulatory costs of the sale of real property H. Reliability of police I. Business costs of crime 3. Sound Money A. Money growth B. Standard deviation of inflation C. Inflation: most recent year D. Freedom to own foreign currency bank accounts 4. Freedom to Trade Internationally A. Tariffs (i) Revenue from trade taxes (% of trade sector) (ii) Mean tariff rate (iii) Standard deviation of tariff rates B. Regulatory trade barriers (i) Non-tariff trade barriers (ii) Compliance costs of importing and exporting C. Black-market exchange rates D. Controls of the movement of capital and people (i) Foreign ownership / investment restrictions (ii) Capital controls (iii) Freedom of foreigners to visit 5. Regulation A. Credit market regulations (i) Ownership of banks (ii) Private sector credit (iii) Interest rate controls / negative real interest rates B. Labor market regulations (i) Hiring regulations and minimum wage (ii) Hiring and firing regulations (iii) Centralized collective bargaining (iv) Hours regulations (v) Mandated cost of worker dismissal (vi) Conscription C. Business regulations (i) Administrative requirements (ii) Bureaucracy costs (iii) Starting a business (iv) Extra payments / bribes / favoritism (v) Licensing restrictions (vi) Cost of tax compliance
- 15. Chapter 1: Economic Freedom of the World in 2013 • 5 www.freetheworld.com • www.fraserinstitute.org • Fraser Institute ©2015 Taken together, the four components of Area 1 measure the degree to which a country relies on personal choice and markets rather than government budgets and political decision-making. Therefore, countries with low levels of government spending as a share of the total, a smaller government enterprise sector, and lower marginal tax rates earn the highest ratings in this area. 2 Legal System and Property Rights Protection of persons and their rightfully acquired property is a central element of economic freedom and a civil society. Indeed, it is the most important function of government. Area 2 focuses on this issue. The key ingredients of a legal system consistent with economic freedom are rule of law, security of property rights, an independent and unbiased judiciary, and impartial and effective enforcement of the law. The nine components in this area are indicators of how effectively the pro- tective functions of government are performed. These components are from three primary sources: the International Country Risk Guide, the Global Competitiveness Report, and the World Bank’s Doing Business project. Security of property rights, protected by the rule of law, provides the founda- tion for both economic freedom and the efficient operation of markets. Freedom to exchange, for example, is meaningless if individuals do not have secure rights to property, including the fruits of their labor. When individuals and businesses lack confidence that contracts will be enforced and the fruits of their productive efforts protected, their incentive to engage in productive activity is eroded. Perhaps more than any other area, this area is essential for the efficient allocation of resources. Countries with major deficiencies in this area are unlikely to prosper regardless of their policies in the other four areas. 3 Sound Money Money oils the wheels of exchange. An absence of sound money undermines gains from trade. As Milton Friedman informed us long ago, inflation is a monetary phe- nomenon, caused by too much money chasing too few goods. High rates of mone- tary growth invariably lead to inflation. Similarly, when the rate of inflation increases, it also tends to become more volatile. High and volatile rates of inflation distort rela- tive prices, alter the fundamental terms of long-term contracts, and make it virtu- ally impossible for individuals and businesses to plan sensibly for the future. Sound money is essential to protect property rights and, thus, economic freedom. Inflation erodes the value of property held in monetary instruments. When governments finance their expenditures by creating money, they are, in effect, expropriating the property and violating the economic freedom of their citizens. The important thing is that individuals have access to sound money: who pro- vides it makes little difference. Thus, in addition to data on a country’s rate of infla- tion and its government’s monetary policy, it is important to consider how difficult it is to use alternative, more credible, currencies. If bankers can offer saving and checking accounts in other currencies or if citizens can open foreign bank accounts, then access to sound money is increased and economic freedom expanded. There are four components to the EFW index in Area 3. All of them are objec- tive and relatively easy to obtain and all have been included in the earlier editions of the index. The first three are designed to measure the consistency of monetary policy (or institutions) with long-term price stability. Component 3D is designed to measure the ease with which other currencies can be used via domestic and foreign
- 16. 6 • Economic Freedom of the World: 2015 Annual Report Fraser Institute ©2015 • www.fraserinstitute.org • www.freetheworld.com bank accounts. In order to earn a high rating in this area, a country must follow poli- cies and adopt institutions that lead to low (and stable) rates of inflation and avoid regulations that limit the ability to use alternative currencies. 4 Freedom to Trade Internationally In our modern world of high technology and low costs for communication and transportation, freedom of exchange across national boundaries is a key ingredient of economic freedom. Many goods and services are now either produced abroad or contain resources supplied from abroad. Voluntary exchange is a positive-sum activity: both trading partners gain and the pursuit of the gain provides the motiva- tion for the exchange. Thus, freedom to trade internationally also contributes sub- stantially to our modern living standards. At the urging of protectionist critics and special-interest groups, virtually all countries adopt trade restrictions of various types. Tariffs and quotas are obvious examples of roadblocks that limit international trade. Because they reduce the con- vertibility of currencies, controls on the exchange rate also hinder international trade. The volume of trade is also reduced if the passage of goods through customs is onerous and time consuming. Sometimes these delays are the result of administra- tive inefficiency while in other instances they reflect the actions of corrupt officials seeking to extract bribes. In both cases, economic freedom is reduced. The components in this area are designed to measure a wide variety of restraints that affect international exchange: tariffs, quotas, hidden administrative restraints, and controls on exchange rates and the movement of capital. In order to get a high rating in this area, a country must have low tariffs, easy clearance and efficient administration of customs, a freely convertible currency, and few controls on the movement of physical and human capital. 5 Regulation When regulations restrict entry into markets and interfere with the freedom to engage in voluntary exchange, they reduce economic freedom. The fifth area of the index focuses on regulatory restraints that limit the freedom of exchange in credit, labor, and product markets. The first component (5A) reflects conditions in the domestic credit market. Sub-component 5Ai provides evidence on the extent to which the banking industry is privately owned. The final two sub-components indi- cate the extent to which credit is supplied to the private sector and whether controls on interest rates interfere with the market in credit. Countries that use a private banking system to allocate credit to private parties and refrain from controlling interest rates receive higher ratings for this regulatory component. Many types of labor-market regulation infringe on the economic freedom of employees and employers. Among the more prominent are minimum wages, dis- missal regulations, centralized wage setting, extension of union contracts to non participating parties, and conscription. The labor-market component (5B) is designed to measure the extent to which these restraints upon economic freedom are present. In order to earn high marks in the component rating regulation of the labor market, a country must allow market forces to determine wages and establish the conditions of hiring and firing, and refrain from the use of conscription. Like the regulation of credit and labor markets, the regulation of business activi- ties (component 5C) inhibits economic freedom. The sub-components of 5C are
- 17. Chapter 1: Economic Freedom of the World in 2013 • 7 www.freetheworld.com • www.fraserinstitute.org • Fraser Institute ©2015 designed to identify the extent to which regulations and bureaucratic procedures restrain entry and reduce competition. In order to score high in this portion of the index, countries must allow markets to determine prices and refrain from regulatory activities that retard entry into business and increase the cost of producing prod- ucts. They also must refrain from “playing favorites,” that is, from using their power to extract financial payments and reward some businesses at the expense of others. Construction of Area and Summary ratings Theoryprovidesuswithsomedirectionregardingelementsthatshouldbeincluded in the five areas and the summary index, but it does not indicate what weights should be attached to the components within the areas or among the areas in the construction of the summary index. It would be nice if these factors were inde- pendent of each other and a weight could be attached to each of them. In the past, we investigated several methods of weighting the various components, including principle component analysis and a survey of economists. We have also invited others to use their own weighting structure if they believe that it is preferable. Our experience indicates that the summary index is not very sensitive to alternative weighting methods. Furthermore, there is reason to question whether the areas (and components) are independent or work together like the wheels, motor, transmission, driveshaft, and frame of a car. Just as these interconnected parts provide for the mobility of an automobile, it may be the combination of interrelated factors that brings about eco- nomic freedom. Which is more important for the mobility of an automobile: the motor, wheels, or transmission? The question cannot be easily answered because the parts work together. If any of these key parts break down, the car is immobile. Institutional quality may be much the same. If any of the key parts are absent, the overall effectiveness is undermined. As the result of these two considerations, we organize the elements of the index in a manner that seems sensible to us but we make no attempt to weight the com- ponents in any special way when deriving either area or summary ratings. Of course, thecomponentandsub-componentdataareavailabletoresearcherswhowouldlike to consider alternative weighting schemes and we encourage them to do so. Summary Economic Freedom Ratings for 2013 Exhibits 1.2a and 1.2b present the summary economic freedom ratings, sorted from highest to lowest, for the 157 countries of this year’s report. These ratings are for 2013, the most recent year for which comprehensive data are available. Hong Kong and Singapore, once again, occupy the top two positions. The other nations in the top 10 are New Zealand, Switzerland, United Arab Emirates, Mauritius, Jordan, Ireland, Canada, and the United Kingdom. The rankings of some other major countries are Australia (11th), the United States (16th), Japan (26th), Germany (29th), South Korea (tied for 39th), Italy (tied for 68th), France (tied for 70th), Mexico (93rd), Russia (99th), China (tied for 111th), India (114th), and Brazil (tied for 118th). The 10 lowest-rated countries are: Angola, Central African Republic, Zimbabwe, Algeria, Argentina, Syria, Chad, Libya, Republic of Congo, and, lastly, Venezuela.
- 18. 8 • Economic Freedom of the World: 2015 Annual Report Fraser Institute ©2015 • www.fraserinstitute.org • www.freetheworld.com Exhibit 1.2a: Summary Economic Freedom Ratings for 2013, First and Second Quartiles 0 2 4 6 8 10 Korea, South 39 Israel 39 Nicaragua 37 Bahamas 37 Portugal 35 Latvia 35 Rwanda 34 Guatemala 33 Kuwait 31 Austria 31 Netherlands 30 Germany 29 Norway 27 Luxembourg 27 Japan 26 Costa Rica 25 Bahrain 24 Estonia 22 Denmark 22 Malta 19 Lithuania 19 Finland 19 Armenia 18 Romania 17 United States 16 Taiwan 15 Qatar 13 Chile 13 Georgia 11 Australia 11 United Kingdom 10 Canada 9 Ireland 8 Jordan 7 Mauritius 6 United Arab Emirates 5 Switzerland 4 New Zealand 3 Singapore 2 Hong Kong 1 8.97 8.52 8.19 8.16 8.15 8.08 7.93 7.90 7.89 7.87 7.83 7.83 7.77 7.77 7.76 7.73 7.69 7.67 7.61 7.61 7.61 7.58 7.58 7.55 7.53 7.52 7.51 7.51 7.50 7.48 7.46 7.46 7.45 7.43 7.42 7.42 7.40 7.40 7.38 7.38 0 2 4 6 8 10 [spare] [spare] Bosnia & Herzegovina 78 Lebanon 76 Indonesia 76 Cyprus 75 Trinidad & Tobago 73 Seychelles 73 Papua New Guinea 72 Gambia, The 70 France 70 Italy 68 Botswana 68 Philippines 67 Kenya 66 Uruguay 62 Montenegro 62 Brunei Darussalam 62 Albania 62 Mongolia 60 Macedonia 60 Oman 59 Malaysia 58 Dominican Republic 57 Hungary 55 El Salvador 55 Kazakhstan 52 Cambodia 52 Belgium 52 Spain 49 Panama 49 Honduras 49 Slovak Republic 47 Poland 47 Uganda 46 Sweden 42 Jamaica 42 Czech Republic 42 Bulgaria 42 Peru 41 7.34 7.33 7.33 7.33 7.33 7.30 7.29 7.29 7.27 7.27 7.27 7.26 7.26 7.26 7.25 7.25 7.23 7.22 7.21 7.19 7.19 7.18 7.18 7.18 7.18 7.16 7.14 7.13 7.13 7.12 7.12 7.11 7.07 7.07 7.03 7.01 7.01 6.98
- 19. Chapter 1: Economic Freedom of the World in 2013 • 9 www.freetheworld.com • www.fraserinstitute.org • Fraser Institute ©2015 0 2 4 6 8 10 [spare] Lesotho 117 Tunisia 116 Bangladesh 115 India 114 Slovenia 111 Nigeria 111 China 111 Vietnam 109 Morocco 109 Bolivia 108 Nepal 106 Colombia 106 Sri Lanka 105 Thailand 103 Moldova 103 Belize 102 Serbia 101 Namibia 100 Russia 99 Madagascar 98 Kyrgyz Republic 97 South Africa 96 Suriname 95 Swaziland 93 Mexico 93 Tajikistan 92 Haiti 90 Barbados 90 Paraguay 89 Fiji 87 Bhutan 87 Iceland 85 Greece 85 Croatia 84 Turkey 82 Tanzania 82 Saudi Arabia 81 Zambia 79 Cape Verde 79 6.97 6.97 6.95 6.92 6.92 6.91 6.87 6.87 6.86 6.86 6.85 6.83 6.83 6.81 6.79 6.79 6.77 6.74 6.73 6.71 6.69 6.68 6.65 6.64 6.63 6.63 6.57 6.56 6.56 6.52 6.46 6.46 6.44 6.44 6.44 6.43 6.42 6.39 6.36 Exhibit 1.2b: Summary Economic Freedom Ratings for 2013, Third and Fourth Quartiles 0 2 4 6 8 10 Venezuela 157 Congo, Republic of 156 Libya 155 Chad 154 Syria 153 Argentina 151 Algeria 151 Zimbabwe 150 Central African Rep. 149 Angola 148 Iran 147 Myanmar 146 Guinea 145 Congo, Dem. Republic 144 Ethiopia 143 Togo 142 Gabon 141 Niger 139 Mauritania 139 Burundi 138 Mozambique 136 Malawi 136 Ecuador 135 Côte d’Ivoire 134 Benin 133 Sierra Leone 132 Burkina Faso 131 Guinea-Bissau 130 Ukraine 128 Ghana 128 Timor-Leste 127 Yemen, Republic 124 Pakistan 124 Guyana 124 Mali 123 Senegal 122 Egypt 118 Cameroon 118 Brazil 118 Azerbaijan 118 6.34 6.34 6.34 6.34 6.32 6.29 6.28 6.28 6.28 6.27 6.20 6.20 6.12 6.10 6.08 6.05 6.03 5.99 5.87 5.87 5.85 5.79 5.79 5.72 5.71 5.68 5.65 5.62 5.56 5.43 5.37 5.29 5.23 5.20 5.20 5.19 5.13 5.11 4.72 3.23
- 20. 10 • Economic Freedom of the World: 2015 Annual Report Fraser Institute ©2015 • www.fraserinstitute.org • www.freetheworld.com The EFW index is calculated back to 1970 as the availability of data allows; see the Country Data Tables in chapter 2 or our website, <freetheworld.com>, for infor- mation from past years. Because some data for earlier years may have been updated or corrected, researchers are always encouraged to use the data from the most recent annual report to assure the most reliable figures. Area Economic Freedom Ratings (and Rankings) for 2013 Exhibit 1.3 presents the ratings (and rankings) for each of the five areas of the index and for Components 5A, 5B, and 5C. A number of interesting patterns emerge from an analysis of these data. High-income industrial economies generally rank quite high for Legal System and Property Rights (Area 2), Sound Money (Area 3), and Freedom to Trade Internationally (Area 4). Their ratings were lower, however, for Size of Government (Area 1) and Regulation (Area 5). This was particularly true for western European countries. On the other hand, a number of developing nations have a small fiscal size of government but rate low in other areas and, as a result, have a low overall rating. The lesson from this is clear: a small fiscal size of government is insufficient to ensure economic freedom. The institutions of economic freedom, such as the rule of law and property rights, as well as sound money, trade openness, and sensible regula- tion are also required. Weakness in the rule of law and property rights is particularly pronounced in sub-Saharan Africa, among Islamic nations, and for several nations that were for- merly part of the Soviet bloc, though several countries in the latter group have made impressive strides toward improvement. Many nations in Latin America and Southeast Asia also score poorly for rule of law and property rights. The nations that rank poorly in this category also tend to score poorly in the trade and regulation areas, even though several have reasonably sized governments and sound money. The Chain-Linked Summary Index Through time, the index has become more comprehensive and the available data more complete. As a result, the number and composition of the components for many countries varies across time. This presents a problem similar to that con- fronted when calculating GDP or a price index over time when we know that the underlying bundle of goods and services is changing from one year to another. In order to correct for this problem and assure comparability across time, we have done the same thing that statisticians analyzing national income do: we have chain- linked the data. The base year for the chain-link index is 2000, and as a result the chain-link index is not available for any countries added since that year. Changes in a coun- try’s chain-linked index through time are based only on changes in components that were present in adjoining years. For example, the 2010 chain-linked rating is basedonthe2009ratingbutisadjustedbasedonthechangesintheunderlyingdata between 2009 and 2010 for those components that were present in both years. If the common components for a country in 2010 were the same as in 2009, then no adjustment was made to the country’s 2010 summary rating. However, if the 2010
- 21. Chapter 1: Economic Freedom of the World in 2013 • 11 www.freetheworld.com • www.fraserinstitute.org • Fraser Institute ©2015 Exhibit 1.3: Area Economic Freedom Ratings (Rankings) for 2013 Areas Components of Area 5 1 Size of Government 2 Legal System and Property Rights 3 Sound Money 4 Freedom to Trade Internationally 5 Regulation 5A Credit market regulations 5B Labor market regulations 5C Business regulations Rating (Rank) Rating (Rank) Rating (Rank) Rating (Rank) Rating (Rank) Rating (Rank) Rating (Rank) Rating (Rank) Albania 7.8 (21) 4.7 (108) 9.7 (12) 7.4 (66) 6.2 (135) 7.0 (134) 5.5 (115) 6.3 (98) Algeria 3.4 (156) 4.8 (99) 7.2 (110) 4.9 (151) 5.7 (146) 6.7 (138) 4.6 (137) 5.8 (131) Angola 5.3 (127) 3.2 (148) 6.7 (135) 5.9 (139) 5.7 (148) 8.7 (78) 2.6 (156) 5.6 (138) Argentina 6.1 (95) 4.0 (135) 6.3 (144) 3.8 (156) 5.8 (143) 7.5 (124) 4.9 (131) 5.1 (150) Armenia 7.9 (18) 5.6 (70) 9.2 (51) 8.1 (15) 7.6 (51) 9.5 (37) 6.4 (87) 6.8 (40) Australia 6.7 (68) 7.9 (15) 9.2 (47) 7.6 (55) 7.8 (37) 9.5 (30) 7.0 (62) 6.7 (44) Austria 4.9 (139) 8.0 (10) 9.6 (17) 7.7 (43) 7.2 (76) 9.1 (61) 6.1 (95) 6.3 (94) Azerbaijan 5.0 (133) 5.9 (56) 6.8 (132) 6.9 (99) 7.1 (82) 8.0 (107) 6.3 (88) 6.8 (39) Bahamas 8.1 (14) 6.7 (34) 7.1 (111) 6.5 (120) 8.6 (3) 8.7 (79) 8.4 (12) 8.8 Bahrain 6.7 (69) 6.3 (45) 8.7 (68) 7.7 (42) 8.4 (8) 9.5 (34) 8.3 (15) 7.4 (19) Bangladesh 8.9 (2) 3.0 (149) 6.8 (133) 6.6 (118) 6.9 (91) 7.9 (114) 7.2 (56) 5.7 (136) Barbados 6.9 (60) 6.4 (40) 7.0 (122) 7.4 (69) 6.5 (127) 6.0 (147) 7.2 (55) 6.2 (108) Belgium 3.9 (153) 7.1 (24) 9.8 (6) 7.9 (28) 7.6 (47) 9.5 (35) 7.0 (60) 6.2 (100) Belize 7.1 (52) 4.6 (111) 7.0 (116) 6.4 (126) 8.1 (18) 9.9 (10) 7.9 (26) 6.4 (70) Benin 6.2 (93) 4.2 (125) 7.1 (114) 5.8 (141) 7.0 (84) 9.3 (41) 5.7 (108) 6.1 (119) Bhutan 6.6 (73) 6.6 (35) 6.9 (127) 6.5 (119) 7.7 (42) 7.2 (127) 8.6 (8) 7.1 (29) Bolivia 6.3 (88) 4.5 (113) 8.4 (76) 7.4 (71) 6.0 (142) 9.0 (67) 4.5 (144) 4.6 (153) Bosnia&Herzegovina 5.3 (128) 5.8 (60) 8.6 (71) 7.5 (62) 7.7 (40) 9.5 (36) 7.2 (57) 6.3 (87) Botswana 6.5 (79) 6.0 (54) 8.4 (78) 6.8 (106) 7.9 (23) 9.3 (41) 7.6 (38) 6.8 (41) Brazil 6.8 (66) 4.9 (97) 8.1 (87) 6.9 (97) 5.0 (155) 6.9 (135) 4.4 (147) 3.6 (155) Brunei Darussalam 5.0 (136) 6.6 (36) 8.2 (84) 7.6 (53) 8.6 (6) 9.7 (18) 8.9 (4) 7.1 (27) Bulgaria 6.9 (61) 4.9 (94) 9.4 (36) 7.6 (46) 7.8 (33) 9.7 (16) 7.4 (49) 6.3 (95) Burkina Faso 5.7 (118) 3.9 (137) 7.0 (119) 6.5 (124) 7.5 (58) 8.7 (81) 7.3 (51) 6.3 (85) Burundi 4.4 (149) 3.4 (143) 7.9 (96) 5.9 (138) 7.6 (49) 8.3 (89) 7.7 (32) 6.7 (54) Cambodia 7.9 (19) 4.1 (128) 9.5 (34) 7.9 (27) 6.9 (90) 8.0 (106) 7.6 (41) 5.2 (148) Cameroon 8.0 (15) 4.1 (132) 7.0 (120) 6.0 (136) 6.7 (110) 7.1 (130) 7.3 (54) 5.6 (140) Canada 6.1 (98) 8.0 (11) 9.5 (33) 7.5 (58) 8.3 (9) 10.0 8.4 (13) 6.6 (62) Cape Verde 6.3 (87) 5.9 (57) 8.6 (73) 7.3 (79) 6.8 (105) 8.9 (73) 4.3 (149) 7.1 (30) Central African Rep. 7.5 (38) 2.1 (156) 6.9 (126) 4.6 (154) 5.4 (150) 7.9 (115) 2.8 (155) 5.7 (134) Chad 6.0 (107) 2.8 (150) 6.2 (146) 5.1 (150) 5.7 (147) 6.6 (141) 5.9 (98) 4.5 (154) Chile 7.5 (37) 7.0 (27) 9.0 (57) 8.1 (12) 7.2 (71) 9.2 (52) 5.5 (117) 6.9 (37) China 5.0 (135) 5.9 (59) 8.3 (81) 6.7 (109) 6.4 (132) 7.2 (129) 5.6 (110) 6.3 (92) Colombia 6.0 (105) 4.1 (127) 8.1 (88) 7.4 (76) 7.2 (74) 9.2 (56) 5.9 (100) 6.4 (77) Congo, Dem. Rep. 6.1 (103) 2.3 (155) 8.1 (89) 5.2 (148) 6.5 (122) 6.3 (143) 5.7 (109) 7.6 (10) Congo, Republic of 4.3 (150) 2.8 (152) 5.0 (155) 5.3 (145) 6.2 (137) 6.2 (146) 6.2 (91) 6.3 (91) Costa Rica 7.6 (33) 6.2 (46) 9.3 (43) 7.9 (22) 6.6 (118) 6.9 (136) 6.1 (92) 6.7 (48)
- 22. 12 • Economic Freedom of the World: 2015 Annual Report Fraser Institute ©2015 • www.fraserinstitute.org • www.freetheworld.com Exhibit 1.3 (continued): Area Economic Freedom Ratings (Rankings) for 2013 Areas Components of Area 5 1 Size of Government 2 Legal System and Property Rights 3 Sound Money 4 Freedom to Trade Internationally 5 Regulation 5A Credit market regulations 5B Labor market regulations 5C Business regulations Rating (Rank) Rating (Rank) Rating (Rank) Rating (Rank) Rating (Rank) Rating (Rank) Rating (Rank) Rating (Rank) Côte d’Ivoire 6.1 (100) 4.3 (121) 6.9 (129) 6.3 (128) 6.6 (121) 8.2 (94) 5.1 (128) 6.3 (90) Croatia 4.8 (141) 5.7 (67) 9.3 (46) 7.5 (61) 7.2 (69) 9.1 (65) 6.6 (77) 6.0 (125) Cyprus 7.0 (55) 6.4 (41) 7.3 (108) 7.5 (59) 7.0 (87) 8.4 (87) 6.1 (94) 6.4 (79) Czech Republic 5.8 (112) 6.1 (51) 9.5 (29) 7.6 (57) 7.7 (38) 9.6 (28) 8.1 (19) 5.5 (142) Denmark 3.8 (154) 8.1 (8) 9.8 (7) 8.2 (10) 8.1 (17) 9.9 (11) 7.3 (52) 7.1 (31) Dominican Republic 7.9 (17) 4.4 (118) 9.5 (28) 7.7 (40) 6.6 (112) 7.3 (126) 6.4 (86) 6.2 (103) Ecuador 5.2 (129) 4.5 (114) 6.8 (131) 7.1 (86) 6.4 (130) 9.3 (51) 4.3 (148) 5.6 (139) Egypt 6.9 (58) 4.2 (123) 8.9 (62) 6.5 (125) 5.2 (154) 4.0 (155) 5.0 (129) 6.4 (69) El Salvador 8.4 (11) 4.4 (117) 9.5 (27) 7.4 (65) 6.5 (125) 7.5 (122) 5.6 (111) 6.4 (80) Estonia 5.9 (108) 7.3 (22) 8.7 (66) 8.1 (13) 7.9 (29) 10.0 (9) 6.3 (89) 7.4 (16) Ethiopia 6.7 (70) 5.0 (92) 5.2 (154) 5.3 (147) 6.3 (133) 5.2 (151) 7.5 (44) 6.1 (111) Fiji 7.2 (44) 5.8 (63) 5.7 (151) 6.6 (115) 9.0 (2) 9.8 (14) 9.0 (3) 8.1 (3) Finland 4.4 (148) 8.8 9.6 (23) 7.8 (30) 7.4 (62) 9.5 (33) 5.2 (127) 7.5 (14) France 4.1 (152) 7.0 (26) 9.8 (9) 7.8 (32) 7.0 (89) 9.2 (53) 5.3 (124) 6.3 (89) Gabon 5.7 (115) 4.0 (134) 5.5 (153) 6.3 (129) 7.1 (81) 7.9 (113) 7.4 (48) 5.9 (127) Gambia, The 7.7 (26) 5.4 (80) 8.0 (94) 7.6 (45) 6.9 (94) 6.3 (143) 8.2 (18) 6.1 (113) Georgia 7.7 (30) 6.2 (48) 8.9 (61) 8.4 (6) 7.9 (26) 9.8 (15) 6.5 (82) 7.5 (13) Germany 5.3 (126) 7.8 (18) 9.6 (21) 7.7 (44) 7.1 (77) 8.3 (89) 6.5 (79) 6.6 (64) Ghana 5.5 (122) 5.2 (84) 7.1 (115) 6.6 (114) 6.6 (114) 7.6 (121) 5.9 (101) 6.3 (84) Greece 4.8 (140) 5.8 (62) 9.5 (25) 7.6 (52) 6.6 (120) 8.7 (80) 4.6 (138) 6.4 (78) Guatemala 8.5 (8) 4.4 (116) 9.5 (32) 8.1 (16) 6.8 (104) 9.1 (62) 4.7 (135) 6.5 (65) Guinea 6.4 (84) 3.7 (140) 6.0 (148) 5.1 (149) 6.9 (92) 10.0 5.3 (122) 5.4 (145) Guinea-Bissau 7.4 (43) 3.3 (145) 6.6 (137) 6.3 (130) 7.0 (86) 9.3 (50) 3.5 (153) 8.2 (2) Guyana 5.1 (130) 4.6 (112) 7.9 (98) 7.0 (90) 6.8 (102) 6.3 (143) 7.8 (31) 6.2 (105) Haiti 8.6 (7) 2.4 (154) 7.8 (101) 7.9 (25) 7.4 (59) 8.1 (102) 8.1 (20) 6.1 (117) Honduras 8.8 (3) 4.1 (131) 9.4 (40) 7.4 (68) 6.6 (111) 8.1 (101) 5.2 (126) 6.6 (61) Hong Kong 9.4 7.9 (14) 9.4 (41) 9.1 9.0 10.0 9.3 7.8 (8) Hungary 5.5 (123) 6.2 (50) 9.5 (30) 7.6 (47) 7.5 (56) 9.6 (26) 6.8 (72) 6.1 (120) Iceland 5.1 (131) 8.2 (7) 6.9 (124) 6.6 (117) 7.6 (44) 7.9 (112) 7.7 (35) 7.3 (21) India 7.5 (35) 5.3 (83) 6.7 (134) 6.1 (135) 6.5 (123) 6.6 (140) 6.8 (73) 6.2 (104) Indonesia 7.7 (27) 4.8 (101) 9.1 (54) 7.2 (85) 6.3 (134) 8.1 (100) 4.5 (142) 6.1 (115) Iran 6.1 (99) 5.2 (85) 7.0 (118) 4.1 (155) 4.7 (156) 3.9 (156) 4.6 (139) 5.7 (137) Ireland 5.6 (119) 8.0 (12) 9.7 (11) 8.5 (3) 7.7 (39) 8.0 (110) 7.9 (27) 7.2 (23) Israel 6.5 (81) 5.9 (58) 9.6 (22) 7.9 (24) 7.1 (83) 9.5 (29) 5.4 (119) 6.2 (102) Italy 5.4 (124) 5.7 (65) 9.8 (3) 7.5 (60) 7.2 (73) 9.4 (38) 6.6 (78) 5.5 (141) Jamaica 7.6 (31) 5.0 (90) 8.8 (65) 7.4 (73) 7.9 (24) 9.7 (19) 8.0 (23) 6.1 (118)
- 23. Chapter 1: Economic Freedom of the World in 2013 • 13 www.freetheworld.com • www.fraserinstitute.org • Fraser Institute ©2015 Exhibit 1.3 (continued): Area Economic Freedom Ratings (Rankings) for 2013 Areas Components of Area 5 1 Size of Government 2 Legal System and Property Rights 3 Sound Money 4 Freedom to Trade Internationally 5 Regulation 5A Credit market regulations 5B Labor market regulations 5C Business regulations Rating (Rank) Rating (Rank) Rating (Rank) Rating (Rank) Rating (Rank) Rating (Rank) Rating (Rank) Rating (Rank) Japan 5.0 (134) 7.6 (20) 9.8 (8) 7.6 (48) 7.5 (52) 8.1 (105) 8.3 (14) 6.3 (97) Jordan 8.1 (13) 6.3 (43) 9.4 (42) 7.9 (26) 7.9 (22) 8.2 (95) 8.4 (10) 7.2 (25) Kazakhstan 7.7 (29) 6.1 (53) 9.0 (58) 5.6 (143) 7.9 (28) 9.3 (41) 7.6 (36) 6.7 (50) Kenya 7.8 (22) 5.0 (89) 8.9 (63) 6.7 (111) 7.4 (61) 8.0 (108) 7.8 (29) 6.4 (74) Korea, South 6.9 (63) 6.2 (47) 9.6 (19) 7.4 (75) 6.9 (95) 9.3 (41) 4.5 (143) 6.7 (47) Kuwait 6.2 (92) 6.7 (33) 9.4 (39) 7.3 (80) 7.8 (35) 9.7 (19) 7.0 (61) 6.7 (57) Kyrgyz Republic 7.0 (53) 4.7 (103) 8.3 (80) 6.7 (112) 7.0 (88) 8.1 (99) 6.1 (93) 6.6 (58) Latvia 5.8 (110) 6.5 (38) 9.2 (52) 8.0 (17) 7.6 (50) 9.1 (59) 6.9 (67) 6.7 (53) Lebanon 8.2 (12) 4.0 (133) 9.6 (20) 6.9 (96) 6.2 (136) 5.0 (152) 7.9 (25) 5.8 (132) Lesotho 4.8 (142) 5.3 (81) 7.9 (97) 5.9 (137) 7.8 (34) 9.7 (19) 7.0 (63) 6.7 (51) Libya 4.8 (143) 2.6 (153) 5.9 (150) 5.5 (144) 6.8 (100) 10.0 6.9 (69) 3.5 (156) Lithuania 7.2 (49) 6.3 (44) 9.1 (53) 7.6 (56) 7.9 (27) 9.6 (24) 7.4 (50) 6.7 (45) Luxembourg 4.5 (146) 8.3 (5) 9.2 (50) 8.1 (11) 7.5 (57) 9.3 (41) 5.9 (103) 7.2 (24) Macedonia 6.3 (86) 5.5 (73) 8.3 (79) 7.6 (50) 8.1 (16) 9.4 (39) 7.6 (43) 7.4 (15) Madagascar 8.7 (4) 3.3 (147) 8.1 (92) 6.9 (98) 6.6 (117) 8.1 (104) 4.9 (130) 6.7 (46) Malawi 5.7 (117) 5.0 (87) 5.9 (149) 5.9 (140) 6.8 (97) 7.0 (131) 7.1 (58) 6.3 (88) Malaysia 6.5 (80) 6.9 (31) 6.6 (138) 7.7 (38) 8.3 (11) 9.5 (32) 8.0 (22) 7.4 (18) Mali 7.2 (45) 4.1 (130) 6.8 (130) 6.9 (100) 6.5 (126) 8.1 (103) 5.3 (125) 6.1 (121) Malta 5.7 (114) 7.0 (25) 9.5 (26) 8.0 (19) 7.8 (36) 9.3 (47) 7.5 (46) 6.5 (67) Mauritania 5.0 (138) 4.2 (124) 6.9 (125) 6.1 (133) 6.8 (106) 8.9 (72) 5.9 (105) 5.4 (143) Mauritius 7.9 (20) 6.5 (37) 9.7 (14) 8.5 (5) 7.8 (32) 9.2 (57) 7.6 (40) 6.7 (52) Mexico 7.1 (51) 4.4 (115) 8.1 (91) 7.2 (82) 7.1 (78) 9.4 (40) 5.8 (107) 6.2 (109) Moldova 6.5 (82) 5.0 (88) 7.6 (104) 7.0 (93) 7.1 (80) 9.7 (17) 5.5 (113) 6.1 (122) Mongolia 7.5 (36) 5.7 (66) 8.0 (93) 7.4 (72) 7.3 (65) 8.1 (97) 7.0 (65) 6.8 (43) Montenegro 7.2 (46) 5.6 (69) 8.5 (75) 7.8 (35) 6.8 (99) 6.7 (138) 7.3 (53) 6.4 (73) Morocco 5.8 (111) 6.1 (52) 7.3 (109) 7.0 (91) 6.1 (139) 7.0 (133) 4.5 (141) 6.8 (42) Mozambique 6.5 (76) 4.0 (136) 6.4 (141) 6.6 (113) 5.8 (144) 7.7 (117) 3.0 (154) 6.6 (59) Myanmar 6.7 (71) 3.3 (146) 6.4 (143) 5.7 (142) 5.8 (145) 5.8 (149) 6.5 (80) 5.0 (151) Namibia 6.2 (89) 6.2 (49) 6.5 (139) 6.8 (108) 7.7 (41) 8.9 (74) 8.0 (24) 6.1 (112) Nepal 8.7 (6) 4.3 (120) 6.4 (142) 6.5 (122) 6.9 (96) 8.3 (89) 5.9 (104) 6.3 (83) Netherlands 3.7 (155) 8.0 (9) 9.7 (15) 8.4 (8) 7.6 (43) 8.9 (71) 7.1 (59) 6.9 (36) New Zealand 5.6 (120) 8.8 (2) 9.5 (31) 8.4 (7) 8.6 (4) 9.9 (12) 8.7 (7) 7.3 (20) Nicaragua 8.5 (9) 4.7 (106) 8.6 (72) 7.8 (31) 7.4 (60) 9.6 (27) 6.4 (85) 6.3 (96) Niger 6.4 (85) 4.1 (129) 6.7 (136) 4.8 (153) 7.0 (85) 9.6 (23) 3.8 (152) 7.6 (11) Nigeria 6.9 (62) 3.4 (144) 7.6 (105) 7.0 (94) 7.4 (63) 9.1 (60) 8.2 (16) 4.8 (152) Norway 5.0 (132) 8.6 (3) 9.4 (37) 7.3 (77) 7.2 (70) 10.0 4.4 (145) 7.2 (22)
- 24. 14 • Economic Freedom of the World: 2015 Annual Report Fraser Institute ©2015 • www.fraserinstitute.org • www.freetheworld.com Exhibit 1.3 (continued): Area Economic Freedom Ratings (Rankings) for 2013 Areas Components of Area 5 1 Size of Government 2 Legal System and Property Rights 3 Sound Money 4 Freedom to Trade Internationally 5 Regulation 5A Credit market regulations 5B Labor market regulations 5C Business regulations Rating (Rank) Rating (Rank) Rating (Rank) Rating (Rank) Rating (Rank) Rating (Rank) Rating (Rank) Rating (Rank) Oman 4.6 (145) 7.4 (21) 8.0 (95) 8.0 (20) 8.2 (14) 10.0 7.5 (45) 7.0 (33) Pakistan 8.4 (10) 4.2 (126) 6.0 (147) 6.4 (127) 6.4 (129) 8.5 (83) 5.5 (114) 5.3 (146) Panama 6.5 (78) 5.4 (78) 9.0 (55) 8.5 (4) 6.9 (93) 8.8 (76) 5.5 (116) 6.4 (71) Papua New Guinea 7.5 (39) 4.7 (107) 7.6 (106) 7.5 (63) 8.3 (12) 8.4 (88) 8.7 (6) 7.7 (9) Paraguay 7.8 (25) 3.6 (141) 9.2 (48) 7.2 (83) 6.4 (131) 8.6 (82) 4.4 (146) 6.1 (110) Peru 7.5 (40) 4.7 (105) 9.3 (44) 7.7 (39) 7.5 (54) 9.7 (19) 6.9 (68) 6.0 (124) Philippines 8.7 (5) 4.9 (95) 6.9 (123) 7.6 (54) 7.6 (48) 9.3 (48) 6.8 (75) 6.7 (56) Poland 5.8 (113) 6.4 (42) 9.6 (18) 7.5 (64) 7.3 (66) 8.1 (98) 7.7 (34) 6.0 (126) Portugal 5.3 (125) 7.0 (28) 9.9 7.8 (36) 7.1 (79) 8.3 (93) 6.5 (81) 6.5 (66) Qatar 6.5 (75) 8.0 (13) 8.2 (86) 7.6 (51) 8.6 (5) 10.0 8.1 (21) 7.8 (7) Romania 7.5 (41) 5.7 (64) 9.5 (24) 7.8 (29) 7.8 (31) 9.6 (25) 7.5 (47) 6.4 (72) Russia 6.5 (77) 5.4 (77) 8.6 (70) 6.1 (134) 6.8 (101) 8.2 (96) 5.9 (102) 6.3 (99) Rwanda 5.9 (109) 6.9 (30) 9.0 (59) 7.2 (84) 8.1 (15) 8.5 (84) 8.4 (11) 7.5 (12) Saudi Arabia 5.0 (136) 7.2 (23) 7.9 (100) 6.8 (107) 7.9 (25) 9.0 (67) 7.6 (42) 7.1 (26) Senegal 7.0 (56) 4.6 (110) 7.1 (112) 6.9 (101) 6.1 (140) 8.4 (86) 4.0 (151) 5.7 (133) Serbia 6.8 (65) 4.8 (102) 7.8 (102) 7.2 (81) 6.7 (109) 7.3 (125) 6.8 (74) 5.9 (128) Seychelles 6.1 (94) 5.6 (68) 8.2 (83) 8.0 (18) 7.3 (64) 7.7 (118) 7.0 (64) 7.4 (17) Sierra Leone 6.8 (64) 4.3 (122) 7.4 (107) 6.7 (110) 5.2 (153) 3.7 (157) 5.9 (106) 6.1 (116) Singapore 7.8 (24) 8.3 (6) 9.2 (49) 8.8 (2) 8.5 (7) 10.0 7.6 (39) 7.8 (6) Slovak Republic 6.1 (96) 5.6 (72) 9.8 (5) 7.8 (34) 7.2 (72) 9.2 (55) 6.9 (66) 5.4 (144) Slovenia 4.4 (147) 6.0 (55) 8.4 (77) 7.3 (78) 6.1 (141) 6.3 (142) 5.9 (99) 5.9 (129) South Africa 5.5 (121) 5.8 (61) 8.2 (85) 7.0 (88) 7.2 (75) 8.9 (70) 6.1 (96) 6.4 (68) Spain 5.7 (116) 6.4 (39) 9.9 (2) 7.6 (49) 6.7 (107) 8.7 (77) 5.4 (118) 6.0 (123) Sri Lanka 7.9 (16) 4.9 (96) 7.0 (121) 6.2 (131) 6.8 (98) 7.7 (119) 6.4 (83) 6.4 (81) Suriname 6.2 (90) 4.4 (119) 9.5 (35) 6.6 (116) 7.2 (68) 8.0 (109) 7.8 (28) 5.9 (130) Swaziland 6.1 (97) 5.0 (91) 7.9 (99) 7.0 (89) 8.0 (21) 9.2 (54) 7.7 (33) 7.0 (34) Sweden 3.4 (157) 7.9 (16) 9.8 (4) 7.7 (37) 7.9 (30) 9.9 (13) 6.9 (71) 6.9 (38) Switzerland 7.7 (28) 8.3 (4) 9.7 (13) 7.1 (87) 8.1 (19) 9.3 (41) 7.8 (30) 7.1 (28) Syria 6.2 (91) 4.8 (98) 4.8 (156) 4.8 (152) 5.4 (151) 5.6 (150) 4.8 (134) 5.7 (135) Taiwan 7.2 (47) 6.8 (32) 9.6 (16) 7.7 (41) 7.5 (53) 9.0 (69) 6.7 (76) 6.9 (35) Tajikistan 6.6 (72) 5.1 (86) 9.3 (45) 6.5 (121) 6.6 (119) 8.5 (85) 4.9 (132) 6.4 (76) Tanzania 7.2 (48) 5.5 (75) 7.7 (103) 7.0 (92) 7.2 (67) 9.1 (63) 6.4 (84) 6.2 (101) Thailand 7.6 (34) 5.0 (93) 7.1 (113) 6.8 (105) 6.8 (103) 9.3 (49) 4.7 (136) 6.3 (86) Timor-Leste 4.2 (151) 3.5 (142) 8.7 (67) 7.4 (70) 7.5 (55) 9.5 (31) 6.9 (70) 6.2 (106) Togo 6.0 (104) 2.8 (151) 7.0 (117) 6.2 (132) 6.5 (124) 7.5 (123) 4.2 (150) 7.9 (5) Trinidad and Tobago 7.0 (54) 4.6 (109) 8.2 (82) 7.9 (21) 7.6 (46) 9.0 (66) 7.6 (37) 6.2 (107)
- 25. Chapter 1: Economic Freedom of the World in 2013 • 15 www.freetheworld.com • www.fraserinstitute.org • Fraser Institute ©2015 components were lower than those for 2009 for the components present in both years, then the country’s 2010 summary rating was adjusted downward proportion- ally to reflect this fact. Correspondingly, in cases where the ratings for the common components were higher in 2010 than for 2009, the country’s 2010 summary rat- ing was adjusted upward proportionally. The chain-linked ratings were constructed by repeating this procedure backward in time to 1970 and forward in time to 2013. The chain-linked methodology means that a country’s rating will change across time periods only when there is a change in ratings for components present during adjacent years. This is precisely what one would want when making comparisons across time periods. Average chain-linked economic freedom ratings Exhibit 1.4 shows the average chain-linked economic freedom rating for the 102 countries with continuous ratings since 1980. The average level of economic free- dom, as measured by this chain-linked EFW index, has increased from 5.31 in 1980 to5.77in1990beforejumpingto6.74in2000andfinallyto6.86in2013.Theglobal average increased slightly this past year. Exhibit 1.4 indicates that, on average, the world is more economically free today than it was three decades ago. However, most of the increase took place during the 1980s and 1990s. The 6.86 average rating for 2013 is only slightly higher than the 6.74 figure for 2000. The major factors contributing to the long-term increase in eco- nomic freedom were reductions in marginal income-tax rates, more stable monetary policy, a decline in the use of military conscription, and liberalization of trade policies. Exhibit 1.5 shows the chain-linked summary ratings for all years. Researchers conducting long-term studies should use the chain-linked data. Areas Components of Area 5 1 Size of Government 2 Legal System and Property Rights 3 Sound Money 4 Freedom to Trade Internationally 5 Regulation 5A Credit market regulations 5B Labor market regulations 5C Business regulations Rating (Rank) Rating (Rank) Rating (Rank) Rating (Rank) Rating (Rank) Rating (Rank) Rating (Rank) Rating (Rank) Tunisia 6.0 (106) 5.6 (71) 6.9 (128) 6.9 (95) 6.6 (116) 7.0 (132) 6.1 (97) 6.7 (55) Turkey 7.0 (57) 5.3 (82) 9.0 (56) 6.9 (102) 6.5 (128) 8.0 (111) 4.9 (133) 6.6 (63) Uganda 7.4 (42) 4.7 (104) 8.5 (74) 7.8 (33) 8.0 (20) 8.8 (75) 8.9 (5) 6.3 (82) Ukraine 6.8 (67) 4.8 (100) 6.5 (140) 6.8 (104) 6.2 (138) 6.8 (137) 5.4 (120) 6.3 (93) United Arab Emirates 7.8 (23) 7.8 (19) 8.6 (69) 8.3 (9) 8.3 (10) 8.3 (89) 8.6 (9) 8.0 (4) United Kingdom 6.1 (101) 7.8 (17) 9.7 (10) 8.1 (14) 7.6 (45) 7.6 (120) 8.2 (17) 7.1 (32) United States 6.6 (74) 7.0 (29) 9.4 (38) 7.4 (74) 8.3 (13) 9.1 (64) 9.0 (2) 6.7 (49) Uruguay 6.9 (59) 5.5 (76) 9.0 (60) 7.9 (23) 6.6 (113) 7.9 (116) 5.6 (112) 6.4 (75) Venezuela 4.7 (144) 2.0 (157) 2.7 (157) 3.2 (157) 3.5 (157) 4.8 (154) 2.3 (157) 3.5 (157) Vietnam 7.6 (32) 5.4 (79) 6.2 (145) 6.5 (123) 6.6 (115) 9.1 (58) 5.3 (123) 5.3 (147) Yemen, Republic 7.2 (50) 3.8 (139) 8.1 (90) 6.8 (103) 5.5 (149) 5.0 (152) 5.4 (121) 6.1 (114) Zambia 6.4 (83) 5.5 (74) 8.8 (64) 7.4 (67) 6.7 (108) 7.2 (128) 6.2 (90) 6.6 (60) Zimbabwe 6.1 (102) 3.9 (138) 5.6 (152) 5.3 (146) 5.2 (152) 6.0 (147) 4.6 (140) 5.1 (149) Exhibit 1.3 (continued): Area Economic Freedom Ratings (Rankings) for 2013
- 26. 16 • Economic Freedom of the World: 2015 Annual Report Fraser Institute ©2015 • www.fraserinstitute.org • www.freetheworld.com The declining economic freedom of the United States1 While economic freedom has generally risen globally since 1980, there has been a modest reversal of the trend since 2000. For example, the average rating for the origi- nalOECDnationshasfallenby0.26ofapointsince2000.Nowherehasthereversalof therisingtrendintheeconomicfreedombeenmoreevidentthanintheUnitedStates. Throughout the period from 1970 to 2000, the United States ranked as the world’s freest OECD nation (generally the third freest economy overall behind only Hong Kong and Singapore). The chain-linked summary rating of the United States in 2000 was8.65.By2005,theUSratinghadslippedto8.22.Theslidehascontinued.The7.73 chain-linkedratingoftheUnitedStatesin2013wasmorethan0.9ofaunitlowerthan the2000rating.Thus,thedeclineineconomicfreedomintheUnitedStateshasbeen more than three times greater than the average decline found in the OECD. The 0.9-point decline in the summary rating between 2000 and 2013 on the 10-point scale of the index may not sound like much, but scholarly work on this topic indicates that a one-point decline in the EFW rating is associated with a reduc- tion in the long-term growth of GDP of between 1.0 and 1.5 percentage points annually (Gwartney, Holcombe, and Lawson, 2006). This implies that, unless poli- cies undermining economic freedom are reversed, the future annual growth of the US economy will be only about half its historic average of 3%. What accounts for the US decline? While the US ratings and rankings have fallen in all five areas of the EFW index, the reductions have been largest in the Legal System and Protection of Property Rights (Area 2), Freedom to Trade Internationally (Area 4), and Regulation (Area 5). The plunge in Area 2 has been particularly alarming. In 2000, 9.23 was the Area 2 rating for the United States but by 2013 the US rating in this area had plummeted to 6.95. While it is difficult to pin- point the precise reason for this decline, it is clear that the increased use of eminent domain to transfer property to powerful political interests, the ramifications of the warsonterrorismanddrugs,andtheviolationofthepropertyrightsofbondholders in the auto-bailout case have weakened the US tradition of rule of law. These factors surely contributed to the sharp decline in the legal system area. 1 This section draws heavily from Lawson, 2015. Exhibit 1.4: Average Chain-linked EFW Rating for the 101 countries with ratings since 1980 0 1 2 3 4 5 6 7 8 9 10 201320122010200520001995199019851980 AverageChain-linkedEFWRating 5.31 5.38 5.77 6.35 6.74 6.84 6.83 6.866.83
- 27. Chapter 1: Economic Freedom of the World in 2013 • 17 www.freetheworld.com • www.fraserinstitute.org • Fraser Institute ©2015 Exhibit 1.5: Chain-linked summary ratings from 1970 to 2013 1970 1975 1980 1985 1990 1995 2000 2005 2006 2007 2008 2009 2010 2011 2012 2013 Albania 4.36 5.05 6.26 7.11 7.30 7.44 7.44 7.46 7.43 7.32 7.25 7.30 Algeria 3.82 3.60 3.43 4.06 4.69 5.25 5.35 5.14 4.95 4.97 4.76 4.56 4.61 4.67 Argentina 4.36 2.76 3.96 3.30 4.42 7.04 7.41 5.97 6.06 6.29 6.07 5.95 5.86 5.80 5.32 5.18 Australia 6.95 6.06 6.85 7.16 7.56 7.97 8.22 8.23 8.27 8.31 8.21 8.09 8.10 8.09 8.03 7.99 Austria 6.08 5.93 6.34 6.35 6.99 7.18 7.96 7.84 7.82 7.79 7.68 7.61 7.53 7.51 7.47 7.45 Bahamas 6.41 6.29 6.36 6.47 6.44 6.72 6.87 6.73 6.83 6.86 6.75 6.70 6.65 6.65 6.65 Bahrain 7.42 6.92 6.88 7.22 7.69 7.35 7.63 7.80 7.71 7.57 7.69 7.70 7.52 7.50 Bangladesh 3.03 3.38 3.68 4.57 5.49 6.01 6.17 6.31 6.29 6.30 6.52 6.52 6.50 6.42 6.51 Barbados 5.66 5.79 6.25 6.30 6.29 6.41 6.64 6.43 6.45 6.32 6.45 6.63 6.61 6.69 6.62 Belgium 7.49 6.85 7.11 7.08 7.40 7.36 7.89 7.54 7.52 7.55 7.47 7.43 7.47 7.44 7.41 7.39 Belize 5.70 5.43 6.11 6.87 6.52 6.83 6.67 6.81 6.79 6.53 6.45 6.45 6.48 6.48 Benin 5.14 4.89 5.16 4.83 5.39 5.67 5.91 5.88 5.74 5.86 5.84 5.82 5.60 5.79 Bolivia 4.01 3.44 5.43 6.61 6.98 6.36 6.41 6.17 6.12 6.34 6.39 6.36 6.45 6.49 Botswana 5.25 5.57 5.92 6.40 7.36 7.29 7.08 7.34 7.04 6.90 7.22 7.43 7.45 7.33 Brazil 5.11 4.07 3.84 3.28 4.50 4.73 6.00 6.30 6.30 6.28 6.39 6.40 6.55 6.59 6.56 6.36 Bulgaria 5.02 3.90 4.62 5.41 6.85 7.02 7.03 7.10 7.24 7.22 7.28 7.28 7.23 Burundi 3.88 3.99 4.42 4.63 3.94 4.73 4.87 5.24 5.26 4.84 5.25 5.02 5.16 5.16 5.79 Cameroon 5.62 5.73 5.81 5.68 5.84 6.14 6.07 5.99 5.92 6.06 6.56 6.58 6.63 6.59 Canada 7.91 7.12 7.68 7.78 8.15 8.12 8.37 8.23 8.22 8.18 8.13 8.09 8.05 7.98 8.01 8.00 Central African Republic 4.38 4.83 4.42 5.23 5.28 5.48 5.77 5.71 5.78 5.72 5.84 5.82 5.81 Chad 4.93 4.93 4.90 5.43 5.43 5.51 5.22 5.07 5.37 5.78 5.61 5.37 5.68 Chile 3.96 3.62 5.39 5.84 6.79 7.54 7.42 7.92 7.94 8.05 7.97 7.92 7.94 7.97 7.87 7.80 China 3.74 4.74 4.43 5.17 5.78 5.87 5.99 6.08 6.06 6.11 6.07 6.13 6.20 6.25 Colombia 5.28 4.84 4.74 5.22 5.07 5.59 5.52 5.76 5.92 6.12 6.08 6.29 6.33 6.40 6.39 6.36 Congo, Dem. Republic 4.31 3.71 2.76 3.84 3.22 3.51 3.97 4.88 5.38 5.49 5.45 5.53 5.61 5.58 5.54 5.80 Congo, Republic of 4.50 4.31 4.97 5.02 4.35 4.74 4.88 4.76 4.96 5.21 4.92 4.70 4.68 4.90 Costa Rica 5.92 5.07 5.03 6.64 6.97 7.52 7.66 7.86 7.67 7.46 7.47 7.41 7.71 7.67 7.63 Côte d’Ivoire 5.39 6.08 5.57 5.20 5.91 6.05 5.65 5.69 5.69 5.91 5.91 6.00 5.92 6.05 Croatia 5.05 6.35 6.77 6.85 6.94 7.06 7.09 6.97 7.21 7.24 7.21 Cyprus 5.80 5.53 5.53 6.04 6.41 6.66 7.66 7.61 7.77 7.73 7.58 7.60 7.53 7.38 6.94 Czech Republic 6.16 6.90 7.15 7.20 7.38 7.41 7.33 7.35 7.39 7.54 7.49 Denmark 6.83 6.23 6.38 6.52 7.25 7.73 8.07 7.94 7.97 7.96 7.87 7.64 7.75 7.69 7.55 7.63
- 28. 18 • Economic Freedom of the World: 2015 Annual Report Fraser Institute ©2015 • www.fraserinstitute.org • www.freetheworld.com Exhibit 1.5 (continued): Chain-linked summary ratings from 1970 to 2012 1970 1975 1980 1985 1990 1995 2000 2005 2006 2007 2008 2009 2010 2011 2012 2013 Dominican Republic 5.17 4.92 4.34 5.99 6.75 6.42 6.32 6.41 6.36 6.85 7.06 7.08 6.95 7.12 Ecuador 3.89 4.91 5.30 4.39 5.36 6.17 5.76 5.85 5.91 5.77 5.77 5.76 5.70 5.71 5.88 5.86 Egypt 3.59 4.40 4.86 4.60 5.99 6.80 6.58 6.74 6.95 6.78 6.68 6.79 6.61 6.57 6.62 El Salvador 4.46 4.19 4.69 7.47 7.69 7.67 7.79 7.87 7.76 7.53 7.43 7.36 7.41 7.47 Estonia 6.07 7.51 7.97 7.96 7.84 7.73 7.67 7.76 7.69 7.62 7.59 Fiji 5.27 5.57 5.97 5.72 6.11 6.23 6.63 6.46 6.47 6.51 6.39 6.36 6.47 6.38 6.21 Finland 6.81 6.15 6.64 6.92 7.23 7.50 8.03 7.87 7.88 7.91 7.80 7.69 7.73 7.81 7.75 7.62 France 6.63 5.93 6.09 5.99 7.07 7.00 7.51 7.36 7.37 7.56 7.48 7.47 7.43 7.34 7.27 7.17 Gabon 4.51 5.09 5.48 5.39 5.82 5.60 5.77 5.68 5.72 5.68 5.62 5.52 5.49 5.51 Germany 7.44 6.85 7.16 7.25 7.65 7.65 7.88 7.78 7.73 7.63 7.55 7.59 7.53 7.63 7.57 7.53 Ghana 3.64 3.05 3.20 5.06 5.53 5.66 6.48 6.97 7.00 6.88 7.02 6.67 6.55 6.22 6.31 Greece 6.31 5.84 5.74 5.12 5.97 6.46 6.93 7.33 7.25 7.20 6.88 6.74 6.75 6.64 6.64 6.82 Guatemala 5.98 6.46 5.87 4.68 5.62 6.96 6.57 7.15 7.35 7.38 6.96 7.16 7.24 7.26 7.22 7.38 Guinea-Bissau 2.98 3.17 4.07 4.83 5.04 4.75 4.79 5.18 5.40 5.46 5.69 5.75 Guyana 5.05 6.53 6.12 6.28 6.49 6.70 6.62 6.51 6.64 6.69 6.54 Haiti 6.57 5.81 5.66 5.64 6.95 6.94 6.92 6.88 7.05 7.16 6.86 6.99 6.82 7.21 Honduras 5.97 5.38 5.45 6.26 6.67 6.85 7.18 7.21 7.12 6.96 7.04 7.11 7.00 7.05 Hong Kong 8.70 8.72 9.03 8.64 8.60 9.15 8.86 8.95 8.96 9.03 9.07 9.00 8.86 8.82 8.88 8.87 Hungary 3.94 4.68 5.04 6.20 7.08 7.24 7.16 7.16 7.21 7.31 7.32 7.40 7.34 7.29 Iceland 6.13 4.40 5.25 5.53 6.95 7.69 8.04 8.11 8.02 7.86 7.05 6.63 6.41 6.74 6.82 6.85 India 5.35 4.49 5.34 5.01 5.05 5.80 6.34 6.90 6.73 6.78 6.69 6.64 6.59 6.79 6.78 6.61 Indonesia 4.54 5.20 5.05 6.13 6.50 6.62 6.07 6.64 6.72 6.77 6.75 6.78 7.05 7.07 7.05 7.17 Iran 5.81 5.65 3.37 3.84 4.40 4.32 5.87 6.49 6.39 6.32 6.36 6.47 6.42 6.05 5.43 5.66 Ireland 6.79 5.97 6.47 6.54 7.13 8.28 8.21 8.40 8.27 8.20 7.97 7.75 7.75 7.91 8.07 8.07 Israel 4.83 4.08 3.67 4.25 4.92 6.38 7.12 7.63 7.54 7.53 7.49 7.39 7.60 7.62 7.63 7.69 Italy 5.99 5.18 5.38 5.57 6.61 6.66 7.56 7.33 7.23 7.15 7.06 6.92 7.11 7.14 7.14 7.09 Jamaica 3.92 4.85 5.48 6.65 7.58 7.64 7.62 7.47 7.25 7.33 7.12 7.15 7.28 7.46 Japan 6.79 6.38 6.89 7.06 7.56 7.47 7.91 7.81 7.81 7.78 7.64 7.49 7.51 7.42 7.58 7.50 Jordan 5.31 5.35 5.74 5.85 6.51 7.45 7.58 7.52 7.66 7.50 7.53 7.75 7.75 7.84 7.91 Kenya 4.80 4.63 4.80 5.29 5.43 5.89 6.72 7.24 7.12 7.21 6.84 7.02 7.07 7.02 7.18 7.20 Korea, South 5.39 5.26 5.49 5.54 6.31 6.67 6.81 7.27 7.47 7.48 7.27 7.19 7.28 7.29 7.27 7.19 Kuwait 4.99 6.85 5.45 6.95 7.14 7.52 7.65 7.79 7.47 7.54 7.40 7.35 7.38 7.60
- 29. Chapter 1: Economic Freedom of the World in 2013 • 19 www.freetheworld.com • www.fraserinstitute.org • Fraser Institute ©2015 Exhibit 1.5 (continued): Chain-linked summary ratings from 1970 to 2012 1970 1975 1980 1985 1990 1995 2000 2005 2006 2007 2008 2009 2010 2011 2012 2013 Latvia 5.29 6.98 7.30 7.43 7.36 7.25 7.10 7.02 7.16 7.23 7.30 Lithuania 5.31 6.60 6.95 7.05 7.12 6.99 7.00 7.12 7.16 7.13 7.17 Luxembourg 7.48 7.63 7.51 7.83 7.80 7.94 8.03 7.72 7.71 7.76 7.77 7.66 7.58 7.55 7.52 7.63 Madagascar 4.00 4.58 4.48 4.60 5.96 5.89 5.95 6.29 6.23 6.35 6.56 6.38 6.66 6.85 Malawi 5.16 4.61 4.95 5.39 4.56 4.91 5.09 5.22 5.55 5.82 5.91 5.97 6.02 5.68 5.60 Malaysia 6.53 6.31 6.96 7.02 7.40 7.59 6.81 6.99 6.94 6.98 6.71 6.77 7.00 7.02 6.99 7.21 Mali 5.41 5.73 4.81 5.11 5.22 6.20 5.98 6.29 6.28 5.86 5.95 5.93 6.19 6.30 6.44 Malta 5.53 5.30 5.50 6.95 6.79 7.60 7.44 7.75 7.61 7.61 7.61 7.58 7.55 7.54 Mauritius 4.77 4.70 6.08 5.93 7.45 7.62 7.52 7.36 7.91 7.98 7.92 7.92 7.99 8.08 8.07 Mexico 6.45 5.76 5.13 4.61 6.13 6.43 6.49 6.81 6.88 6.77 6.70 6.59 6.69 6.70 6.73 6.77 Morocco 5.65 5.07 4.45 5.20 5.18 6.28 6.18 6.37 6.26 6.32 6.33 6.35 6.45 6.51 6.39 6.41 Myanmar 4.50 4.15 3.13 3.80 3.67 3.95 4.08 3.69 3.83 4.01 4.12 4.31 5.03 5.30 Namibia 5.11 6.16 6.23 6.51 6.28 6.63 6.62 6.61 6.51 6.26 6.50 6.54 Nepal 5.49 5.01 5.11 5.15 5.86 6.23 6.44 6.07 5.94 5.74 5.92 6.02 6.02 6.34 Netherlands 7.04 6.55 7.23 7.28 7.60 7.97 8.12 7.92 7.85 7.84 7.77 7.58 7.58 7.69 7.63 7.67 New Zealand 6.32 5.69 6.35 6.21 7.82 8.84 8.52 8.46 8.26 8.40 8.41 8.11 8.10 8.15 8.25 8.21 Nicaragua 3.68 1.78 2.75 5.71 6.73 6.89 7.05 7.05 6.86 6.82 6.93 7.06 7.12 7.07 Niger 4.53 4.97 5.05 4.24 5.33 5.42 5.58 5.59 5.60 5.68 5.92 6.05 5.80 5.89 Nigeria 3.55 3.36 3.25 3.68 3.31 3.76 5.30 6.08 6.49 6.33 6.02 5.83 6.11 6.33 6.22 6.38 Norway 5.94 5.58 5.79 6.47 7.14 7.57 7.28 7.70 7.58 7.70 7.60 7.46 7.43 7.47 7.49 7.48 Oman 6.78 6.34 6.99 7.54 7.43 7.48 7.76 7.65 7.65 7.58 7.49 7.60 7.49 Pakistan 4.20 3.54 4.30 4.91 4.87 5.67 5.53 5.87 5.93 5.89 5.72 5.95 5.98 6.02 5.95 5.97 Panama 6.68 5.56 6.13 6.45 7.45 7.55 7.60 7.56 7.63 7.32 7.33 7.25 7.16 7.22 7.31 Papua New Guinea 5.90 6.07 6.38 5.84 6.09 6.03 6.30 6.36 6.46 6.52 6.63 6.65 6.68 Paraguay 5.68 4.82 5.60 6.53 6.44 6.36 6.35 6.30 6.43 6.49 6.62 6.68 6.69 6.72 Peru 4.43 3.54 3.90 2.61 3.98 6.51 7.30 7.30 7.34 7.32 7.44 7.44 7.51 7.50 7.44 7.25 Philippines 5.29 5.22 5.33 5.07 5.79 7.30 6.97 7.00 7.03 6.92 6.82 6.78 7.09 7.27 6.83 7.07 Poland 3.46 3.55 5.36 6.66 6.90 6.96 6.90 7.00 7.13 7.09 7.21 7.30 7.28 Portugal 5.89 3.72 5.52 5.37 6.24 7.46 7.61 7.36 7.53 7.48 7.27 7.12 7.06 7.34 7.38 7.53 Romania 4.37 4.29 3.79 5.31 7.07 6.84 7.30 6.98 7.13 7.29 7.33 7.41 7.53 Russia 4.42 5.14 6.08 5.97 6.25 6.32 6.22 6.35 6.38 6.45 6.49 Rwanda 4.90 3.69 5.52 5.99 6.32 6.59 6.96 6.98 7.29 7.49 7.36 7.40
- 30. 20 • Economic Freedom of the World: 2015 Annual Report Fraser Institute ©2015 • www.fraserinstitute.org • www.freetheworld.com Exhibit 1.5 (continued): Chain-linked summary ratings from 1970 to 2012 1970 1975 1980 1985 1990 1995 2000 2005 2006 2007 2008 2009 2010 2011 2012 2013 Senegal 4.43 5.18 5.31 4.56 5.75 5.81 5.70 5.87 5.78 5.90 5.78 5.73 5.76 6.04 Sierra Leone 4.99 4.99 3.69 3.88 4.35 4.98 6.10 6.12 6.55 6.53 6.82 6.91 6.79 6.88 6.66 Singapore 7.61 7.41 7.76 8.00 8.59 8.90 8.61 8.73 8.64 8.65 8.62 8.60 8.53 8.53 8.41 8.39 Slovak Rep 5.40 6.72 7.66 7.58 7.63 7.61 7.37 7.44 7.45 7.35 7.31 Slovenia 5.17 6.75 6.94 7.03 7.02 7.07 7.04 6.55 6.56 6.56 6.43 South Africa 6.30 5.71 5.85 5.49 5.50 6.57 7.09 7.01 6.95 6.96 6.68 6.63 6.87 6.94 6.91 6.88 Spain 6.41 5.84 6.10 6.08 6.56 7.24 7.84 7.60 7.57 7.53 7.35 7.19 7.26 7.38 7.28 7.25 Sri Lanka 4.77 4.94 4.81 6.06 6.17 6.20 6.38 6.19 6.01 6.11 6.25 6.40 6.39 6.32 Sweden 5.49 5.34 5.66 6.45 6.99 7.32 7.72 7.60 7.56 7.54 7.50 7.49 7.61 7.60 7.51 7.43 Switzerland 7.59 7.60 8.14 8.30 8.30 8.32 8.76 8.36 8.36 8.36 8.18 8.22 8.23 8.22 8.18 8.15 Syria 3.95 4.18 3.30 3.06 3.52 4.21 5.13 5.60 5.40 5.67 5.47 5.65 5.73 5.88 5.17 4.85 Taiwan 6.66 5.83 6.58 6.84 7.26 7.37 7.42 7.66 7.72 7.67 7.63 7.54 7.74 7.75 7.72 7.84 Tanzania 4.41 3.19 3.65 3.47 3.87 5.43 5.98 6.36 6.39 6.39 6.28 6.33 6.54 6.60 6.47 6.67 Thailand 6.05 6.01 6.08 6.17 6.83 7.18 6.55 6.68 6.83 6.80 6.77 6.70 6.66 6.59 6.58 6.59 Togo 4.06 5.13 5.71 5.44 5.79 5.83 6.04 6.01 5.82 5.56 5.61 5.71 5.75 5.92 Trinidad and Tobago 4.58 4.85 4.82 5.54 7.32 7.47 7.14 7.25 7.26 7.15 7.08 6.99 7.00 6.90 7.09 Tunisia 4.54 4.57 4.82 4.60 5.32 5.73 6.17 6.02 6.42 6.34 6.29 6.27 6.06 6.01 6.00 5.83 Turkey 3.49 3.87 3.77 4.85 5.06 5.89 5.83 6.09 6.14 6.24 6.61 6.52 6.52 6.70 6.66 6.56 Uganda 3.14 2.82 2.86 5.15 6.81 7.26 7.44 7.55 7.54 7.46 7.56 7.37 7.45 7.53 Ukraine 3.40 4.58 5.74 5.88 5.84 5.80 5.80 5.87 6.12 6.24 6.13 United Arab Emirates 6.06 6.86 7.23 6.98 7.31 7.49 7.66 7.73 7.76 7.50 7.68 7.83 7.87 7.91 United Kingdom 5.99 5.93 6.57 7.54 8.09 8.23 8.61 8.38 8.25 8.13 7.96 7.95 7.91 7.92 7.94 7.98 United States 7.60 7.73 7.92 8.11 8.35 8.50 8.65 8.22 8.14 8.21 8.06 7.76 7.76 7.70 7.81 7.73 Uruguay 6.06 5.96 6.33 6.47 7.09 7.03 7.01 7.09 7.13 7.08 7.29 7.35 7.31 7.16 Venezuela 7.31 6.17 6.69 6.08 5.69 4.40 5.84 4.52 4.57 4.27 4.11 4.18 3.84 3.79 3.71 3.09 Zambia 4.00 4.60 3.54 3.09 4.76 6.80 7.25 7.51 7.64 7.64 7.64 7.68 7.57 7.59 7.42 Zimbabwe 4.55 4.49 4.81 5.81 4.57 2.88 2.92 3.20 4.51 4.35 4.38 4.89 4.96 5.14
- 31. Chapter 1: Economic Freedom of the World in 2013 • 21 www.freetheworld.com • www.fraserinstitute.org • Fraser Institute ©2015 Expanded use of regulation has also been an important contributing factor to the rating reductions of the United States. During the past decade, non-tariff trade barri- ers, restrictions on foreign investment, and business regulation have all grown exten- sively. The expanded use of regulation in the United States has resulted in sharp rating reductions for components such as independence of the judiciary, impartial- ity of the courts, and regulatory favoritism. To a large degree, the United States has experienced a significant move away from rule of law and toward a highly regulated, politicized, and heavily policed state. Looking at some of the components of Area 2 provides some insight. The declines in several of the components are quite remarkable. For example, the mea- sures for Judicial Independence (2A) and Impartial Courts (2B) have respectively fallen to values of 6.8 and 6.1 in 2013, down from 8.0 and 9.0 in 2000. Could the expanded use of secret Foreign Intelligence Surveillance Courts (FISA Courts), where government requests are rubber stamped nearly 100% of the time be respon- sible for this? Similarly, how much did the interference of the executive branch of the federal government in the bankruptcy proceedings of General Motors and Chrysler contribute to the decline? Component 2C (Property Rights) has fallen to 7.2 from 9.1. Could the cause be the Supreme Court’s notorious Kelo v. City of New London decision in 2005 that made it easier to condemn private property and transfer that property to politically connected private interests? And how about the expansion in civil asset forfeitures, in which the government can take your property without any proof of guilt, in pros- ecuting the war on drugs—was this a contributing factor? Could increasing envi- ronmental, safety, and health rules and new acts like Sarbanes-Oxley, Dodd-Frank, and the Affordable Care Act be seen as a threat to property rights? Component 2D (Military Interference in the Political Process) has fallen to 6.7 from 10. Could the growth of the political power of the military and military contractors (for example, Halliburton) be driving this? Or could the fact that local police officers now sport armored cars, assault rifles, and body armor and look more like soldiers at war than cops keeping the peace (Balko, 2013) be a factor? Could the nationalization of airport security by TSA agents be responsible? The answer to all these questions is likely to be “yes”. We will never know which of these vari- ous factors figure most prominently in the construction of these ratings. However, whatever the underlying causes, when multiple indicators from different sources each using very different methods arrive at the same conclusion, we should take the results very seriously. It is clear in the data that property rights and the rule of law are under attack in the United States. Economic freedom and human progress As is customary, this chapter concludes with some simple graphs illustrating rela- tionships between economic freedom and various other indicators of human and political progress. The graphs use the average of the chain-linked EFW index for the period from 1990 to 2013, breaking the data into four quartiles ordered from low to high. Because persistence is important and the impact of economic freedom will be felt over a lengthy time period, it is better to use the average rating over a fairly long time span rather than the current rating to observe the impact of economic freedom on performance.
- 32. 22 • Economic Freedom of the World: 2015 Annual Report Fraser Institute ©2015 • www.fraserinstitute.org • www.freetheworld.com The graphs begin with the data on the relationship between economic freedom and the level of per-capita GDP and economic growth. In recent years, numerous scholarly studies have analyzed these relationships in detail and, almost without exception, have found that countries with higher and improving economic free- dom grow more rapidly and achieve higher levels of per-capita GDP (see Hall and Lawson, 2014). Many of the relationships illustrated in the graphs below reflect the impact of economic freedom as it works through increasing economic growth. In other cases, the observed relationships may reflect the fact that some of the variables that influ- ence economic freedom may also influence political factors like trust, honesty in government, and protection of civil liberties. Thus, we are not necessarily arguing that there is a direct causal relation between economic freedom and the variables considered below. In other words, these graphics are no substitute for real, schol- arly investigation that controls for other factors. Nonetheless, we believe that the graphs provide some insights about the contrast between the nature and charac- teristics of market-oriented economies and those dominated by government regu- lation and planning. At the very least, these figures suggest potential fruitful areas for future research. References Balko, Radley (2013). Rise of the Warrior Cop: The Militarization of America’s Police Forces. PublicAffairs. Gwartney, James, Randall Holcombe, and Robert Lawson (2006). Institutions and the Impact of Investment on Economic Growth. Kyklos 59, 2: 255–273. Gwartney, James, Robert Lawson, and Walter Block (1996). Economic Freedom of the World: 1975–1995. Fraser Institute. Hall, Joshua, and Robert Lawson (2014). Economic Freedom of the World: An Accounting of the Literature. Contemporary Economic Policy 32, 1: 1–19. Lawson, Robert (2015). Economic Freedom in the United States and Other Countries. In Donald Boudreaux, ed., What America’s Decline in Economic Freedom Means for Entrepreneurship and Prosperity (Fraser Institute): 67–84.
- 33. Chapter 1: Economic Freedom of the World in 2013 • 23 www.freetheworld.com • www.fraserinstitute.org • Fraser Institute ©2015 Exhibit 1.6: Economic Freedom and Income per Capita 0 10,000 20,000 30,000 40,000 Most FreeSecondThirdLeast Free Countries with more economic freedom have substantially higher per-capita incomes. Note: Income = GDP per capita, (PPP constant 2011 US$), 2013. Sources: Fraser Institute, Economic Freedom of the World: 2014 Annual Report; World Bank, World Development Indicators. $6,986 $10,737 $18,414 GDPpercapita,2013 Economic Freedom Quartile $38,601 Exhibit 1.7: Economic Freedom and Economic Growth 0.0 0.5 1.0 1.5 2.0 2.5 3.0 3.5 Most FreeSecondThirdLeast Free Countries with more economic freedom tend to grow more rapidly. Note: The growth data were adjusted to control for the initial level of income. Sources: Fraser Institute, Economic Freedom of the World: 2014 Annual Report; World Bank, World Development Indicators. 1.17% 2.81% 2.75% Growthrate(%)ofGDPpercapita,1990–2013 Economic Freedom Quartile 3.27%
- 34. 24 • Economic Freedom of the World: 2015 Annual Report Fraser Institute ©2015 • www.fraserinstitute.org • www.freetheworld.com Exhibit 1.8: Economic Freedom and the Income Share of the Poorest 10% 0.0 0.5 1.0 1.5 2.0 2.5 3.0 Most FreeSecondThirdLeast Free The share of income earned by the poorest 10% of the population is unrelated to economic freedom. Sources: Fraser Institute, Economic Freedom of the World: 2014 Annual Report; World Bank, World Development Indicators. 2.51% 2.48% 2.28% IncomeShare(%),2000–2013 Economic Freedom Quartile 2.64% Exhibit 1.9: Economic Freedom and the Income Earned by the Poorest 10% 0 2,000 4,000 6,000 8,000 10,000 Most FreeSecondThirdLeast Free The amount of income, as opposed to the share, earned by the poorest 10% of the population is much higher in countries with higher economic freedom. Note: Annual income per capita of poorest 10% (PPP constant 2011 US$), 2013 Sources: Fraser Institute, Economic Freedom of the World: 2014 Annual Report; World Bank, World Development Indicators. $1,629 $2,596 $4,391 Annualincomepercapitaofpoorest10%,2013 Economic Freedom Quartile $9,881
- 35. Chapter 1: Economic Freedom of the World in 2013 • 25 www.freetheworld.com • www.fraserinstitute.org • Fraser Institute ©2015 Exhibit 1.10: Economic Freedom and Life Expectancy 0 10 20 30 40 50 60 70 80 90 Most FreeSecondThirdLeast Free Life expectancy is about 20 years longer in countries with the most economic freedom than in countries with the least. Sources: Fraser Institute, Economic Freedom of the World: 2014 Annual Report; World Bank, World Development Indicators. 63.1 70.7 72.6 Lifeexpectancyatbirth,total(years),2013 Economic Freedom Quartile 80.1 Exhibit 1.11: Economic Freedom and Political Rights and Civil Liberties 1 2 3 4 5 6 7 Most FreeSecondThirdLeast Free Greater economic freedom is associated with more political rights and civil liberties. Note: Political rights and civil liberties are measured on a scale from 1 to 7: 1 = the highest degree of political rights and civil liberties; 7 = the lowest. Sources: Fraser Institute, Economic Freedom of the World: 2014 Annual Report; Freedom House, Freedom in the World 2014. PoliticalRightsandCivilLiberties,2013 Economic Freedom Quartile Pol Civ PolCivPol CivPol Civ 4.5 4.4 3.0 3.0 2.7 2.8 1.6 1.6 1 2 3 4 5 6 7
- 36. 26 • Economic Freedom of the World: 2015 Annual Report Fraser Institute ©2015 • www.fraserinstitute.org • www.freetheworld.com Data available to researchers Thefulldataset,includingallofthedatapublishedinthisreportaswellasdataomit- tedduetolimitedspace,canbedownloadedforfreeat<http://www.freetheworld.com>. The data file available there contains the most up-to-date and accurate data for the Economic Freedom of the World index. Some variable names and data sources have evolvedovertheyearssincethefirstpublicationin1996;usersshouldconsultearlier editions of Economic Freedom of the World for details regarding sources and descrip- tionsforthoseyears.AlleditionsofthereportareavailableinPDFandcanbedown- loaded for free at <http://www.freetheworld.com>. However, users are always strongly encouragedtousethedatafromthismostrecentdatafileasupdatesandcorrections, eventoearlieryears’data,dooccur.Usersdoinglong-termorlongitudinalstudiesare encouraged to use the chain-linked index as it is the most consistent through time. If you have difficulty downloading the data, please contact Fred McMahon via e-mail to <freetheworld@fraserinstitute.org>. If you have technical questions about the data itself, please contact Joshua Hall <joshua.c.hall@gmail.com> or Robert Lawson <robert.a.lawson@gmail.com>. Please cite the data in your bibliography as: Authors James Gwartney, Robert Lawson, and Joshua Hall Title 2015 Economic Freedom Dataset, published in Economic Freedom of the World: 2015 Annual Report Publisher Fraser Institute Year 2015 URL <http://www.freetheworld.com/datasets_efw.html>. Published work using ratings from Economic Freedom of the World A list of published papers that have used the economic freedom ratings from Economic Freedom of the World is available on line at <http://www.freetheworld.com/ papers.html>. In most cases, a brief abstract of the article is provided. If you know of other papers current or forthcoming that should be included on this page, or have further information about any of these papers or authors, please write to <freetheworld@fraserinstitute.org>.
- 37. www.freetheworld.com • www.fraserinstitute.org • Fraser Institute ©2015 Chapter 2 Country DataTables This chapter presents detailed data on the components used in constructing the EFW index for the 157 jurisdictions included in this study. This year Bhutan, Guinea, Libya, and the Seychelles appear in the index for the first time. For each country for which data were available, we present the overall EFW index rating and the rank of that country for the years 1980, 1990, 2000, 2005, 2010, 2012, and 2013. Like all the ratings in the index, these are values out of 10; 10 is the highest possible rating and zero (0) is the lowest. A higher rating indicates a greater degree of economic freedom. Ratings are also available for many countries for 1970, 1975, 1985, 1995, 2001, 2002, 2003, 2004, 2006, 2007, 2008, 2009, and 2011 but these data are not shown in the tables because of limited space. See <www.freetheworld.com> for full data. In the following tables, the top row shows the country’s summary rating for each year and, in parentheses, its overall rank. In the rows below, titles on the left in bold face indicate the five areas of economic freedom that are combined to gener- ate an overall score. The cells to their right give the rating for that area for each year. Underneath each area title are the titles of the components and sub-components that are combined to generate that area’s score. In these rows are the scores for each year presented, where data are available. Shown in italic beside some scores are the actual data used to derive that particular component rating. For some countries, datafor other componentsforcertainyearsmaybereportedeventhoughtherewere insufficient data to compute area or summary ratings. A more complete description of each component, including the methodology used to calculate the ratings, can be found in the Appendix: Explanatory Notes and Data Sources (p. 203). For researchers Chain-linked data are not reported in the following tables but they are available on <www.freetheworld.com>. See chapter 1 for an explanation of the chain-linked method.
- 38. 28 • Economic Freedom of the World: 2015 Annual Report Fraser Institute ©2015 • www.fraserinstitute.org • www.freetheworld.com Albania 1980 1990 2000 2005 2010 2012 2013 Rating (Rank) Rating (Rank) Rating (Rank) Rating (Rank) Rating (Rank) Rating (Rank) Rating (Rank) Summary Ratings (Rank) 4.60 (90) 6.29 (76) 6.98 (66) 7.29 (48) 7.12 (67) 7.18 (62) Rating (Data) Rating (Data) Rating (Data) Rating (Data) Rating (Data) Rating (Data) Rating (Data) Area 1. Size of Government 4.19 7.63 8.04 7.74 8.06 7.82 A. Government consumption 7.70 (13.81) 4.87 (23.44) 9.10 (9.07) 8.99 (9.42) 8.09 (12.50) 8.15 (12.30) 8.17 (12.21) B. Transfers and subsidies 3.51 (24.30) 7.80 (8.57) 9.66 (1.73) 7.39 (10.09) 7.61 (9.27) 7.61 (9.27) C. Government enterprises and investment 6.00 (26.70) 8.00 (19.45) 7.00 (22.30) 8.00 (19.80) 7.00 (21.00) D. Top marginal tax rate 5.50 8.50 8.50 8.50 (i) Top marginal income tax rate 9.00 (25) 10.00 (10) 10.00 (10) 10.00 (10) (ii) Top marginal income and payroll tax rate 2.00 (51) 7.00 (32) 7.00 (32) 7.00 (32) Area 2. Legal System and Property Rights 5.21 4.77 4.80 5.36 4.56 4.67 A. Judicial independence 2.38 3.29 2.22 2.47 B. Impartial courts 4.31 2.66 4.51 3.23 3.27 C. Protection of property rights 3.36 4.05 3.08 2.96 D. Military interference in rule of law and politics 6.67 8.33 8.33 8.33 8.33 E. Integrity of the legal system 3.33 3.68 4.17 4.17 4.17 F. Legal enforcement of contracts 5.17 5.36 4.34 4.39 G. Regulatory costs of the sale of real property 8.06 5.46 5.73 6.33 H. Reliability of police 4.91 5.86 4.49 4.54 I. Business costs of crime 4.64 7.17 5.42 5.58 Area 3. Sound Money 6.54 7.40 9.64 9.73 9.71 9.72 A. Money growth 9.57 (2.16) 9.50 (2.50) 9.86 (0.71) 9.43 (-2.84) 9.67 (-1.67) B. Standard deviation of inflation 9.62 (0.95) 5.03 (12.43) 9.53 (1.16) 9.75 (0.62) 9.82 (0.46) 9.59 (1.03) C. Inflation: most recent year 10.00 (0.00) 9.99 (0.05) 9.53 (2.37) 9.29 (3.55) 9.59 (2.03) 9.61 (1.94) D. Freedom to own foreign currency bank accounts 0.00 0.00 5.00 10.00 10.00 10.00 10.00 Area 4. Freedom to Trade Internationally 5.88 6.33 7.25 7.03 7.45 A. Tariffs 6.11 8.24 8.45 8.62 8.62 (i) Revenue from trade taxes (% of trade sector) 5.14 (7.29) 8.14 (2.79) 8.57 (2.14) 8.57 (2.14) 8.57 (2.14) (ii) Mean tariff rate 5.14 (7.29) 8.74 (6.30) 9.00 (5.00) 9.24 (3.80) 9.24 (3.80) (iii) Standard deviation of tariff rates 6.60 (8.50) 7.83 (5.42) 7.78 (5.55) 8.04 (4.90) 8.04 (4.90) B. Regulatory trade barriers 4.89 6.86 6.28 5.95 (i) Non-tariff trade barriers 4.41 6.28 5.11 4.46 (ii) Compliance costs of importing and exporting 5.36 7.45 7.45 7.45 C. Black-market exchange rates 0.00 0.00 10.00 10.00 10.00 10.00 10.00 D. Controls of the movement of capital and people 0.00 0.00 1.54 2.19 3.68 3.22 5.23 (i) Foreign ownership / investment restrictions 5.02 6.41 5.03 4.78 (ii) Capital controls 0.00 0.00 1.54 1.54 4.62 4.62 4.62 (iii) Freedom of foreigners to visit 0.00 0.00 0.00 6.29 Area 5. Regulation 2.47 5.75 6.10 6.38 6.23 6.24 A. Credit market regulations 0.00 5.36 7.51 7.04 7.06 6.98 (i) Ownership of banks 0.00 2.00 5.00 5.00 5.00 5.00 (ii) Private sector credit 5.08 8.53 6.12 6.17 5.94 (iii) Interest rate controls / negative real interest rates) 0.00 9.00 9.00 10.00 10.00 10.00 B. Labor market regulations 5.97 5.97 5.67 5.48 (i) Hiring regulations and minimum wage 5.60 5.57 5.57 5.57 (ii) Hiring and firing regulations 6.69 6.11 5.68 4.81 (iii) Centralized collective bargaining 7.74 6.86 5.45 5.20 (iv) Hours regulations 8.00 8.00 8.00 8.00 (v) Mandated cost of worker dismissal 4.81 6.30 6.30 6.30 (vi) Conscription 0.00 0.00 10.00 3.00 3.00 3.00 3.00 C. Business regulations 4.82 6.12 5.98 6.25 (i) Administrative requirements 2.66 5.68 4.85 4.94 (ii) Bureaucracy costs 0.99 6.04 6.04 6.04 (iii) Starting a business 8.40 9.54 9.63 9.75 (iv) Extra payments / bribes / favoritism 4.94 4.78 3.36 3.59 (v) Licensing restrictions 4.63 4.83 7.19 (vi) Cost of tax compliance 7.31 5.84 6.00 6.00
- 39. Chapter 2: Country Data Tables • 29 www.freetheworld.com • www.fraserinstitute.org • Fraser Institute ©2015 Algeria 1980 1990 2000 2005 2010 2012 2013 Rating (Rank) Rating (Rank) Rating (Rank) Rating (Rank) Rating (Rank) Rating (Rank) Rating (Rank) Summary Ratings (Rank) 3.97 (89) 3.45 (107) 4.66 (117) 5.74 (126) 5.21 (148) 5.14 (149) 5.20 (151) Rating (Data) Rating (Data) Rating (Data) Rating (Data) Rating (Data) Rating (Data) Rating (Data) Area 1. Size of Government 4.32 4.60 5.65 4.84 3.38 3.23 3.42 A. Government consumption 4.65 (24.19) 5.19 (22.35) 4.53 (24.60) 3.90 (26.74) 1.94 (33.40) 0.62 (37.90) 1.38 (35.30) B. Transfers and subsidies 8.41 (6.32) 8.63 (5.52) 8.19 (7.14) 7.82 (8.51) 7.82 (8.51) C. Government enterprises and investment 4.00 (32.50) 4.00 (30.40) 4.00 (37.80) 2.00 (48.40) 0.00 (61.26) 0.00 (61.26) 0.00 (61.26) D. Top marginal tax rate 4.50 4.50 (i) Top marginal income tax rate 7.00 (35) 7.00 (35) (ii) Top marginal income and payroll tax rate 2.00 (53) 2.00 (53) Area 2. Legal System and Property Rights 3.77 3.50 2.39 5.32 4.44 4.53 4.80 A. Judicial independence 4.57 2.54 3.69 4.10 B. Impartial courts 3.84 5.11 3.28 2.81 3.40 C. Protection of property rights 5.80 3.47 3.71 4.54 D. Military interference in rule of law and politics 0.00 5.00 5.00 5.00 5.00 E. Integrity of the legal system 3.33 5.00 5.00 5.00 5.00 F. Legal enforcement of contracts 4.39 4.39 4.39 4.39 G. Regulatory costs of the sale of real property 6.57 6.76 6.48 6.63 H. Reliability of police 6.89 4.56 4.58 5.12 I. Business costs of crime 4.58 4.94 5.10 4.98 Area 3. Sound Money 5.23 4.50 7.00 7.51 7.17 7.00 7.20 A. Money growth 8.35 (8.24) 9.35 (3.25) 7.95 (10.26) 7.84 (10.81) 8.35 (8.25) 9.17 (4.15) 8.92 (5.42) B. Standard deviation of inflation 7.70 (5.75) 5.53 (11.17) 5.14 (12.16) 7.52 (6.20) 6.13 (9.67) 5.60 (11.01) 5.53 (11.16) C. Inflation: most recent year 4.87 (25.66) 3.12 (34.40) 9.93 (0.34) 9.67 (1.64) 9.22 (3.91) 8.22 (8.89) 9.35 (3.25) D. Freedom to own foreign currency bank accounts 0.00 0.00 5.00 5.00 5.00 5.00 5.00 Area 4. Freedom to Trade Internationally 2.55 1.69 4.80 5.98 5.75 5.31 4.87 A. Tariffs 7.66 5.08 4.95 6.95 6.76 6.86 6.86 (i) Revenue from trade taxes (% of trade sector) 6.36 (5.46) 8.21 (2.69) 8.16 (2.76) 8.48 (2.28) 8.48 (2.28) (ii) Mean tariff rate 7.66 (11.70) 5.08 (24.60) 6.36 (5.46) 6.84 (15.80) 6.28 (18.60) 6.28 (18.60) 6.28 (18.60) (iii) Standard deviation of tariff rates 3.40 (16.50) 5.81 (10.47) 5.83 (10.42) 5.83 (10.42) 5.83 (10.42) B. Regulatory trade barriers 6.35 5.89 5.55 5.81 (i) Non-tariff trade barriers 5.16 4.73 4.05 4.51 (ii) Compliance costs of importing and exporting 7.53 7.05 7.05 7.12 C. Black-market exchange rates 0.00 0.00 7.78 7.93 8.57 7.20 5.27 D. Controls of the movement of capital and people 0.00 0.00 1.67 2.69 1.79 1.61 1.54 (i) Foreign ownership / investment restrictions 6.07 4.27 3.73 3.79 (ii) Capital controls 0.00 0.00 1.67 0.91 0.00 0.00 0.00 (iii) Freedom of foreigners to visit 1.10 1.11 1.11 0.84 Area 5. Regulation 2.93 3.45 5.06 5.33 5.62 5.70 A. Credit Market regulations 0.00 0.87 2.26 4.45 5.67 6.65 6.67 (i) Ownership of banks 0.00 0.00 0.00 0.00 0.00 0.00 0.00 (ii) Private sector credit 1.74 1.78 3.34 10.00 9.94 10.00 (iii) Interest rate controls (negative real interest rates) 5.00 10.00 7.00 10.00 10.00 B. Labor Market regulations 5.16 4.99 4.79 4.63 (i) Hiring regulations and minimum wage 5.60 5.57 5.57 5.57 (ii) Hiring and firing regulations 4.35 4.74 2.76 3.47 (iii) Centralized collective bargaining 5.59 4.91 5.69 5.98 (iv) Hours regulations 6.00 6.00 6.00 4.00 (v) Mandated cost of worker dismissal 8.42 7.76 7.76 7.76 (vi) Conscription 5.00 1.00 1.00 1.00 1.00 1.00 1.00 C. Business regulations 5.58 5.34 5.42 5.80 (i) Administrative requirements 3.31 2.10 2.51 3.42 (ii) Bureaucracy costs 3.74 6.52 6.52 6.52 (iii) Starting a business 8.94 8.97 8.98 9.10 (iv) Extra payments / bribes / favoritism 5.66 3.20 2.71 3.21 (v) Licensing restrictions 6.90 6.29 6.88 7.59 (vi) Cost of tax compliance 4.94 4.94 4.94 4.94
- 40. 30 • Economic Freedom of the World: 2015 Annual Report Fraser Institute ©2015 • www.fraserinstitute.org • www.freetheworld.com Angola 1980 1990 2000 2005 2010 2012 2013 Rating (Rank) Rating (Rank) Rating (Rank) Rating (Rank) Rating (Rank) Rating (Rank) Rating (Rank) Summary Ratings (Rank) 3.81 (140) 5.37 (146) 5.36 (143) 5.37 (148) Rating (Data) Rating (Data) Rating (Data) Rating (Data) Rating (Data) Rating (Data) Rating (Data) Area 1. Size of Government 3.72 5.37 4.93 5.34 A. Government consumption 2.59 (31.20) 4.03 (26.30) 1.82 (33.80) 3.44 (28.30) B. Transfers and subsidies 8.58 (5.71) 7.96 (7.98) 8.40 (6.36) 8.40 (6.36) C. Government enterprises and investment 0.00 (62.50) 0.00 (79.40) 0.00 (82.40) 0.00 (81.60) D. Top marginal tax rate 9.50 9.50 9.50 (i) Top marginal income tax rate 10.00 (17) 10.00 (17) 10.00 (17) (ii) Top marginal income and payroll tax rate 9.00 (25) 9.00 (25) 9.00 (25) Area 2. Legal System and Property Rights 3.15 3.74 3.37 3.21 A. Judicial independence 3.08 2.36 2.40 1.84 B. Impartial courts 2.92 2.51 2.46 1.97 C. Protection of property rights 4.11 2.85 2.94 2.51 D. Military interference in rule of law and politics 3.33 3.33 3.33 3.33 E. Integrity of the legal system 5.00 5.00 4.17 4.17 F. Legal enforcement of contracts 2.30 2.30 2.30 2.30 G. Regulatory costs of the sale of real property 1.35 5.47 5.40 5.42 H. Reliability of police 3.84 4.23 3.29 3.02 I. Business costs of crime 2.40 5.62 3.99 4.29 Area 3. Sound Money 1.26 5.57 6.56 6.72 A. Money growth 0.00 (53.88) 5.12 (24.41) 8.84 (5.79) 9.00 (5.01) B. Standard deviation of inflation 0.00 (40.17) 5.06 (12.36) 4.45 (13.88) 4.64 (13.41) C. Inflation: most recent year 5.05 (24.76) 7.11 (14.47) 7.94 (10.29) 8.24 (8.78) D. Freedom to own foreign currency bank accounts 0.00 5.00 5.00 5.00 Area 4. Freedom to Trade Internationally 6.22 6.19 6.14 5.93 A. Tariffs 8.39 8.24 8.32 8.32 (i) Revenue from trade taxes (% of trade sector) 9.35 (0.97) 8.89 (1.67) 9.09 (1.36) 9.09 (1.36) (ii) Mean tariff rate 8.48 (7.60) 8.54 (7.30) 8.54 (7.30) 8.54 (7.30) (iii) Standard deviation of tariff rates 7.35 (6.62) 7.28 (6.79) 7.31 (6.72) 7.31 (6.72) B. Regulatory trade barriers 4.02 4.02 4.34 3.63 (i) Non-tariff trade barriers 6.67 4.71 4.56 3.13 (ii) Compliance costs of importing and exporting 1.38 3.33 4.13 4.13 C. Black-market exchange rates 10.00 10.00 10.00 10.00 D. Controls of the movement of capital and people 2.46 2.50 1.91 1.78 (i) Foreign ownership / investment restrictions 5.83 5.20 3.42 2.95 (ii) Capital controls 1.54 2.31 2.31 2.31 (iii) Freedom of foreigners to visit 0.00 0.00 0.00 0.08 Area 5. Regulation 4.70 5.96 5.81 5.67 A. Credit Market regulations 6.67 8.67 9.00 8.73 (i) Ownership of banks 5.00 8.00 8.00 8.00 (ii) Private sector credit 10.00 10.00 10.00 9.19 (iii) Interest rate controls (negative real interest rates) 5.00 8.00 9.00 9.00 B. Labor Market regulations 3.99 4.01 2.77 2.63 (i) Hiring regulations and minimum wage 3.30 3.33 3.33 3.33 (ii) Hiring and firing regulations 4.39 4.17 3.19 2.66 (iii) Centralized collective bargaining 7.62 6.28 5.47 5.17 (iv) Hours regulations 4.00 4.00 4.00 4.00 (v) Mandated cost of worker dismissal 4.62 6.26 0.65 0.65 (vi) Conscription 0.00 0.00 0.00 0.00 C. Business regulations 3.46 5.21 5.67 5.64 (i) Administrative requirements 2.17 1.76 2.94 2.76 (ii) Bureaucracy costs 0.46 7.94 7.94 7.94 (iii) Starting a business 3.09 6.49 6.45 6.52 (iv) Extra payments / bribes / favoritism 4.88 2.89 2.30 2.17 (v) Licensing restrictions 3.18 5.36 7.54 7.61 (vi) Cost of tax compliance 6.95 6.84 6.84 6.84