Downloaded 30 times


![www.alec.org 13
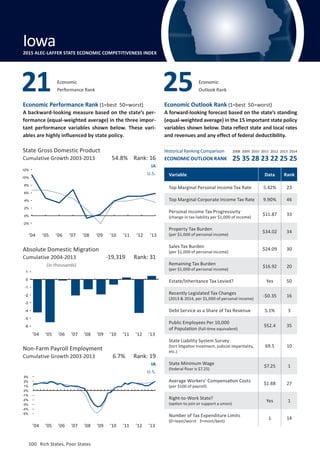
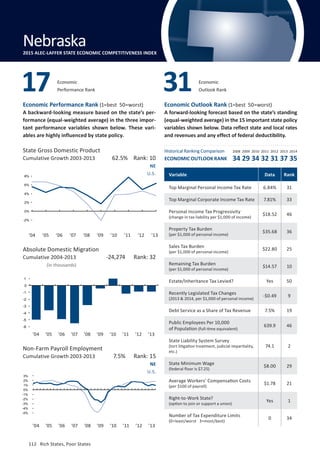
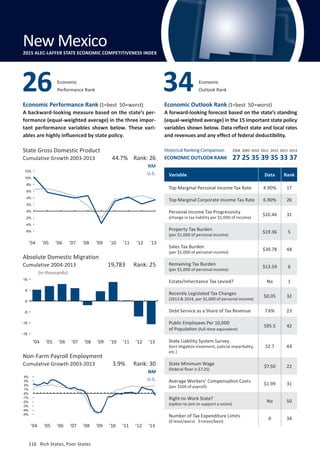
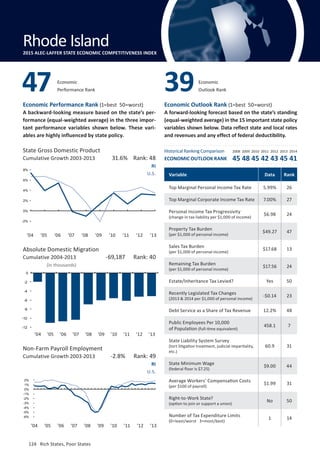
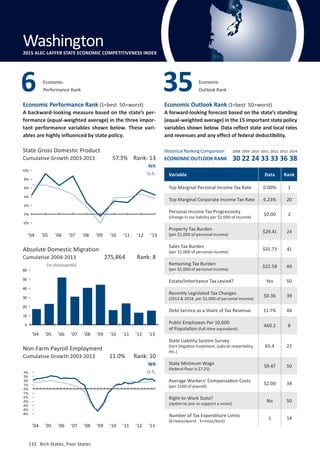
STATE OF THE STATES
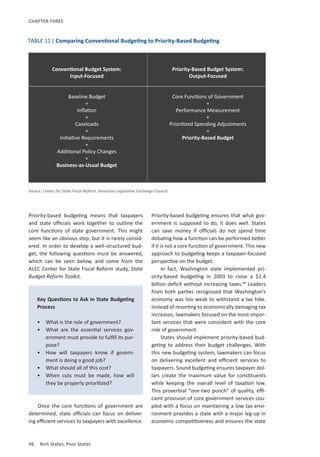
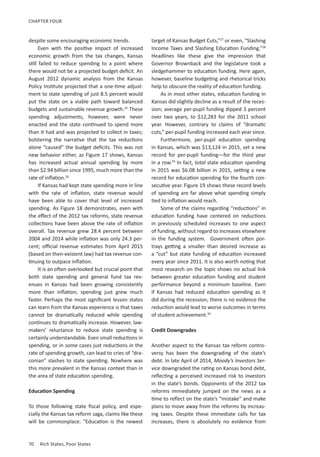
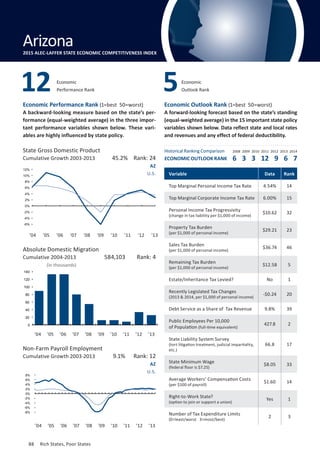
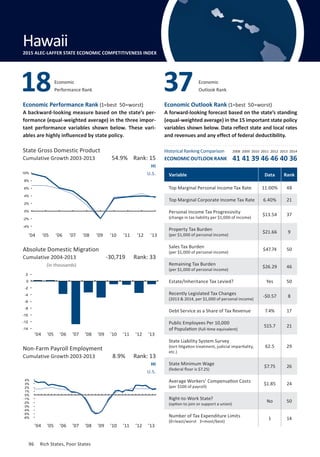
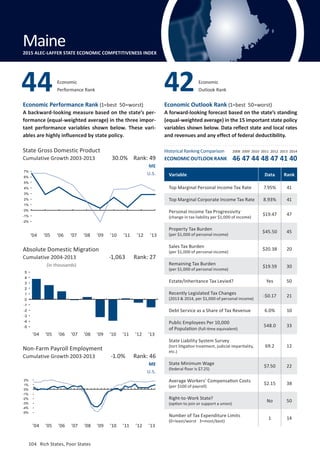
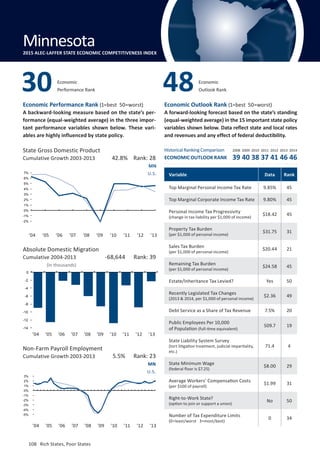
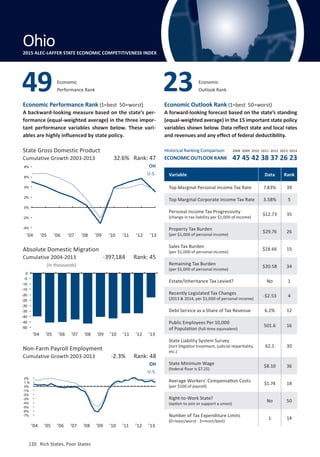
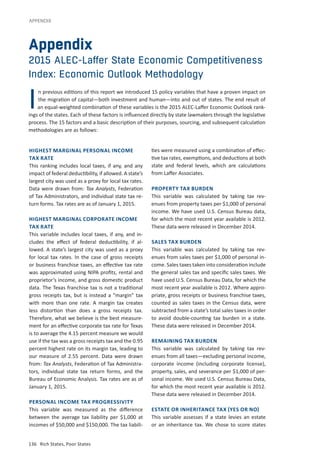
Ohio Continues Tax Cut Strategy
Governor John Kasich signed a $71.2 billion, two-
year budget that will result in nearly $1.9 billion
in net tax cuts.29
The governor approved a 6.3 per-
cent state income tax cut that takes effect next
year. This plan lowers the top personal income
tax rate to about 5 percent. The budget mandates
a tax policy commission to recommend how
to move Ohio’s personal income tax to a 3.5 or
3.75 percent flat rate by 2018. The governor’s plan
increases the existing tax exemption on the first
$250,000 of income for business owners of pass-
through entities from 50 to 75 percent and elimi-
nates the tax altogether in 2017.
While there are many positive tax reforms in
Ohio’s budget, not everything was pro-growth.
The budget contained significant spending
increases and some new taxes, including a 35 cent
per pack tax increase on cigarettes.
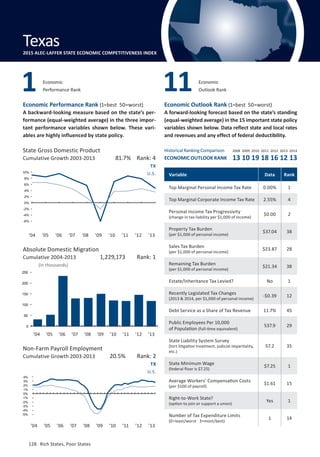
Texas-Sized Tax Cuts in the Lone Star State
This year, Texas legislators approved a massive tax
reduction. This builds upon Texas’ reputation as a
state that is friendly to businesses and individu-
als. Overall, Texas will cut nearly $3.8 billion in
taxes over the next two years. The plan includes
the following:
• Property tax break worth about $125 a year
for the average Texas homeowner in the form
of an increase to the homestead exemption
for school property taxes. However, the voters
must approve an amendment to the Texas Con-
stitution for this to take effect.
• 25 percent across-the-board cut in business
franchise tax rates
• Elimination of certain occupational fees
These reforms, coupled with Texas’ generally
free-market, pro-growth economy, have kept
the Lone Star State at number one in economic
performance and boosted them to the number
11 spot in this publication’s economic outlook. In
2014, Texas added more jobs than any other state
and experienced a growth of more than 5 percent
in GDP. According to Governor Greg Abbott, “[the
tax cut] happens at a time when other states
around the country are raising taxes and increas-
ing the cost of doing business—whereas here in …
Texas, we are focused on lowering taxes and mak-
ing the state more affordable for everybody.”30
As
these policies are implemented, in addition to the
other sound policies that Texas has in place, the
state will be primed to be one of the nation’s top
performers in the years to come. Commenting on
these reforms, Texas State Representative and
2015 ALEC National Chairman Phil King said, “We
are very proud that we were able to cut the tax
burden for job creators across Texas this session
while growing spending at a responsible rate and
ensuring the rainy day fund is well maintained.
We hope these changes will continue to move
Texas up in future Rich States, Poor States rank-
ings.”
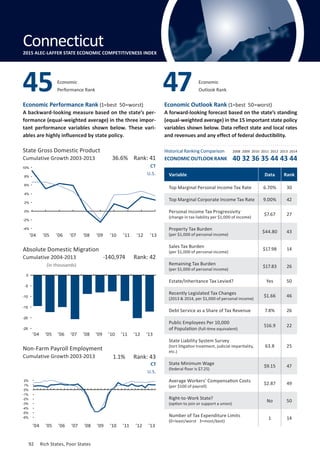
Florida Cuts Communications Taxes
This session, Governor Rick Scott called for the
elimination of the tax on manufacturing equip-
ment and a cut to communications taxes. This is
particularly notable in a state like Florida, which
has had some of the highest communications ser-
vices taxes in the country. After a special session
in June, Florida’s Legislature passed a $400 mil-
lion tax cut.31
Florida legislators voted to reduce
the Communications Services Tax by 1.73 per-
cent, saving taxpayers roughly $226.1 million. In
addition, lawmakers voted to cut sales taxes on
several products that are estimated to save citi-
zens over $130 million.
These cuts will make Florida more competi-
tive and keep more money in the pockets of tax-
payers. Most importantly, communications tax
relief means better economic opportunities for
families, business owners and entrepreneurs.
While praising Governor Scott’s original proposal,
it was encouraging to hear Representative Matt
Gaetz, chair of the Florida House Finance and Tax
Committee, explain, “In my committee, no tax is
safe. It is the goal of the House of Representatives
to find even more ways to decrease the tax bur-
den on Florida’s families.”
Partial Victories for Taxpayers
Washington Increases Spending and Rejects
Capital Gains Tax
After three special sessions, Washington passed
budget increases for education, worker wages,](https://image.slidesharecdn.com/rsps8thedition-150408094327-conversion-gate01/85/Rich-States-Poor-States-2015-Edition-27-320.jpg)
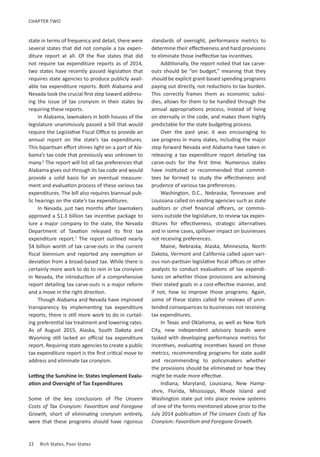


![www.alec.org 77
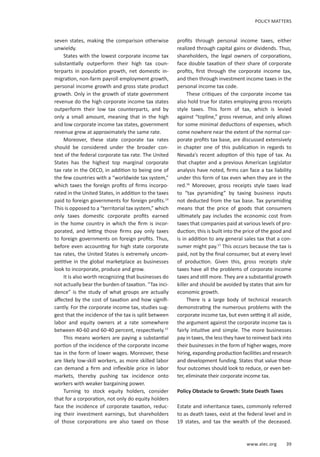
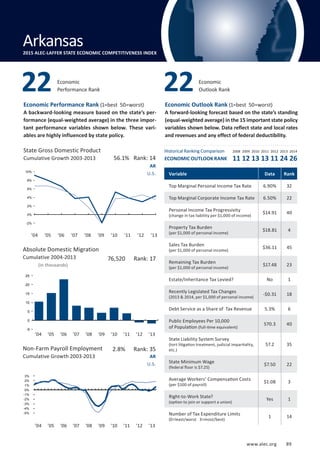
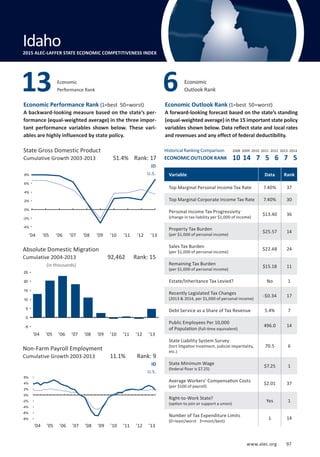
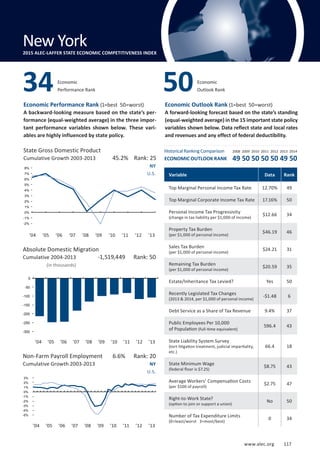
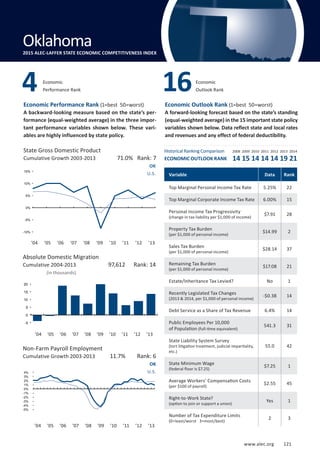
released an edition of The Mainstreet Economy
Report that detailed some positive results of the
2012 Kansas tax reductions, especially in terms of
personal income growth.52
Since the fourth quar-
ter of 2012, Kansas has experienced a growth rate
of 2.92 percent in personal income, beating out
the U.S. average of 2.85 percent and outperform-
ing all of its neighbors except Colorado. Tellingly,
Colorado is the only neighbor of Kansas that main-
tained a lower personal income tax rate, a flat 4.63
percent, at the time. The Mainstreet Economy
Report also discusses average weekly earnings:
“Addition-ally [sic] in terms of average
weekly earnings, Kansas experienced an
increase of 4.82% which was almost four
times that of the U.S., more than four times
thatofMissouri,approximatelyseventimes
that of Nebraska, and nearly four times
that of Oklahoma. Of Kansas’ neighbors,
only Colorado with 4.82% average weekly
wage growth outperformed Kansas.”53
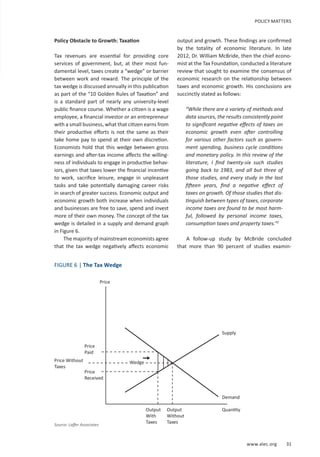
The report concludes with a bold prediction
about Kansas’ neighboring states, saying that
“Kansas job and income data since the tax cut
show that, except for Colorado, the state economy
has outperformed, by a wide margin, that of each
of its neighbors and the U.S. To remain competi-
tive, expect Kansas’ neighbors to reduce state and
local taxes in the years ahead.”54
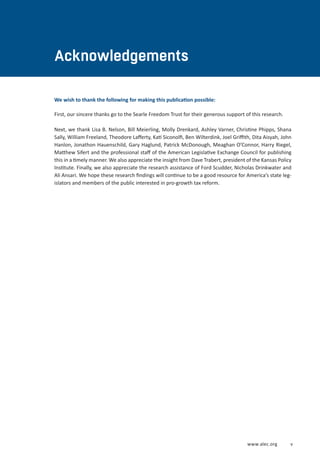
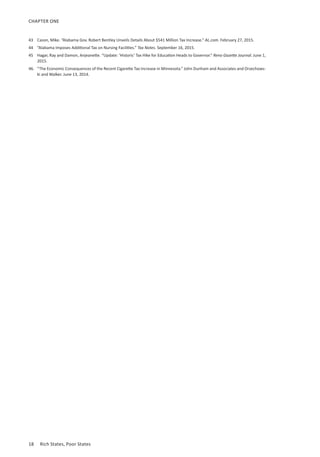
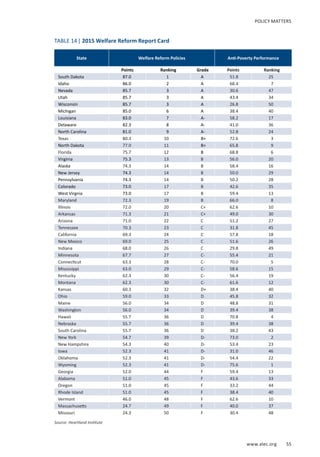
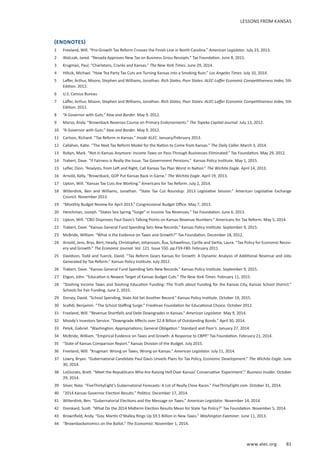
Critics of the Kansas tax reform efforts are
quick to note that the numbers cited by the
Creighton report have since been revised down-
ward. While this is true, and Kansas only expe-
rienced a growth in private gross state product
(GSP) of 1.9 percent in 2013, the disappointing fig-
ure can be traced to other economic factors unre-
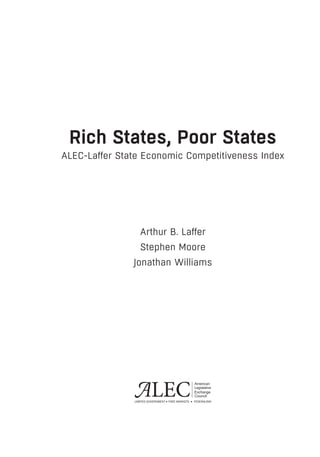
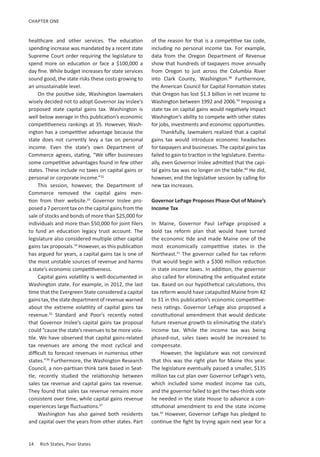
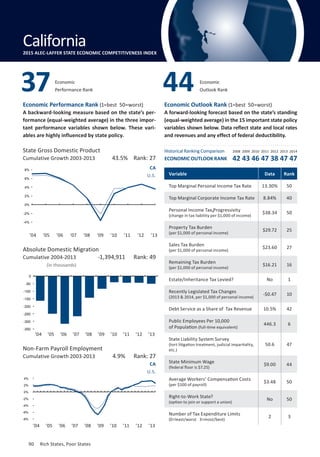
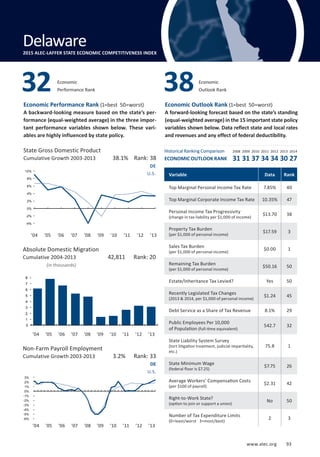
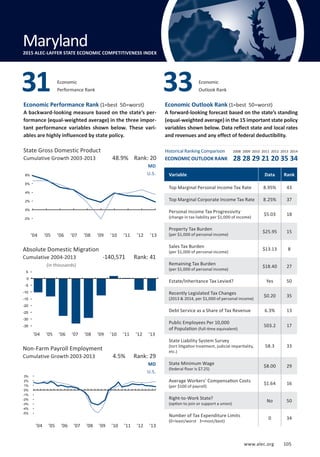
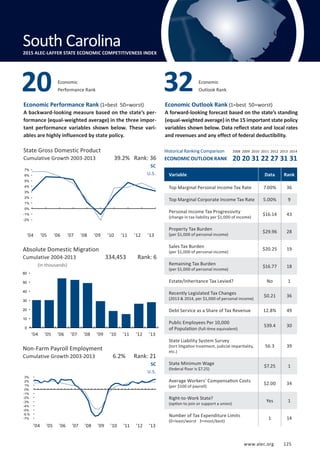
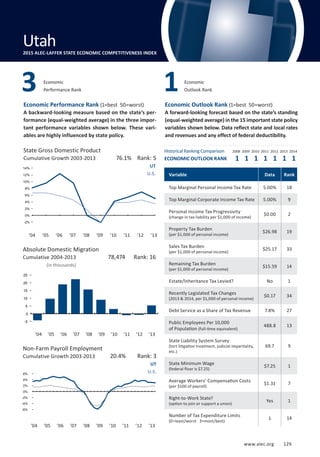
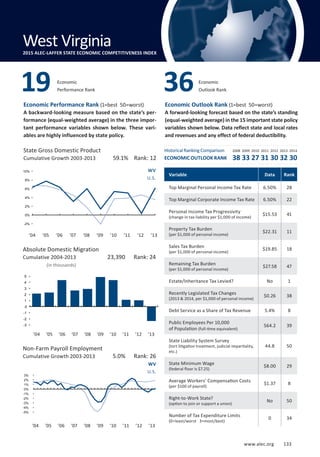
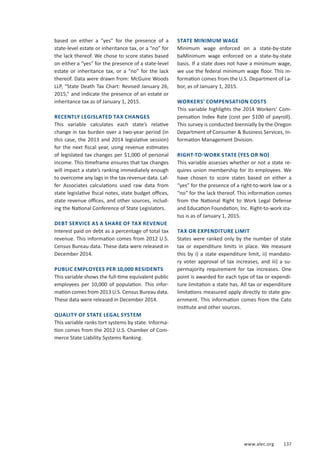
LESSONS FROM KANSAS
Source: Kansas Policy Institute
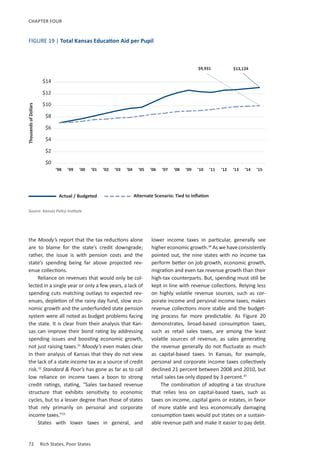
State
1998-2012
Rank
1998-2012
Growth
2013
Rank
2013
Growth
2014
Rank
2014
Growth
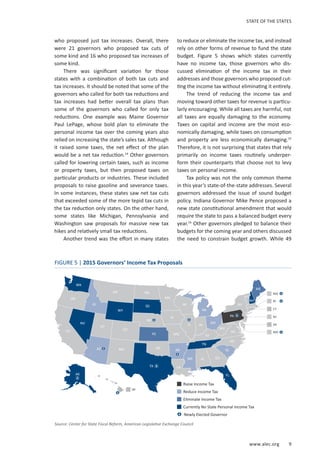
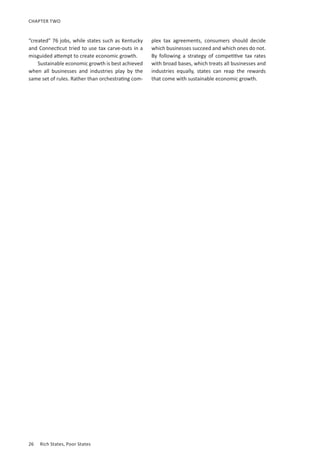
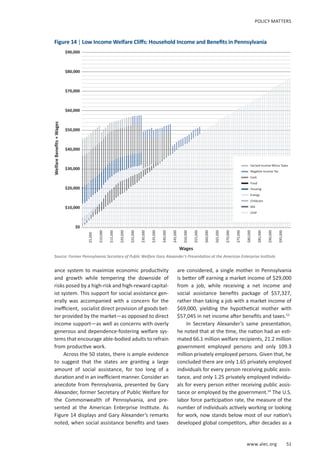
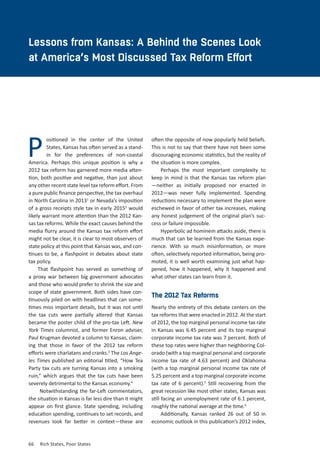
Kansas 38 2.2% 27 1.6% 21 1.9%
Missouri 44 -1.0% 35 1.3% 39 1.2%
Nebraska 17 9.8% 31 1.4% 33 1.4%
Oklahoma 19 8.5% 26 1.6% 26 1.5%
Colorado 15 10.6% 5 3.1% 3 3.8%
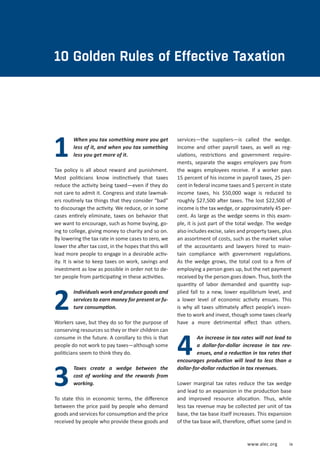
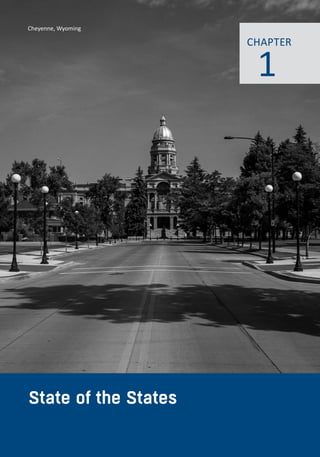
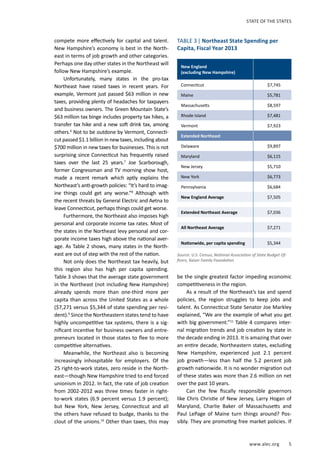
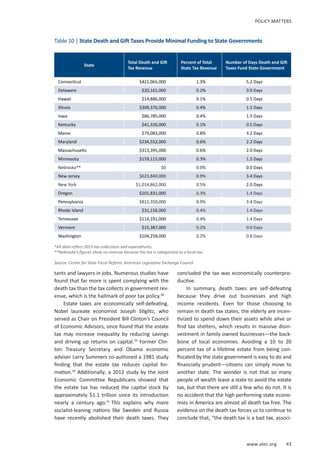
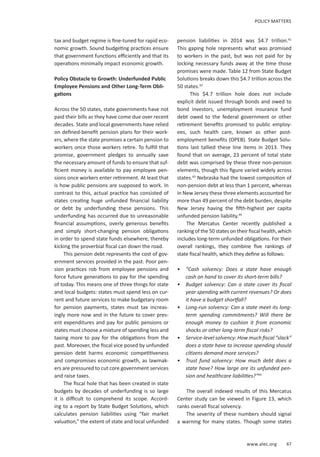
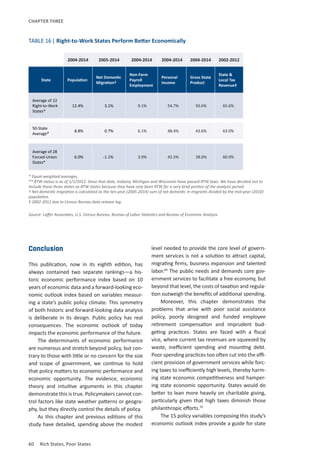
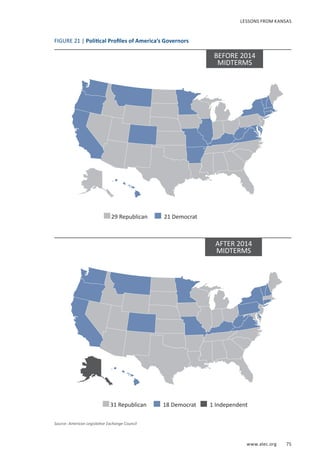
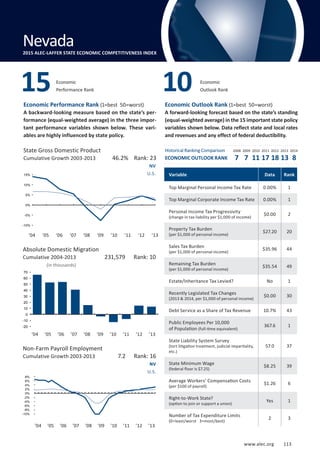
TABLE 19 | Private Sector Job Growth and Rankings
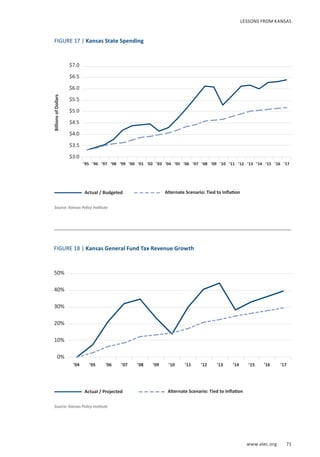
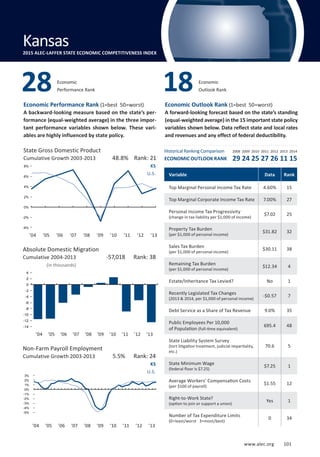
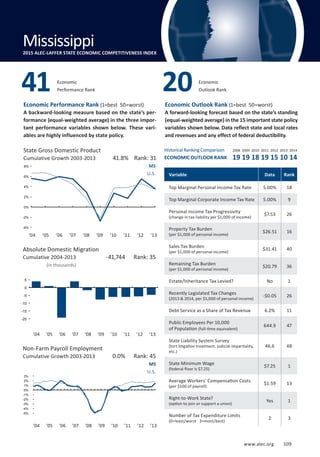
State Grouping
Pre-Tax Reform Post-Tax Reform
1998-2012
Kansas as a
Percentage of State
Groupings
2013-2015*
Kansas as a
Percentage of State
Groupings
No Income Tax States 15.03% 14.78% 9.00% 48.29%
States with Income Taxes 3.64% 61.01% 5.87% 74.09%
Kansas 2.22% 4.35%
TABLE 18 | Private Sector Job Change
*Average through August of 2015
Source: Kansas Policy Institute](https://image.slidesharecdn.com/rsps8thedition-150408094327-conversion-gate01/85/Rich-States-Poor-States-2015-Edition-91-320.jpg)
![78 Rich States, Poor States
CHAPTER FOUR
lated to the tax changes. Like many other states,
Kansas was hit hard by the 2013 drop in oil prices
and had some of its aviation sector continue to
perform poorly. When these sectors are not taken
into account, the rest of the Kansas economy grew
by 5.5 percent, beating the national average of 4.3
percent. Rather than having a struggling economy
with most sectors shrinking or performing poorly,
Kansas has a growing economy with two unique
sectors that are doing poorly for reasons unre-
lated to the 2012 tax reforms.55
The Kansas City metropolitan area also pro-
vides an excellent case study in what the 2012
tax reforms have accomplished. On the Kansas
side of the metropolitan area, the top personal
income tax rate is 4.9 percent, compared to a top
rate of 7 percent on the Missouri side of the line.
In May 2015, The Wall Street Journal noted that
“Over the past two calendar years, private-sector
jobs increased by 5.6 percent on the Kansas side
and only 2.2 percent on the Missouri [side]. In
the same period hourly wages grew $1.22 on the
Kansas side, compared with $0.61 on the Missouri
side.”56
Another crucial metric to examine when mea-
suring economic health and vitality is private sec-
tor employment. If more jobs are being added
and more citizens are finding work, the result is
a truly sustainable and growing economy. Crit-
ics will sometimes argue that Kansas’ economic
performance is lagging behind other states, but
what these critics miss is that Kansas was already
lagging behind other states before the 2012 tax
reform and that this lag was the reason for such
dramatic and bold reforms.
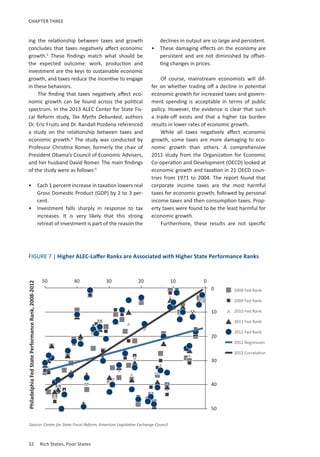
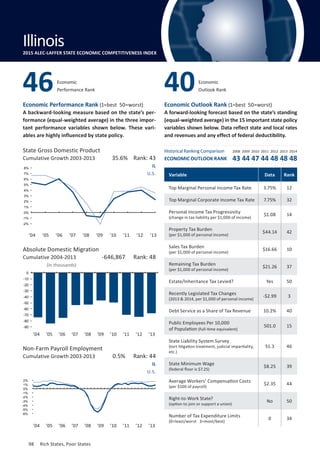
The Kansas Policy Institute has looked at
employment growth in Kansas and reached some
interesting conclusions. Since the 2012 tax reforms
were enacted, Kansas has improved its standing
among fellow states that tax personal income, as
Table 18 shows.
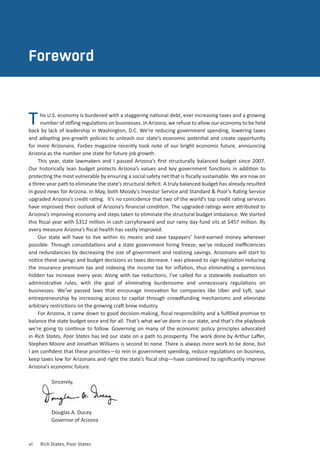
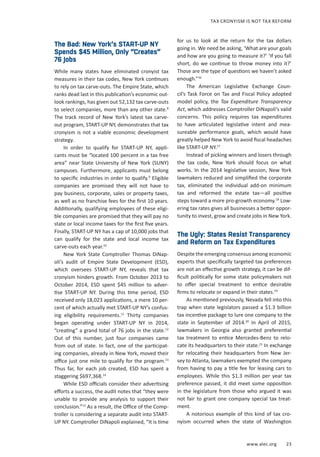
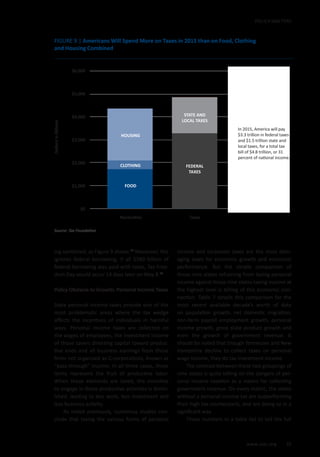
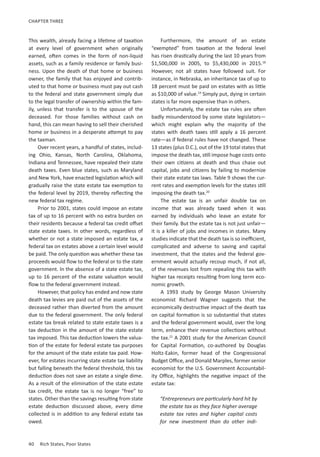
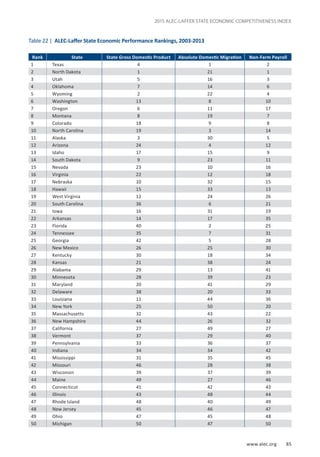
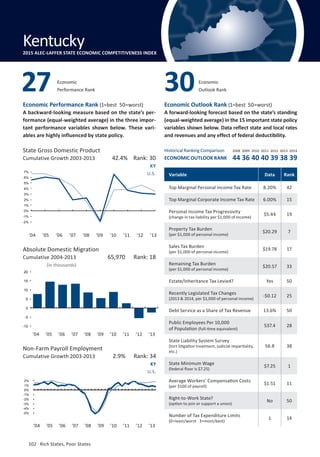
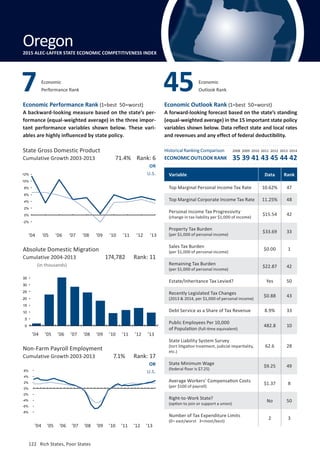
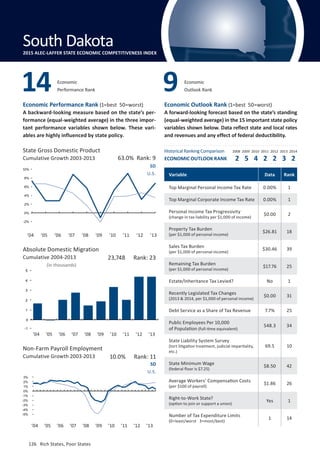
According to Table 19, employment statistics
show that Kansas has increased private sector
employment from 2013 to 2015 by 4.39 percent
and is improving its rate of private sector job
growth.
From 1998 to 2012, Kansas lagged behind all of
its neighbors except Missouri in private sector job
growth. Since the 2012 tax reforms were enacted,
however, Colorado is the only neighboring state
that can boast a higher level of private sector job
growth. As an important side note, Colorado’s top
personal income tax rate is, and has been for some
time, set at a flat 4.63 percent. Only recently has
the Kansas top marginal personal income tax rate
dropped to a slightly lower rate of 4.6 percent.
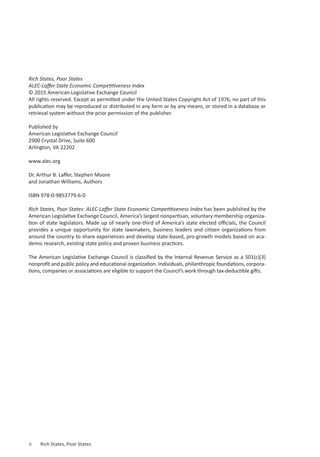
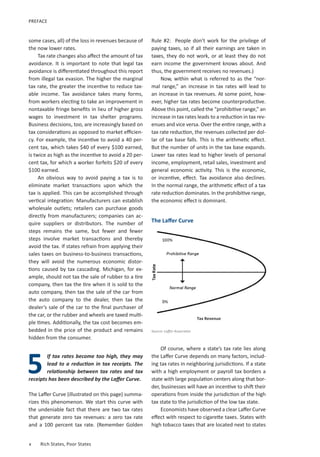
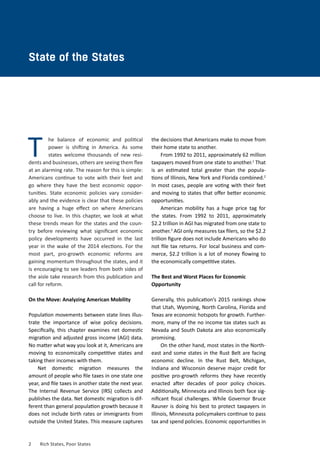
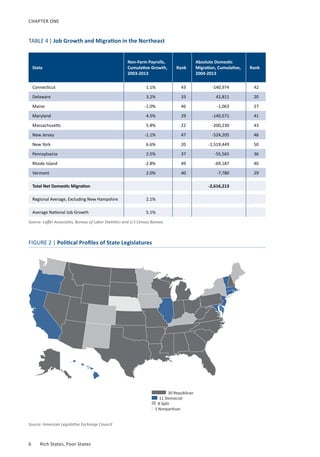
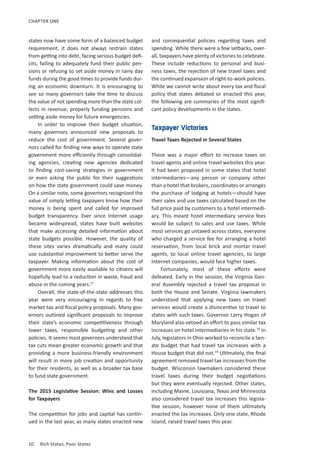
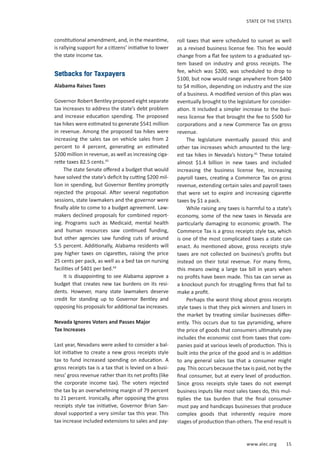
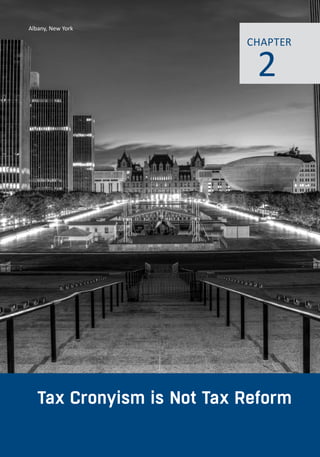
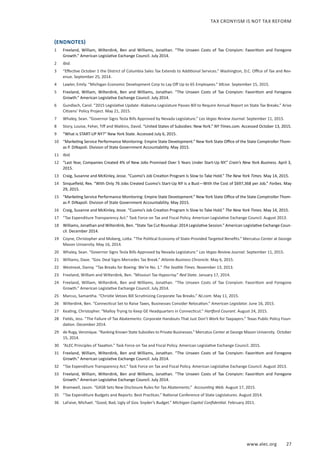
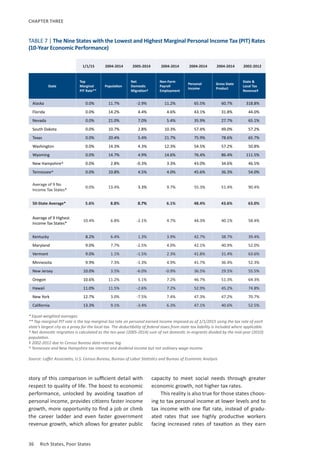
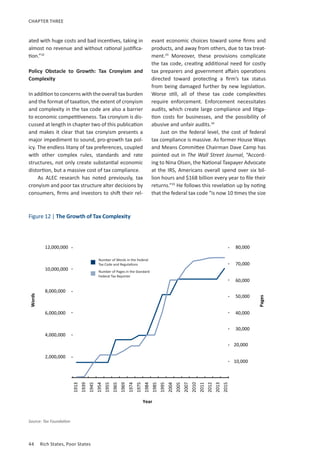
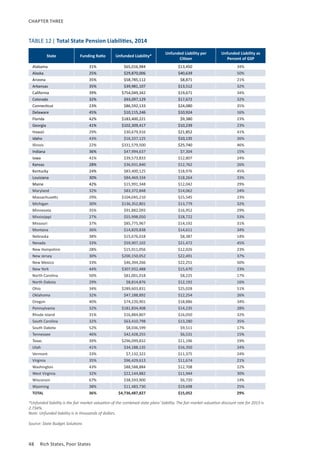
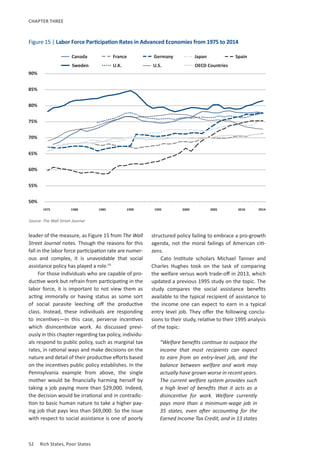
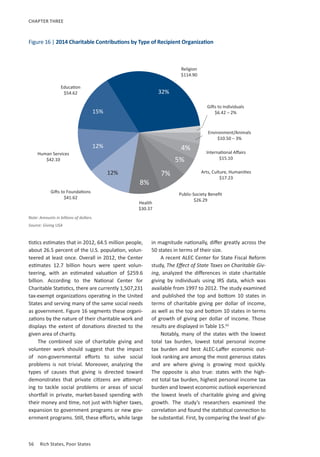
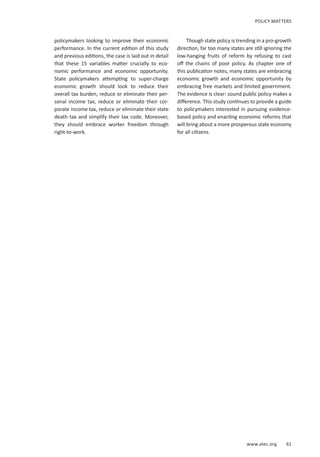
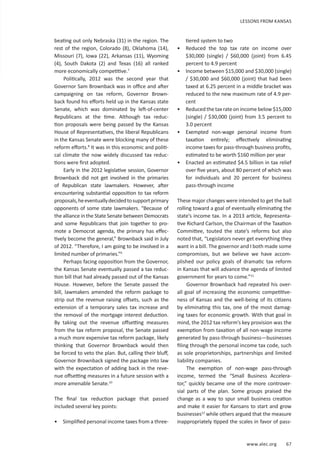
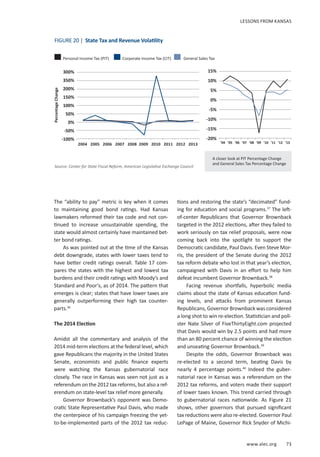
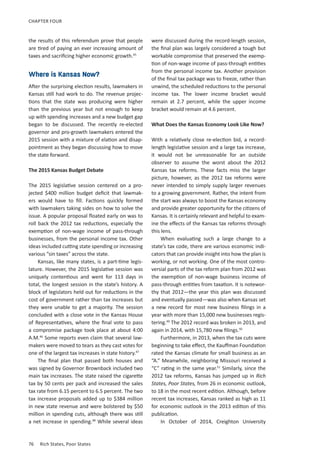
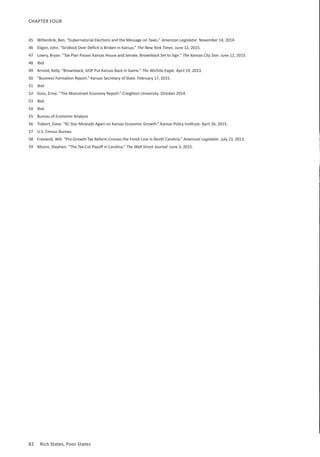
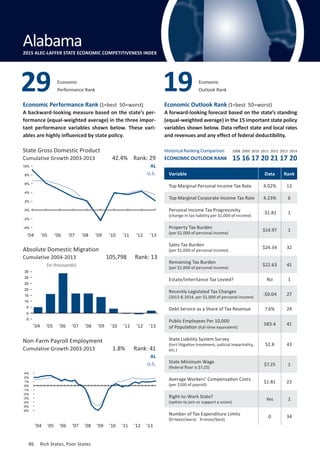
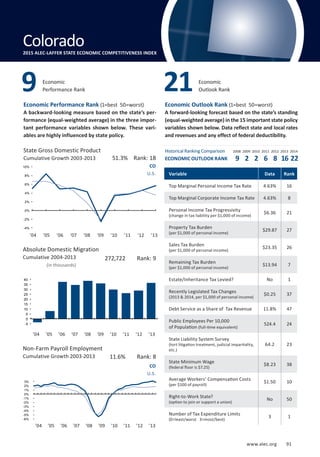
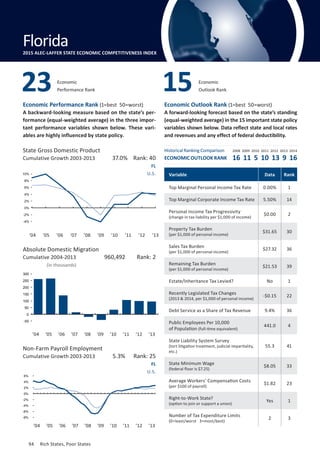
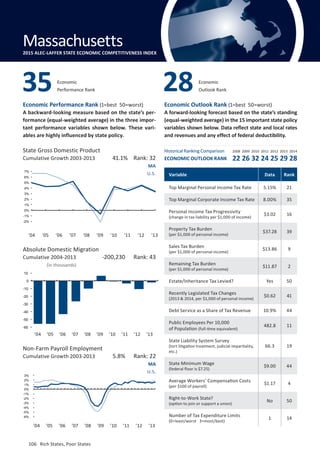
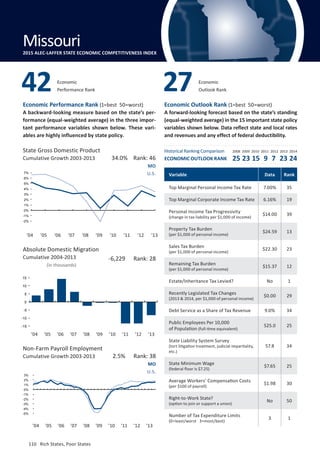
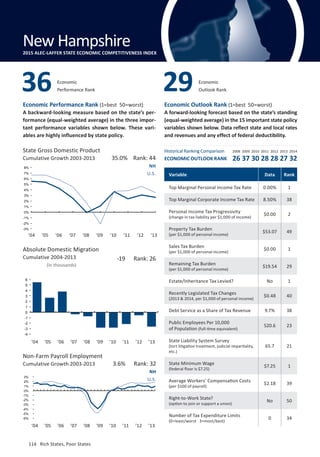
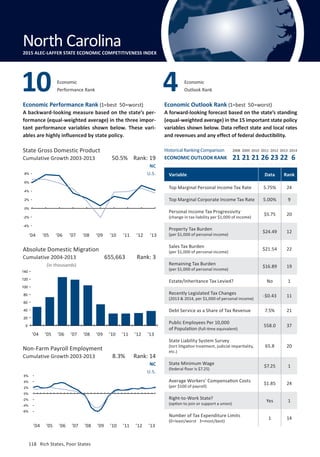
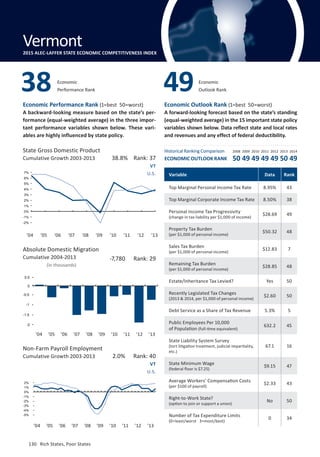
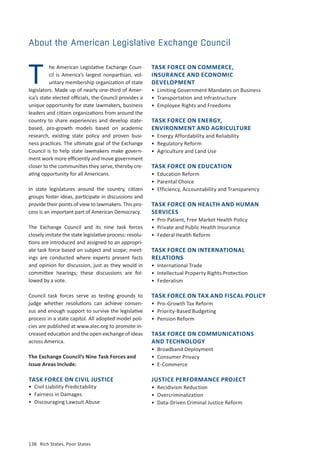
Unemployment rates tell a story similar to the
narrative from private sector job growth.57
The
unemployment rate for the U.S. as a whole was
5.5 percent as of May 2015. As Table 20 demon-
strates, Kansas’ unemployment rate is 2 percent-
age points lower than the U.S. average.
Though the full effects of Kansas’ bold tax
reform will take years to materialize, the early
signs are vastly more encouraging than critics
would have the public believe. Assuming that
Governor Brownback and Kansas lawmakers are
able to preserve the key elements of the 2012
tax reforms, the potential for strong economic
growth in the long term is very likely.
Conclusion—Lessons for State
Lawmakers
Ultimately, the story of the 2012 Kansas tax
reforms provides some important lessons for
state lawmakers across the country. In 2012, Gov-
ernor Brownback and legislative allies set out to
improve their state’s economy, which had been
trailing the national average. As time goes on with
the new lower tax rates, economic evidence will
continue to accumulate and give ever-increasing
clarity to the question of to what degree the
reforms succeeded. Economic theory and the
experience of low-tax states suggest that they
will, as long as anti-growth tax changes are not
implemented in their place.
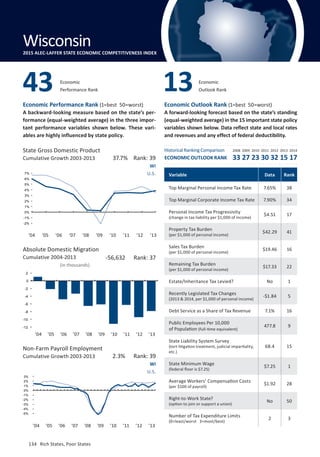
State 2012 2015
Kansas 6.1% 4.3%
Nebraska 4.0% 2.5%
Missouri 7.5% 5.7%
Colorado 7.8% 4.2%
Oklahoma 6.1% 4.1%
Source: U.S. Census Bureau
TABLE 20 | State Unemployment Rates](https://image.slidesharecdn.com/rsps8thedition-150408094327-conversion-gate01/85/Rich-States-Poor-States-2015-Edition-92-320.jpg)


This document provides an executive summary of the 2015 edition of the report "Rich States, Poor States" by Arthur Laffer, Stephen Moore, and Jonathan Williams. The report analyzes state economic policies and provides the 2015 ALEC-Laffer State Economic Competitiveness Index, which ranks states based on past economic performance and future economic outlook. Some of the best practices identified for states include lowering taxes, reducing regulations, and controlling spending and debt. The report also discusses important state policy developments since the previous edition and warns against the pitfalls of "tax cronyism." Chapters analyze specific state policy issues and economic reforms in Kansas in more depth. The state rankings aim to identify which state policies have led to greater economic opportunity


