Downloaded 51 times


![CHAPTER TWO
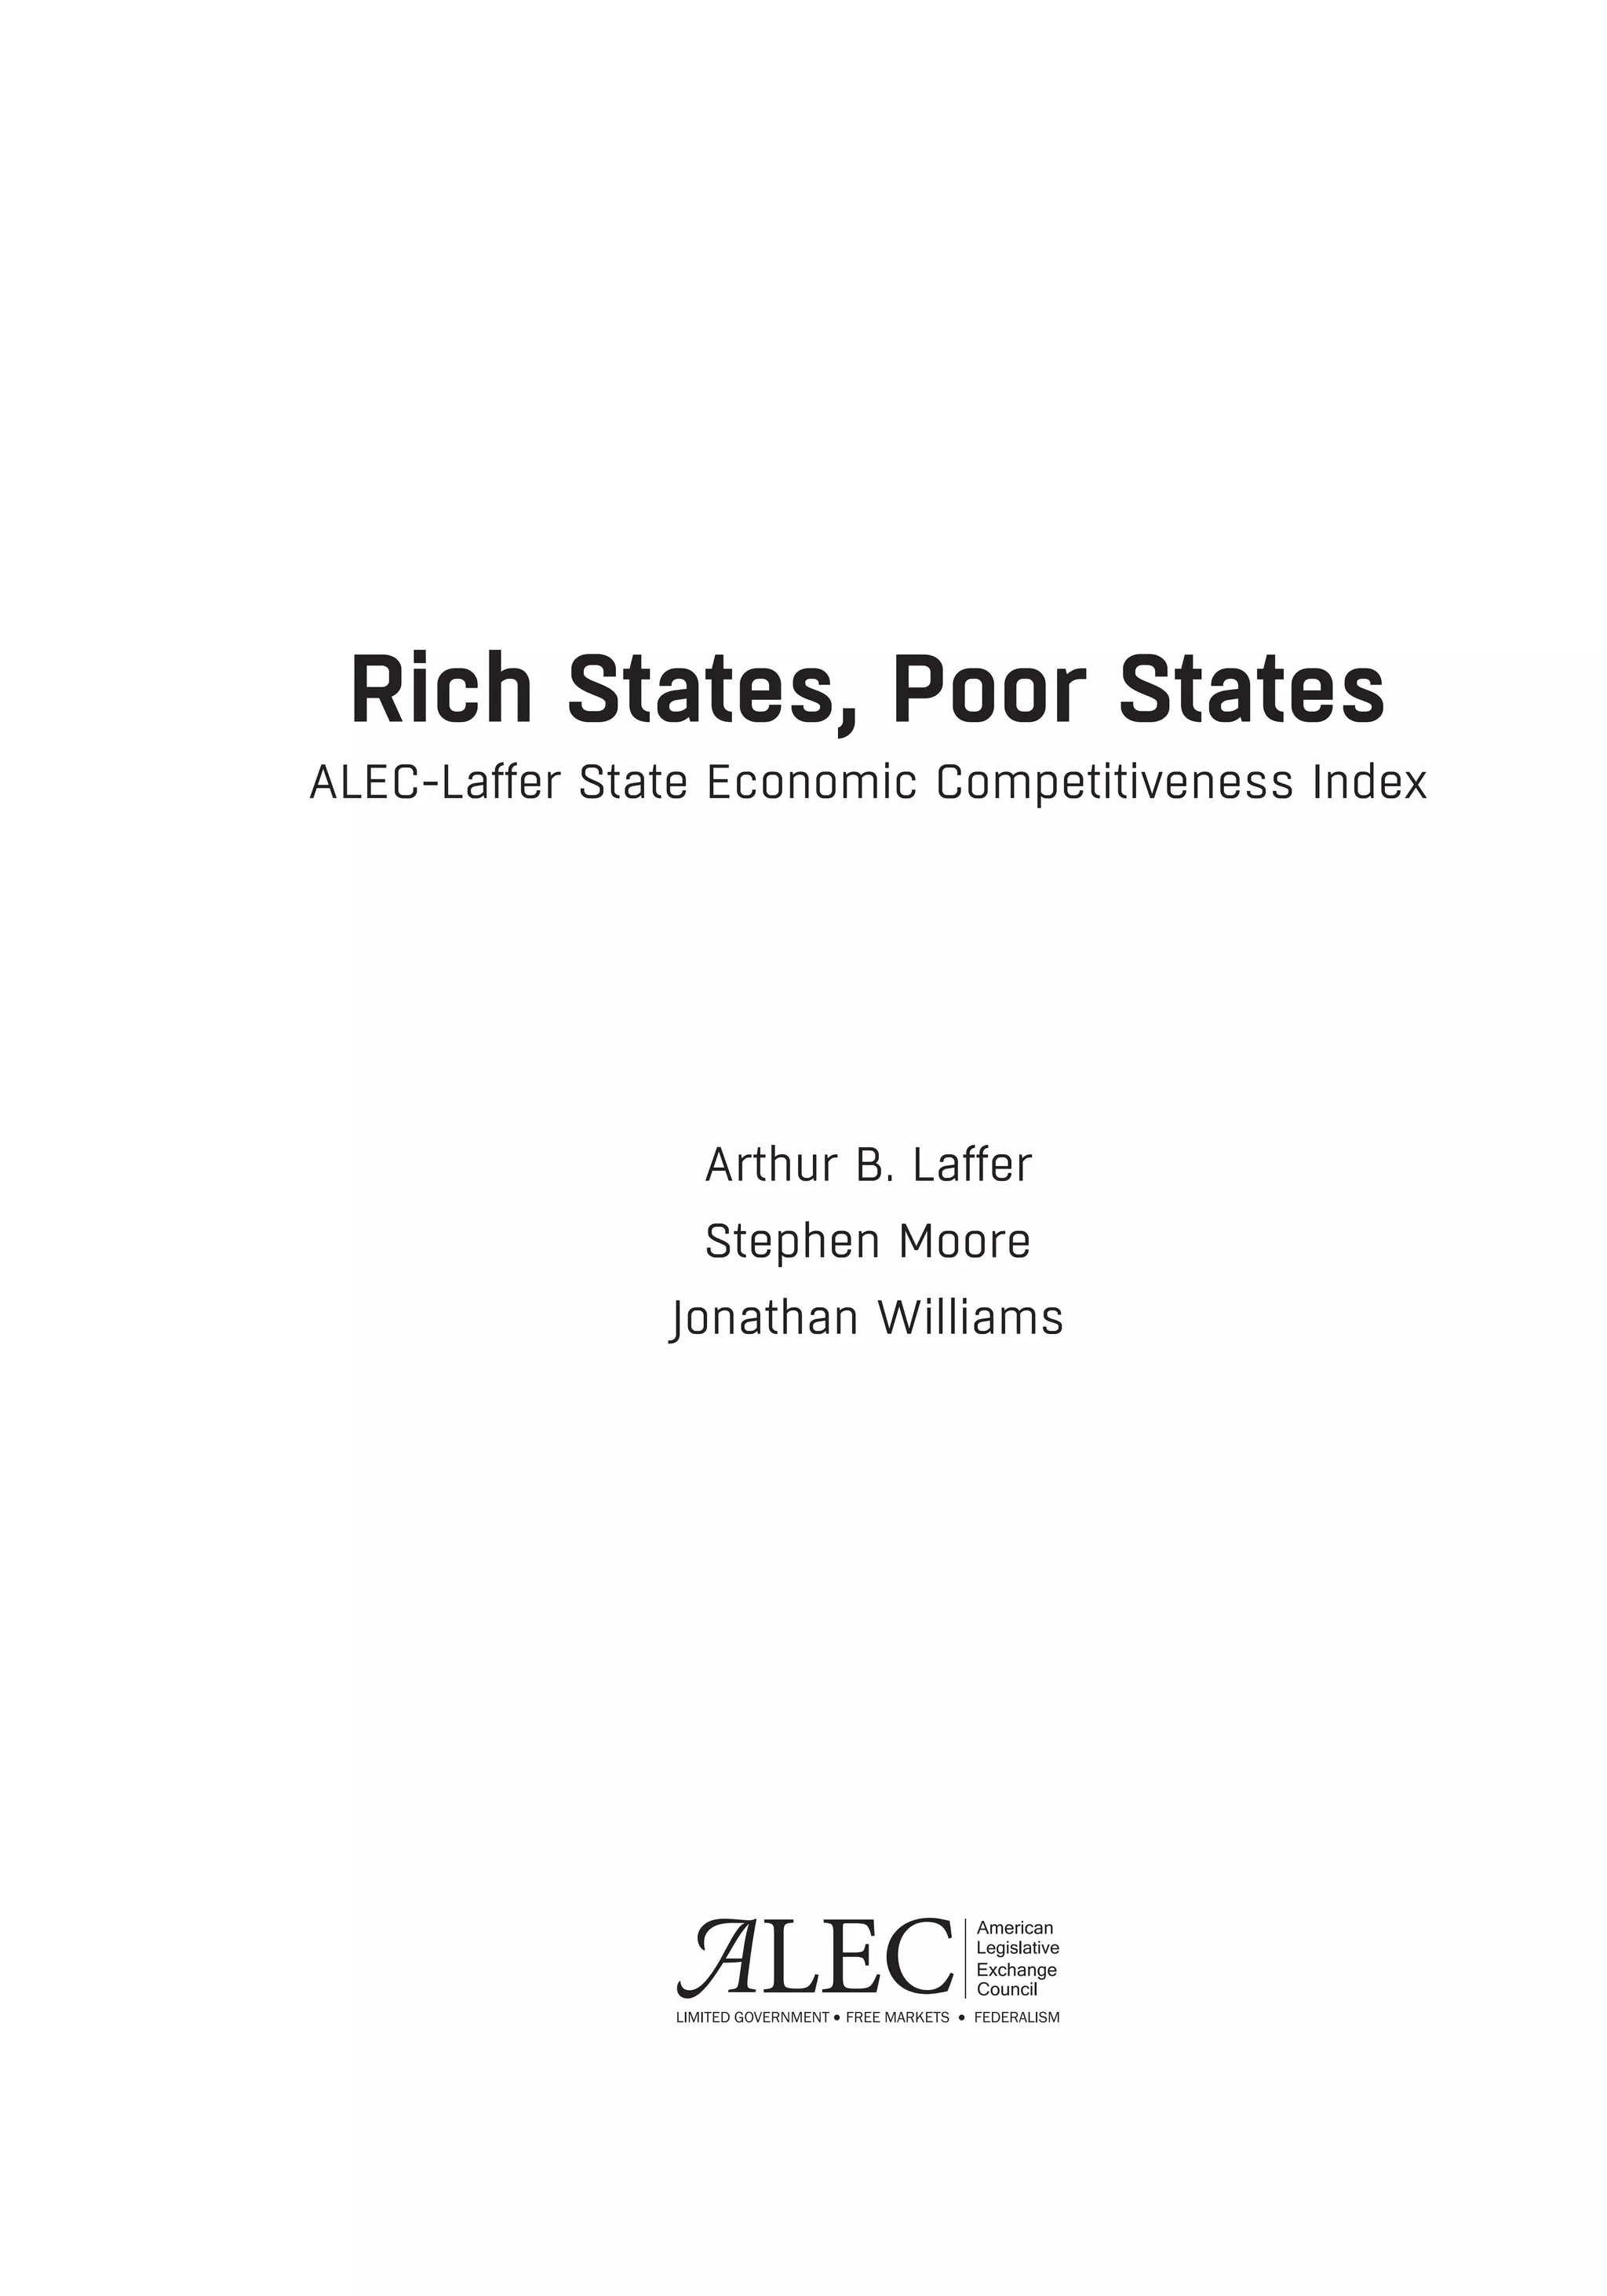
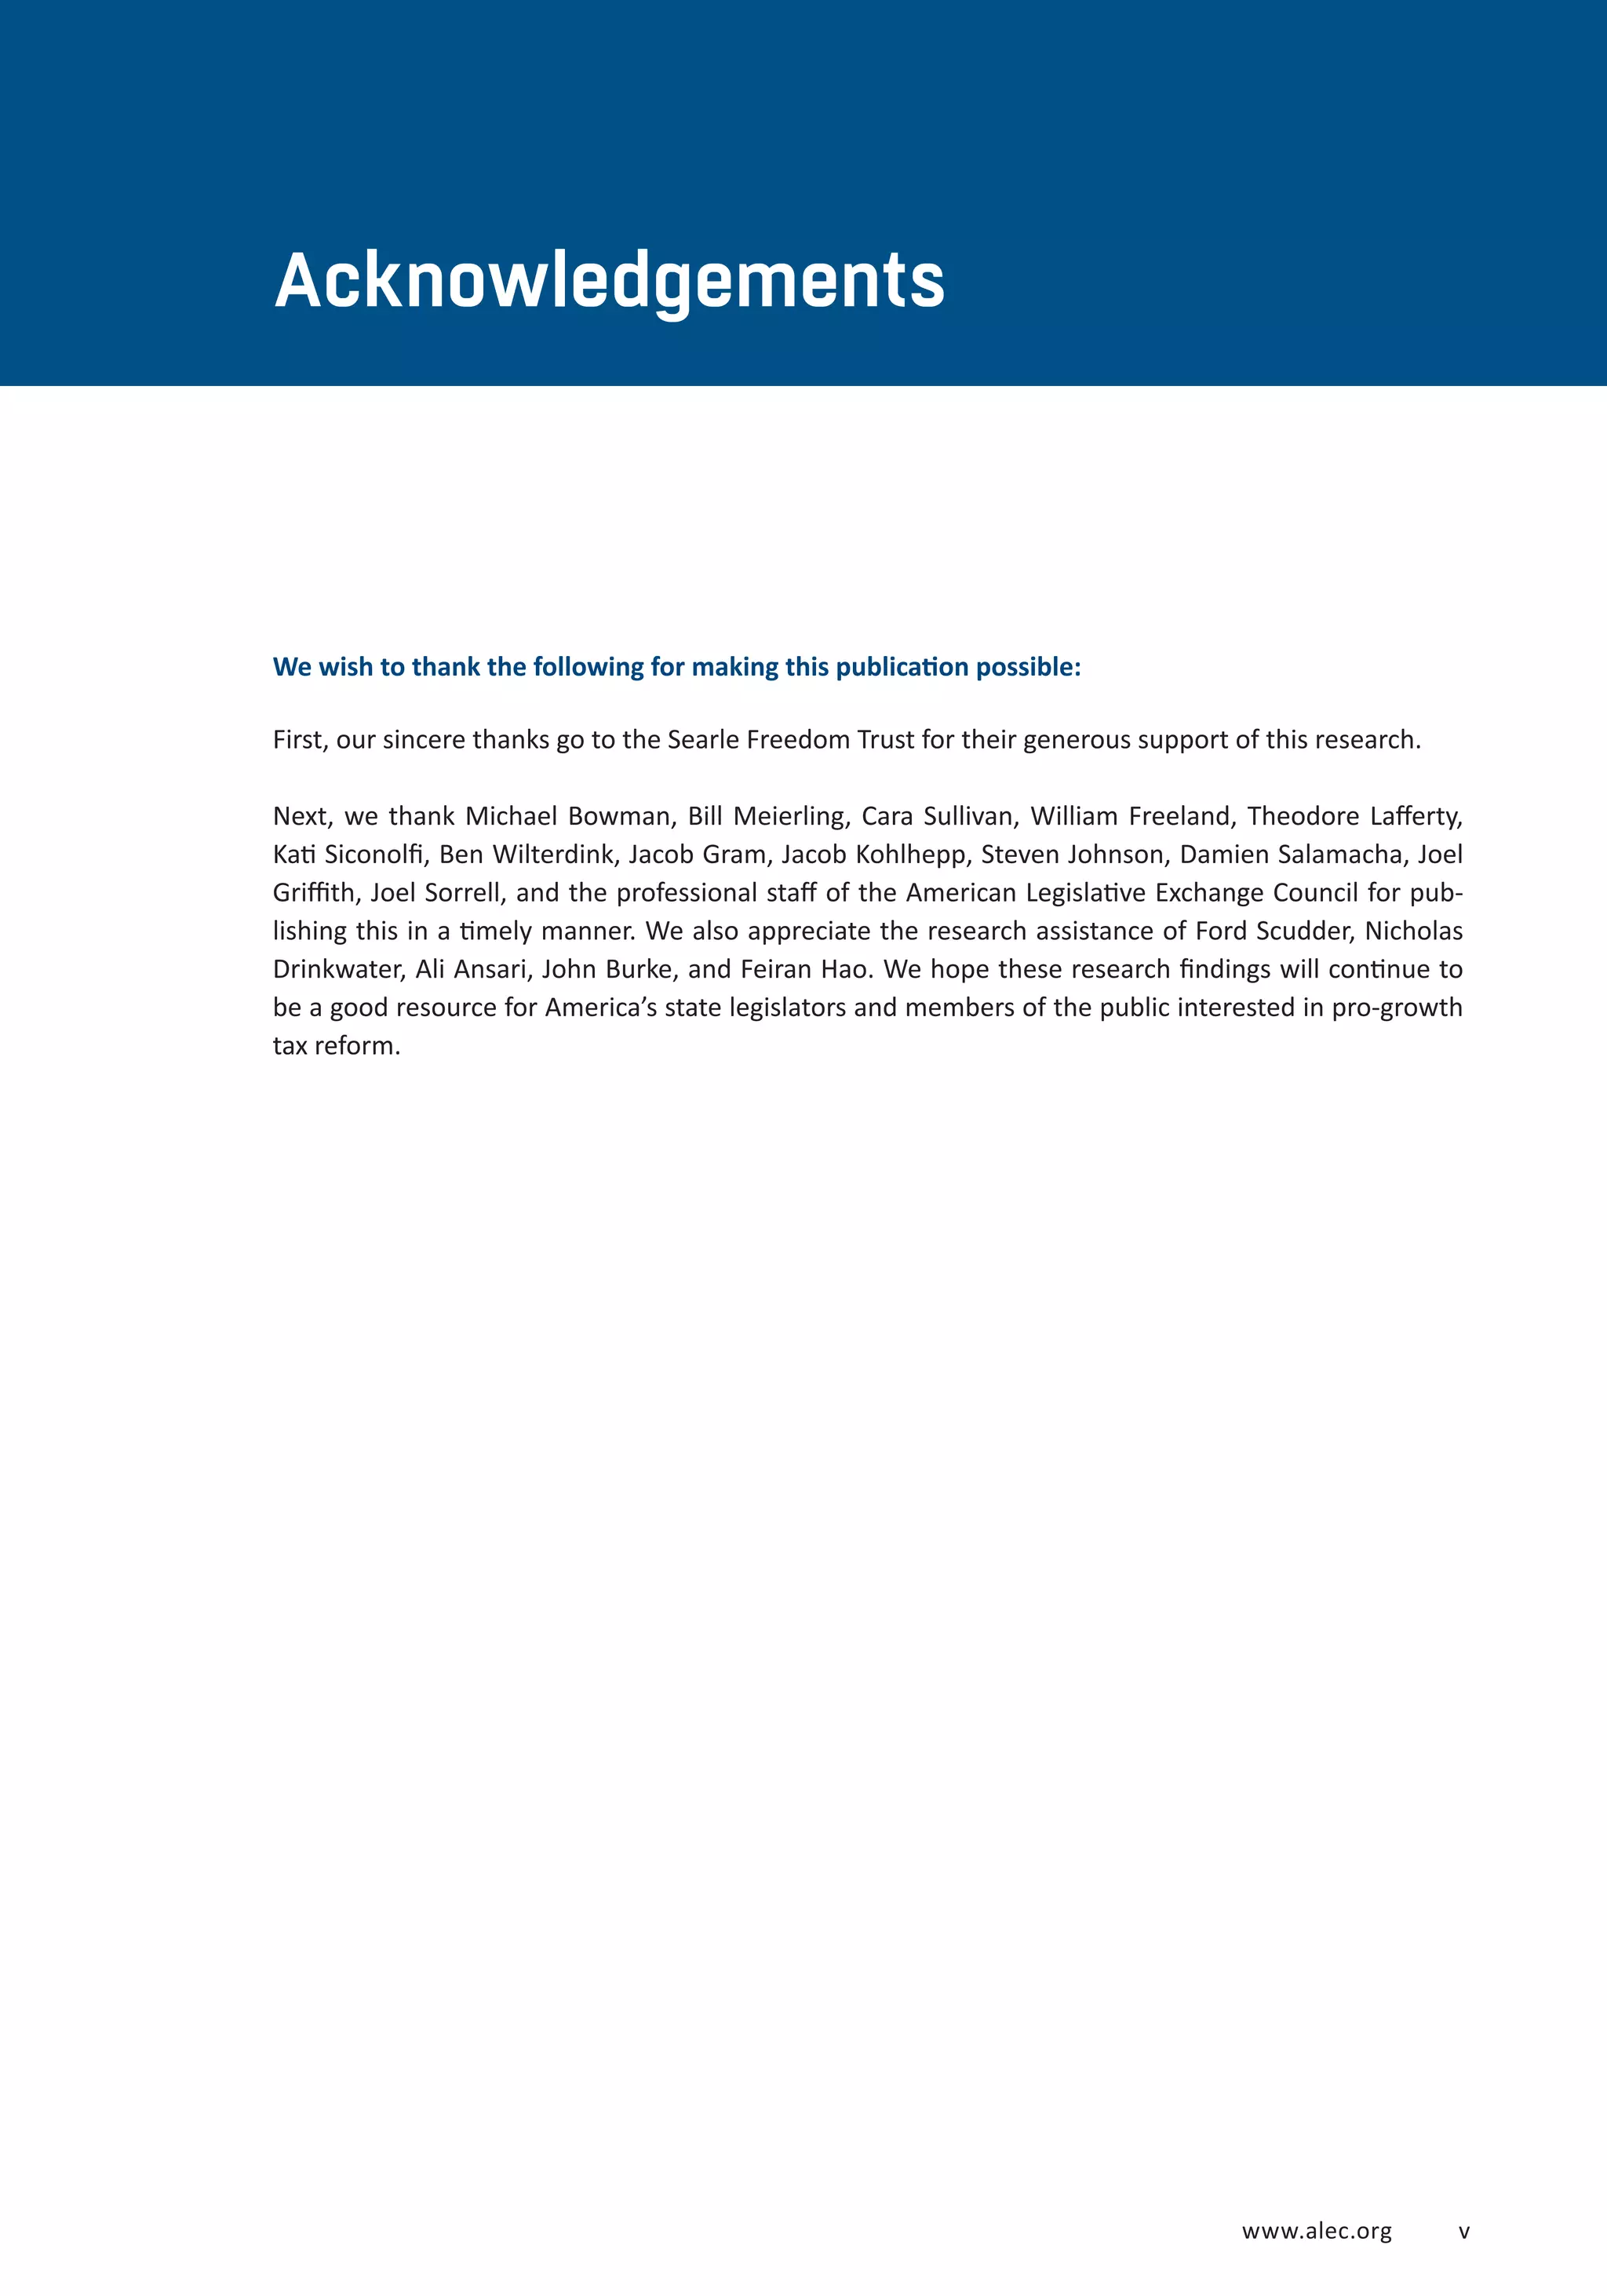
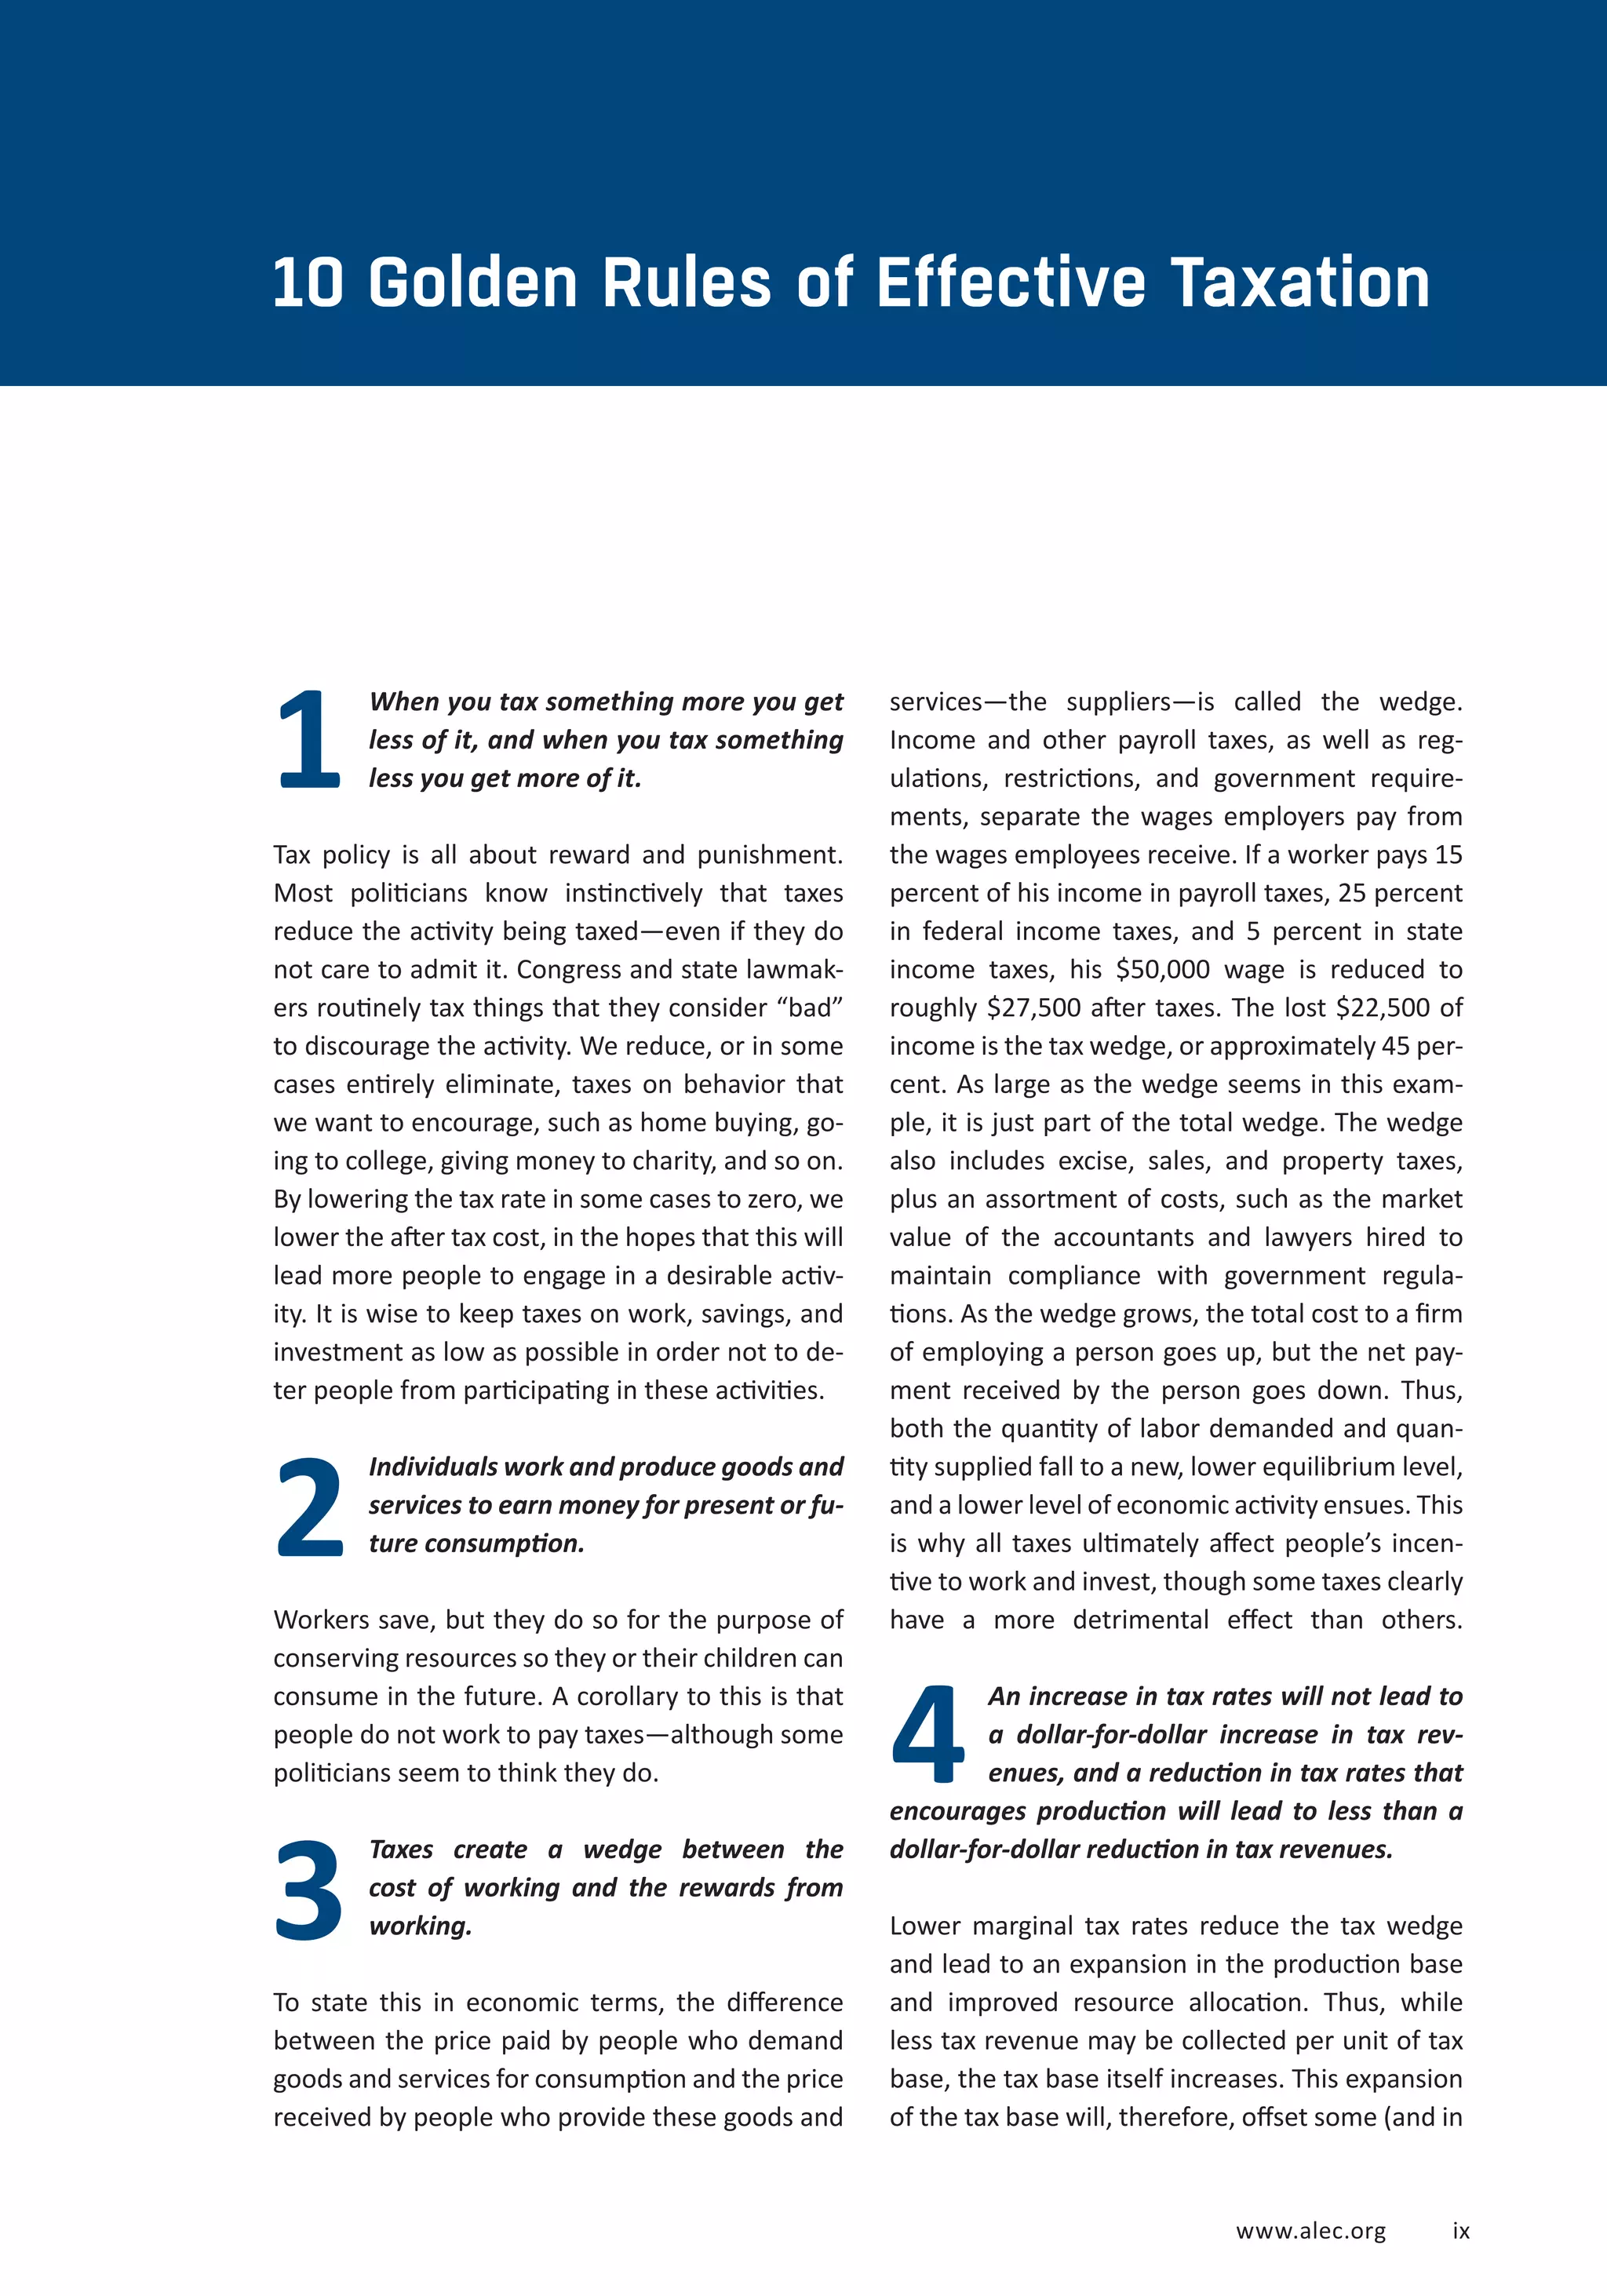
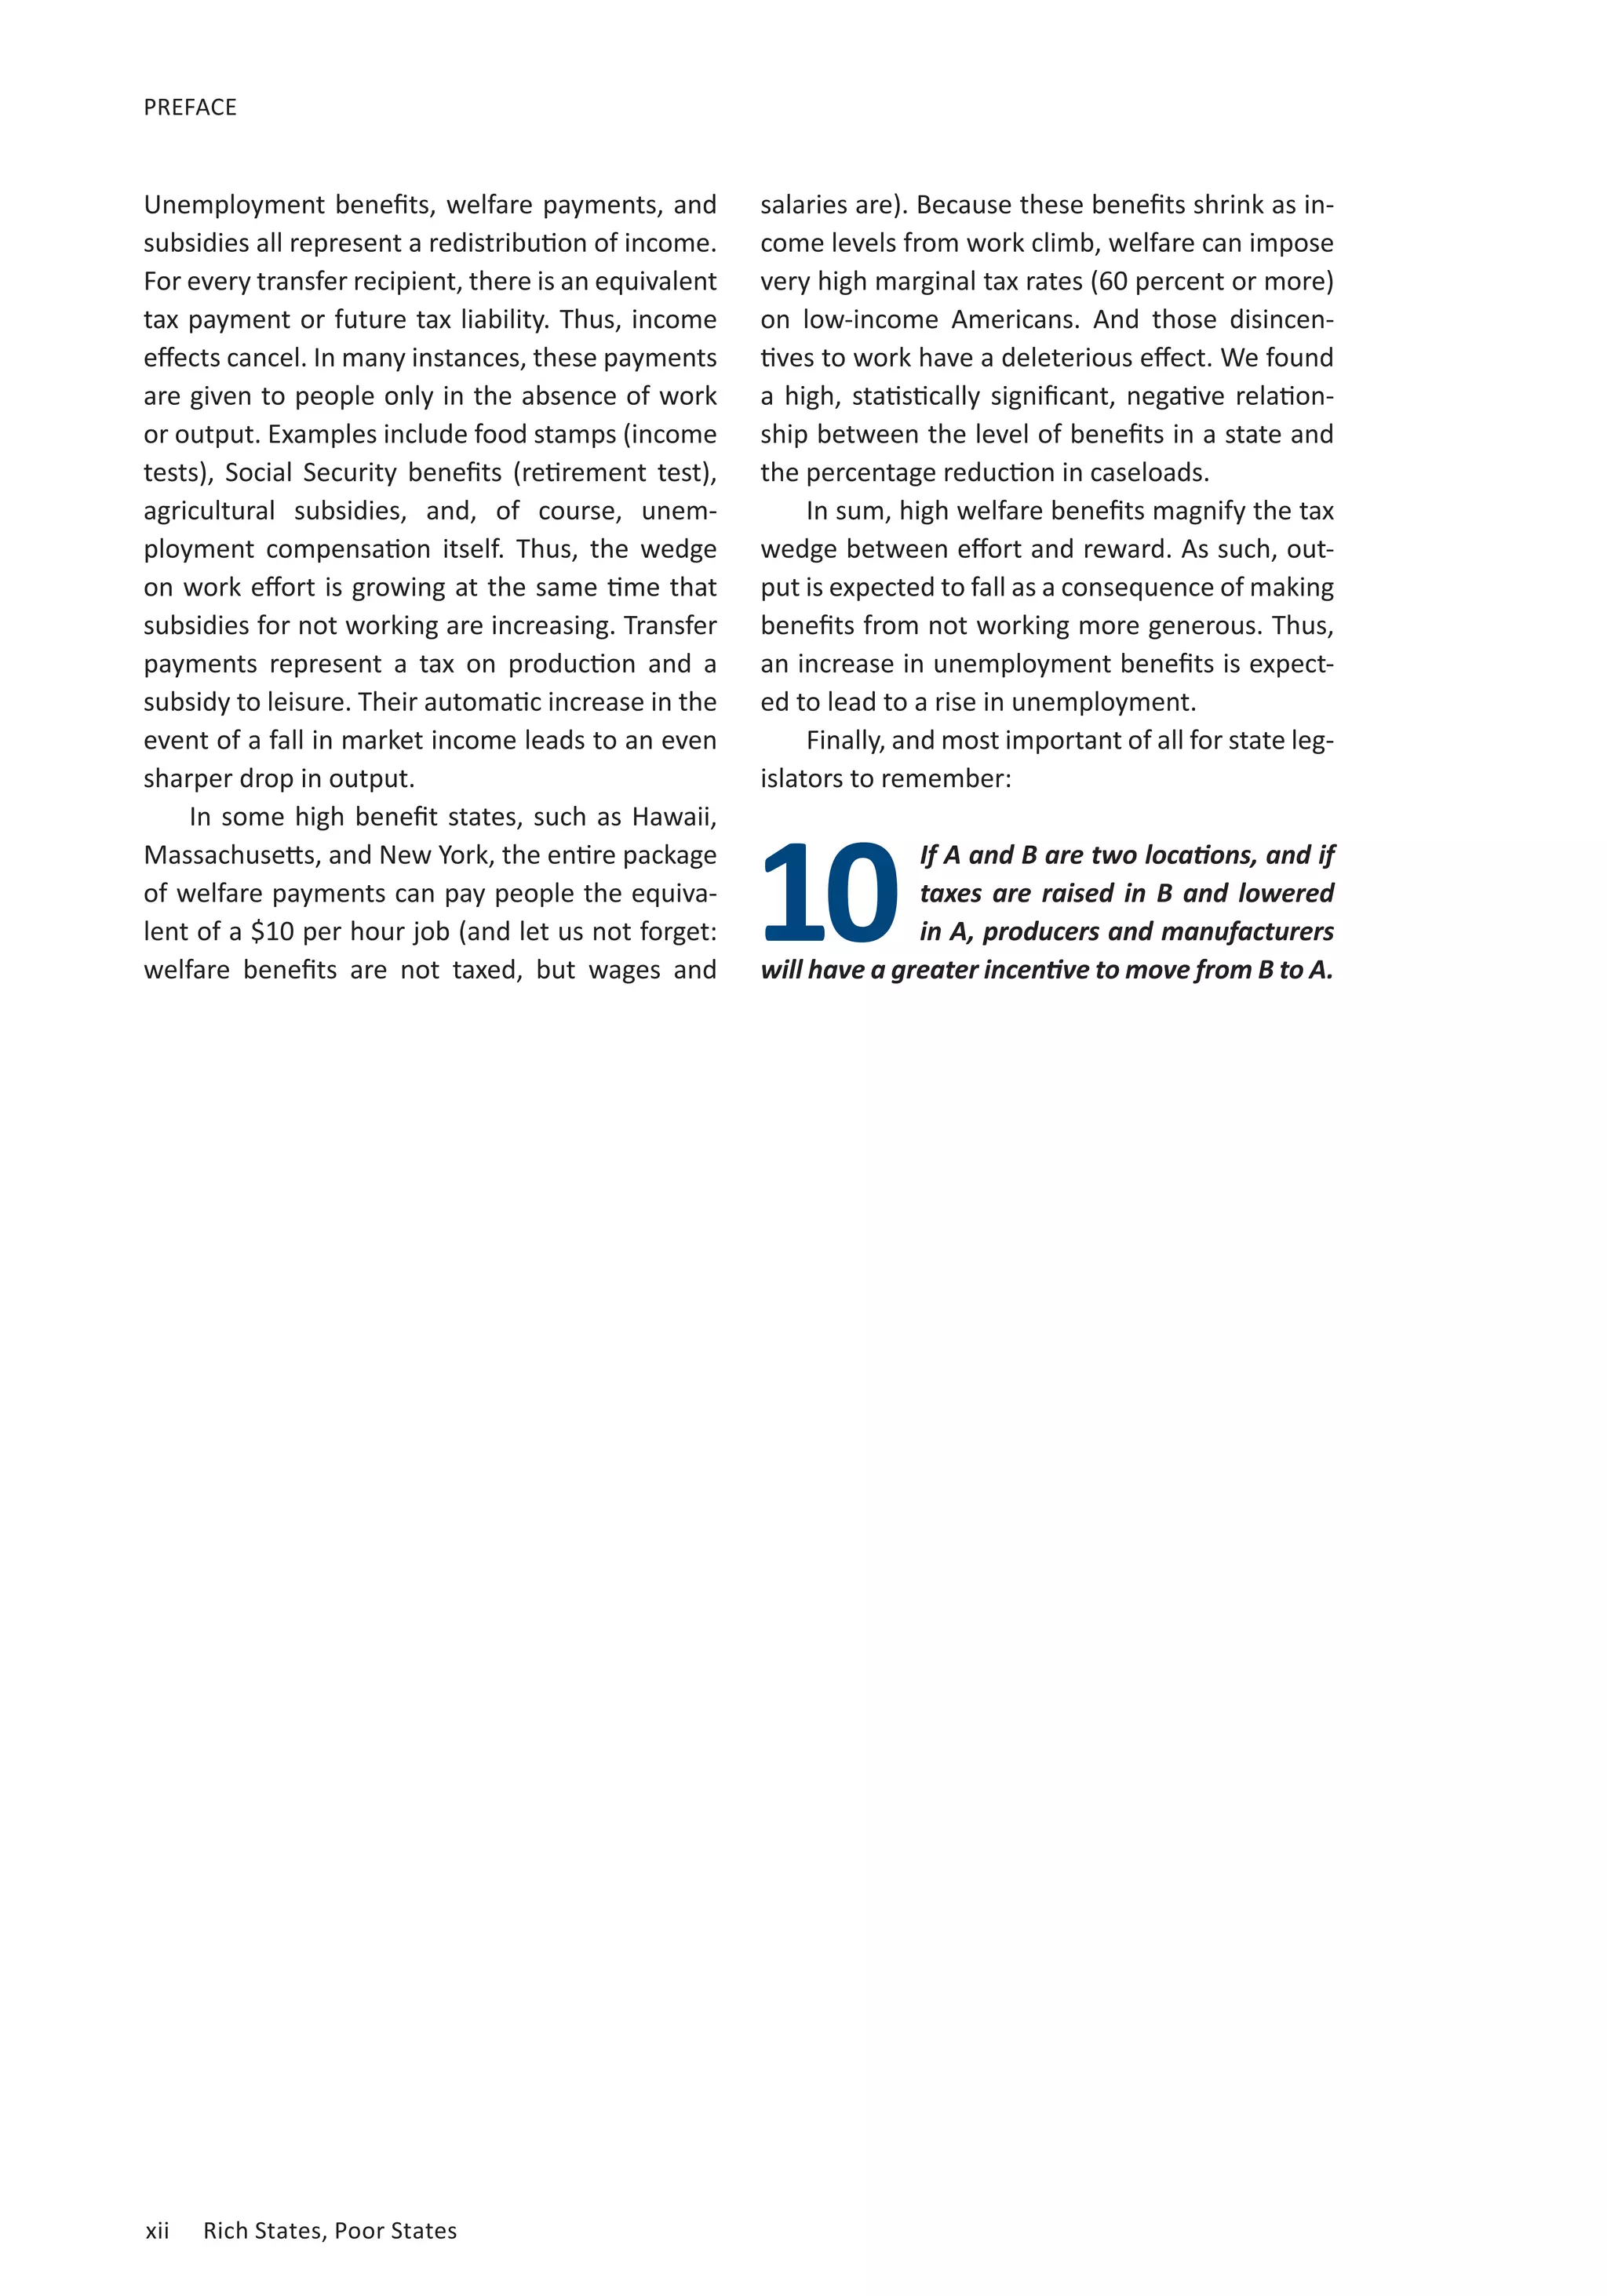
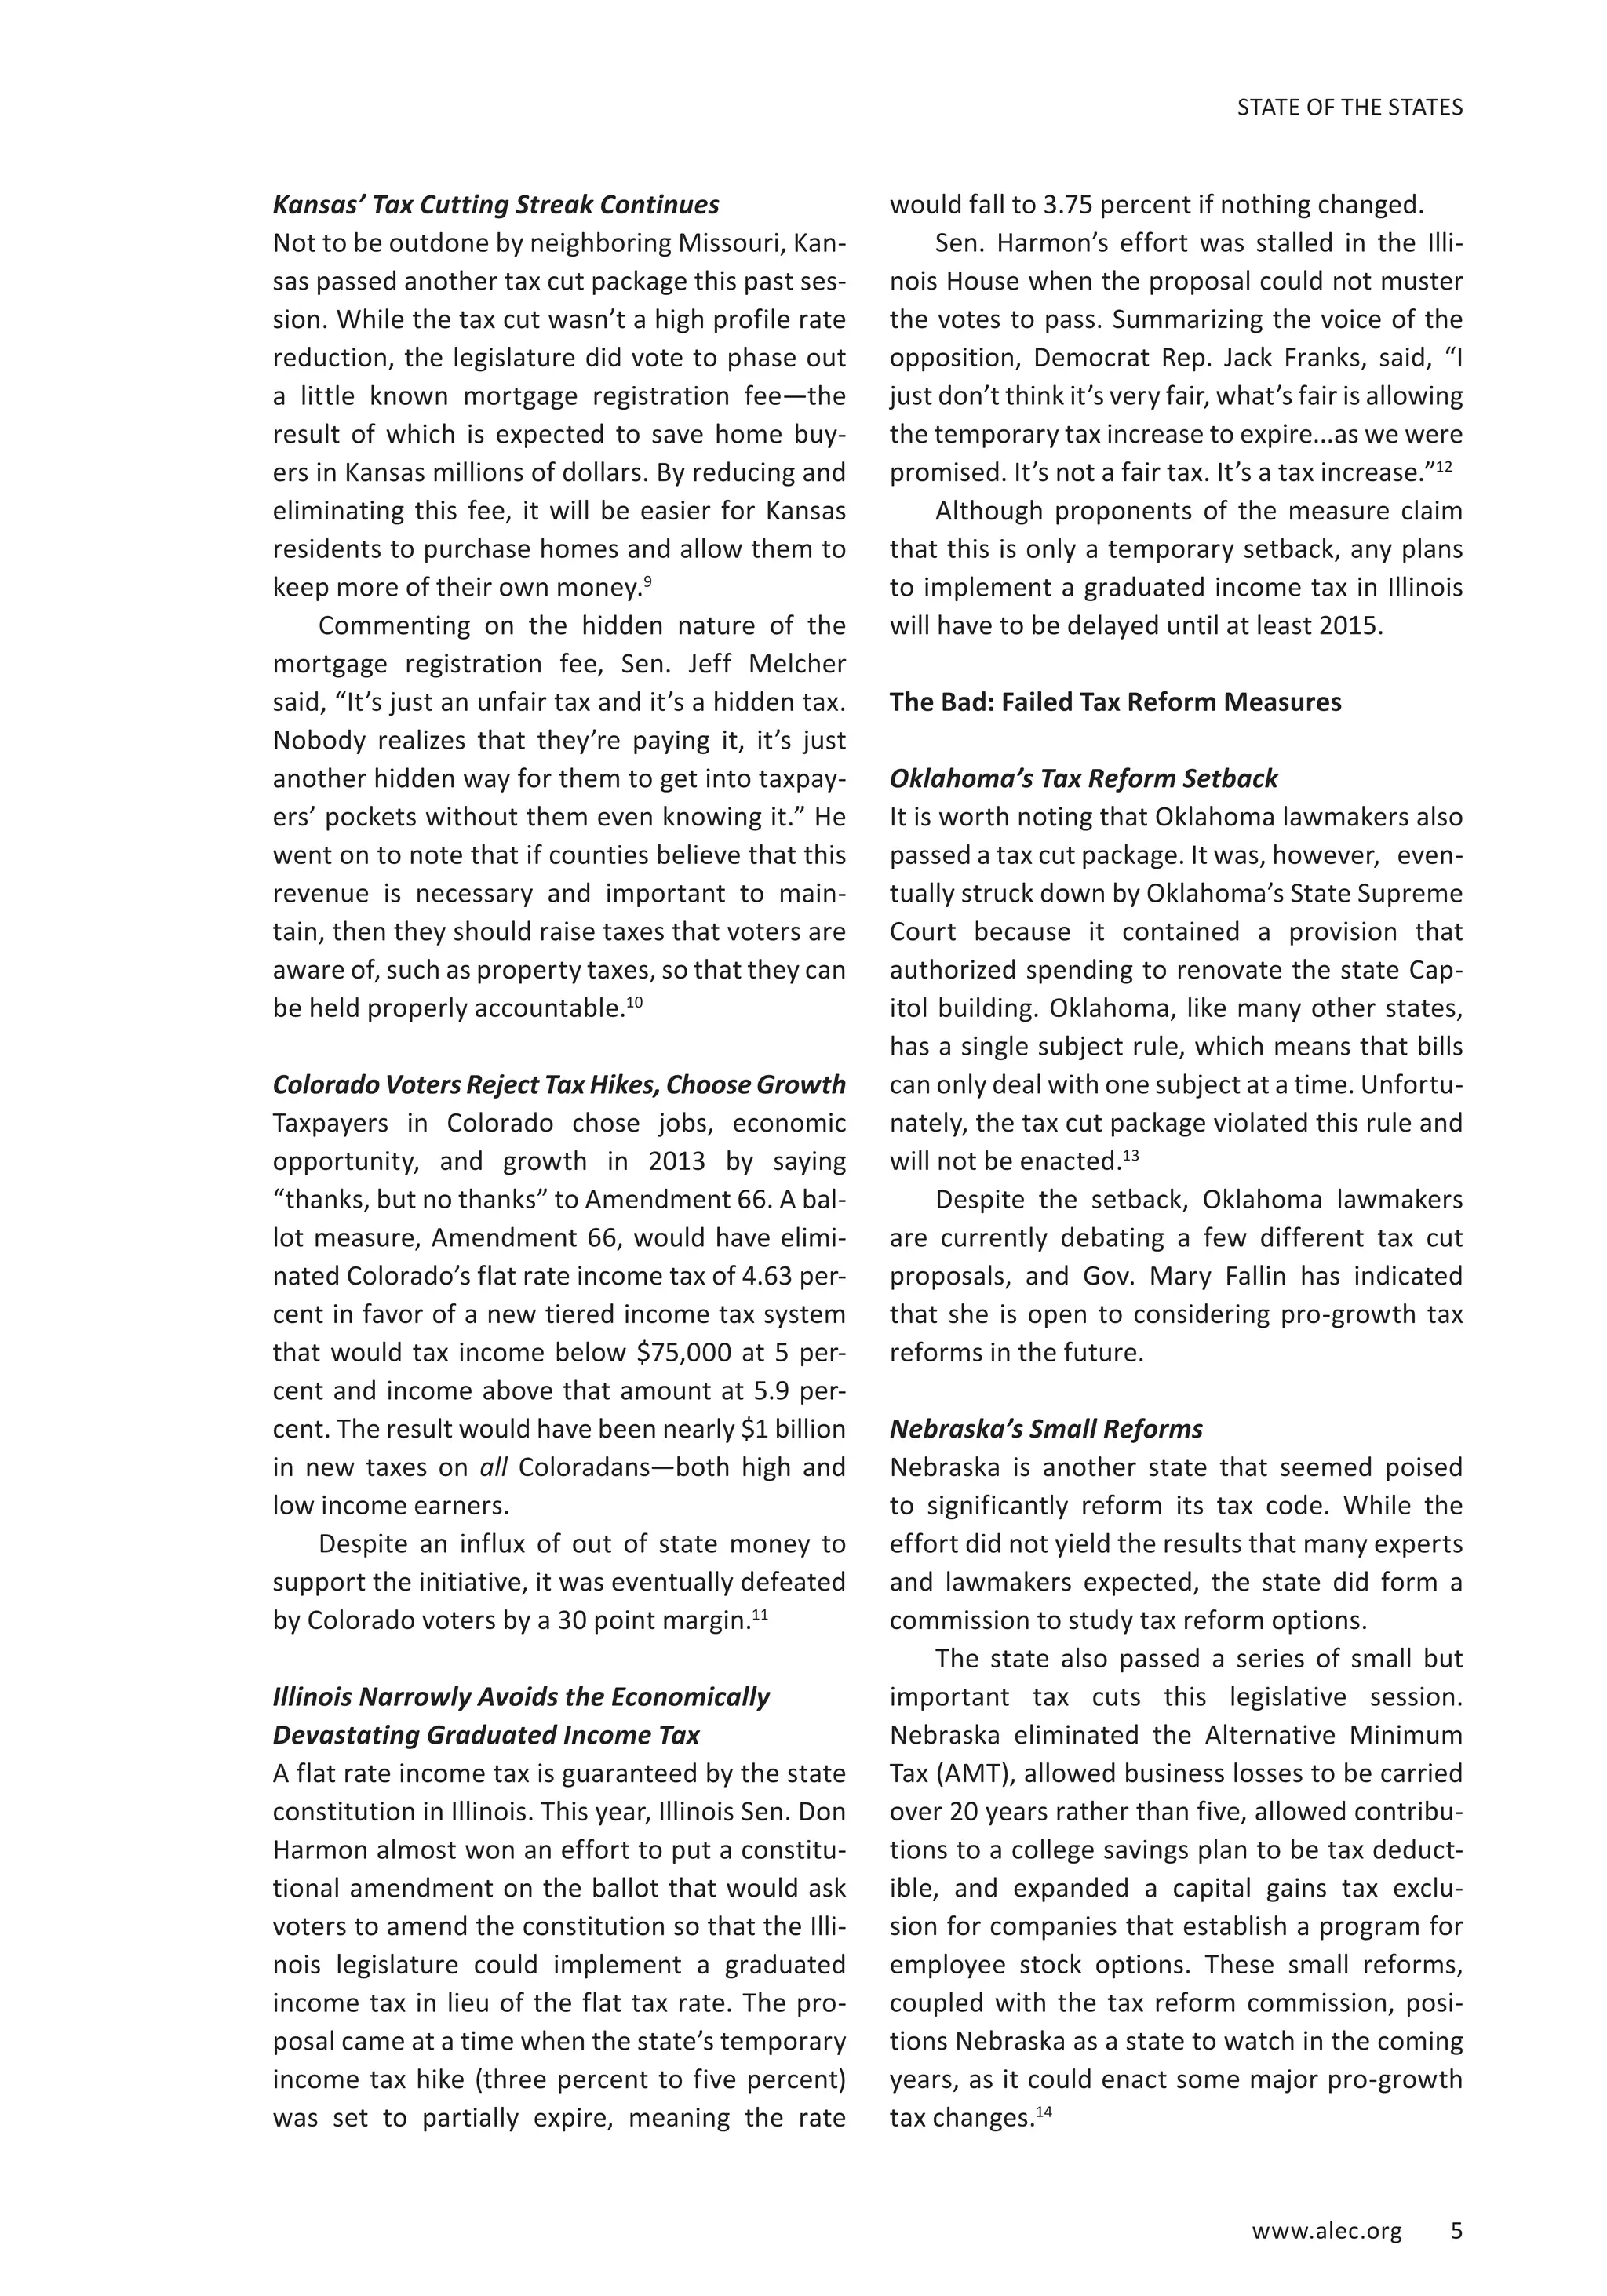
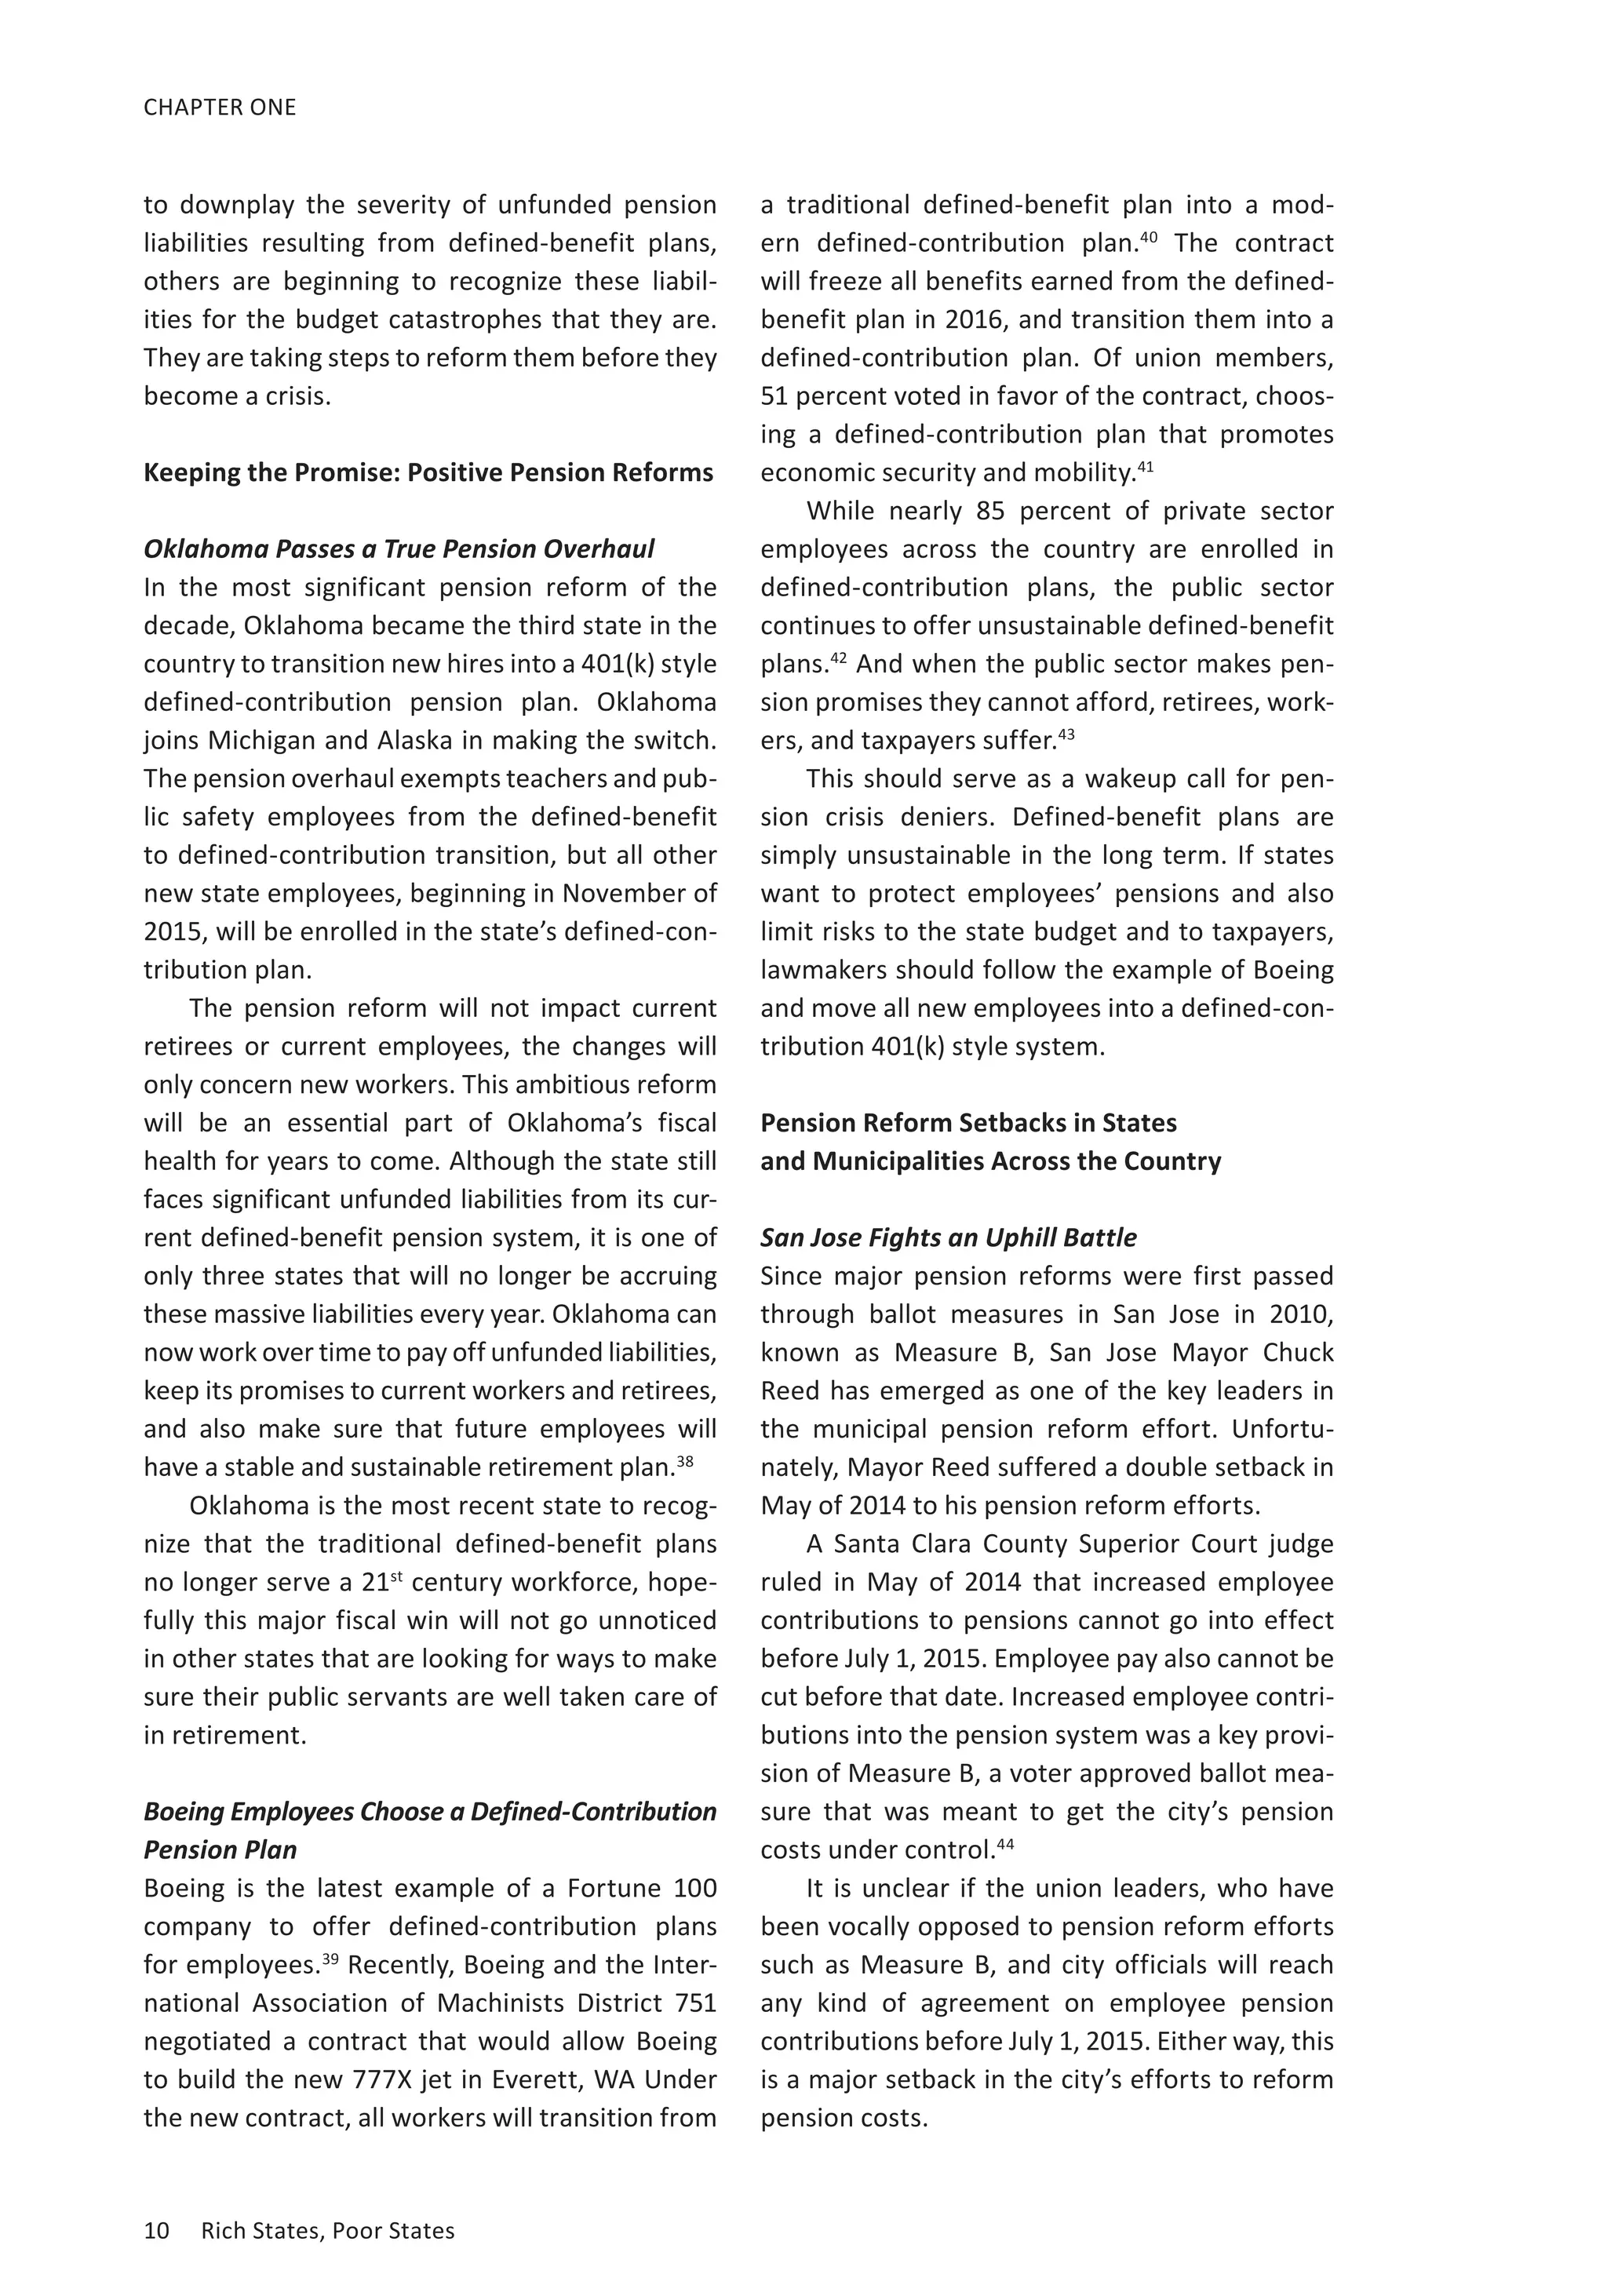
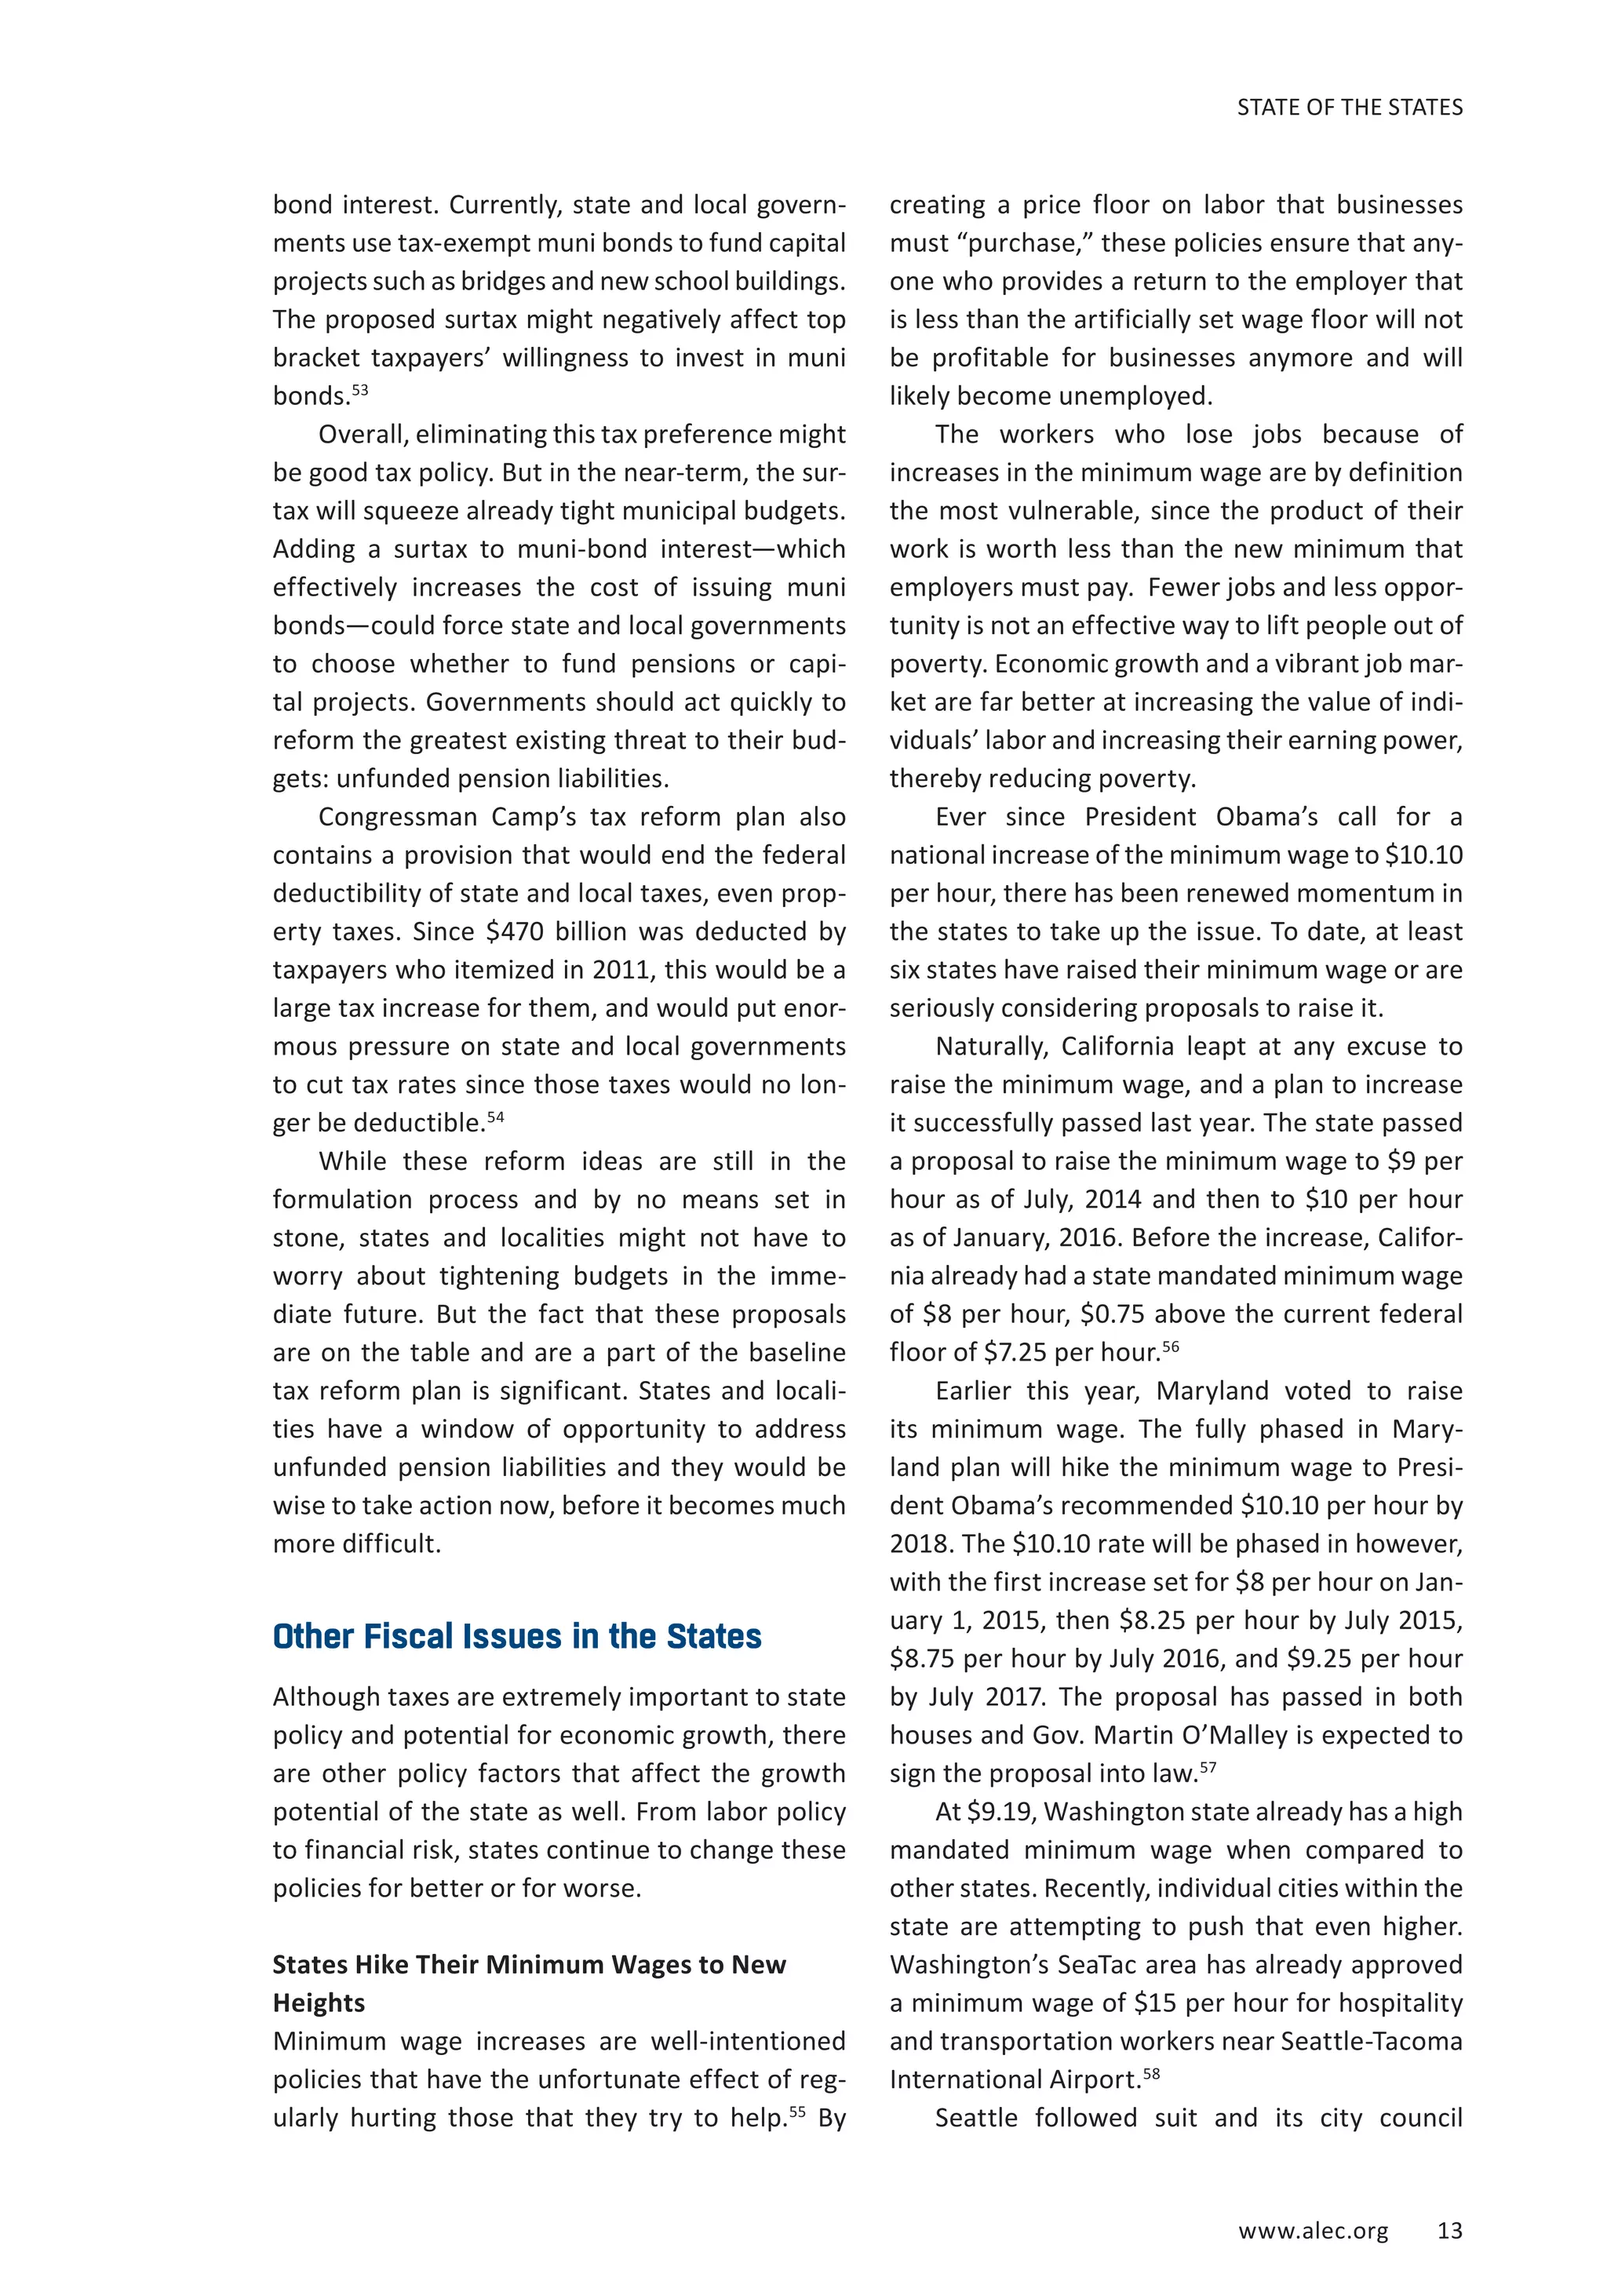
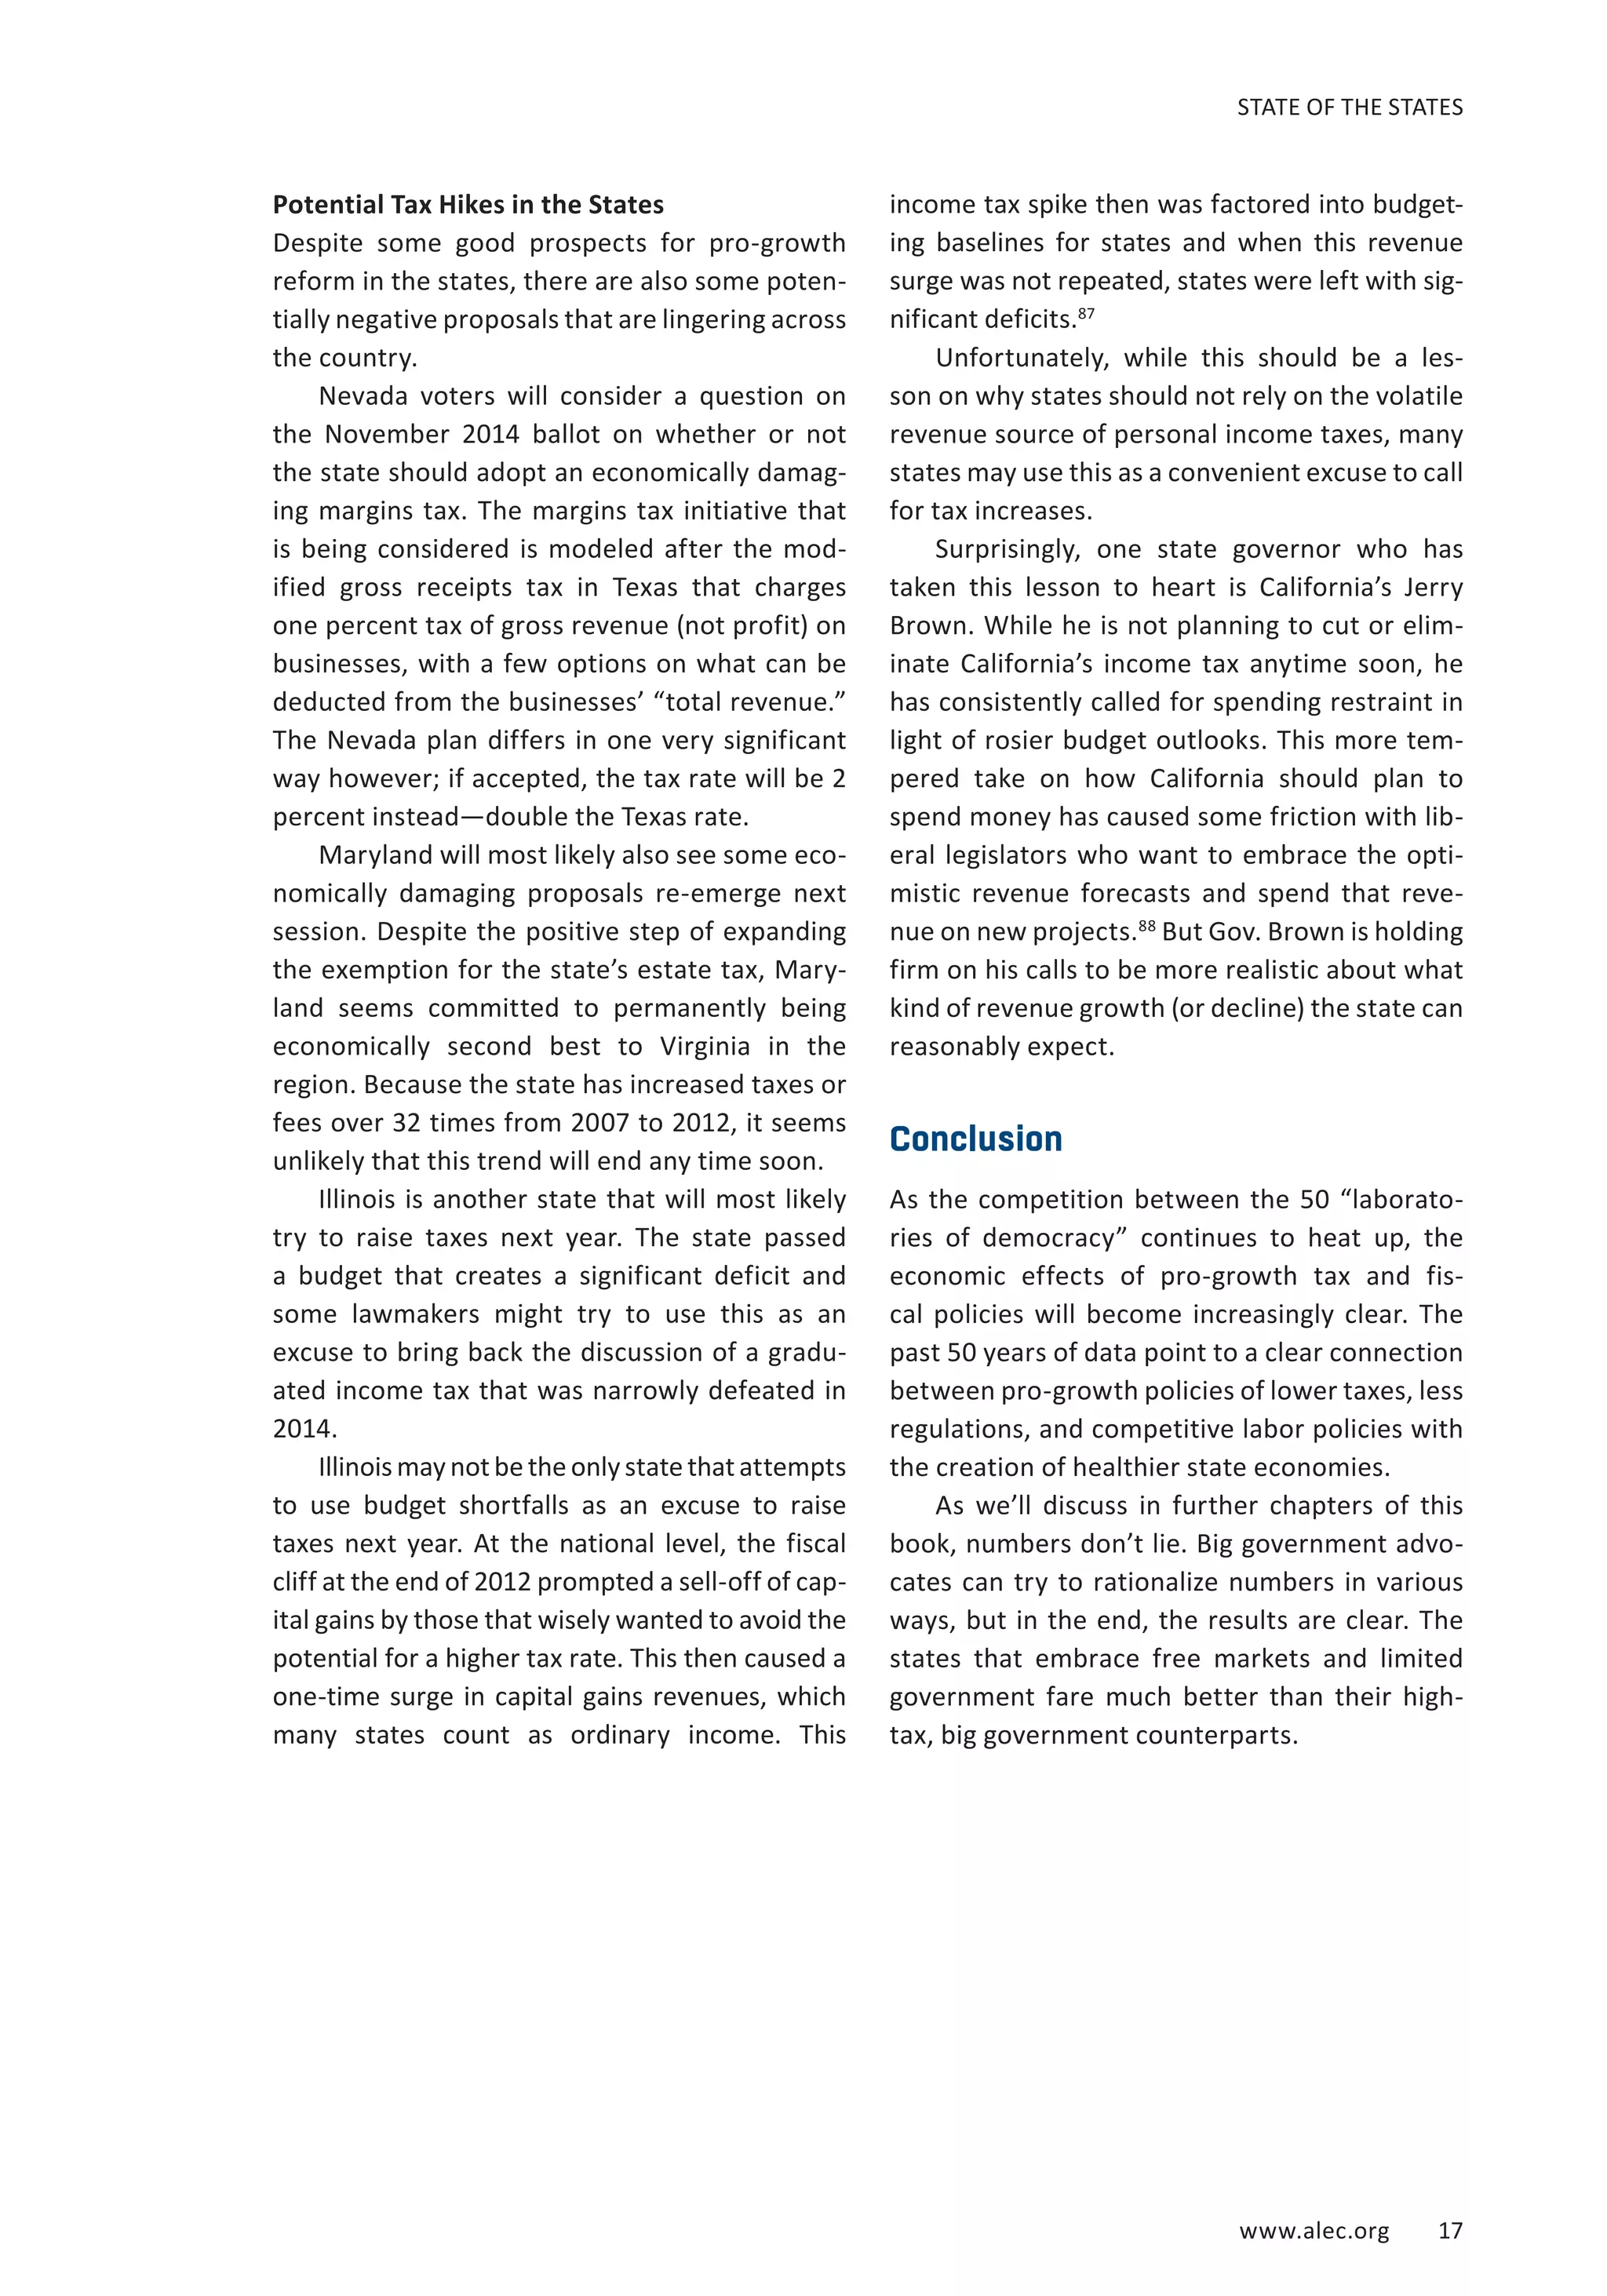
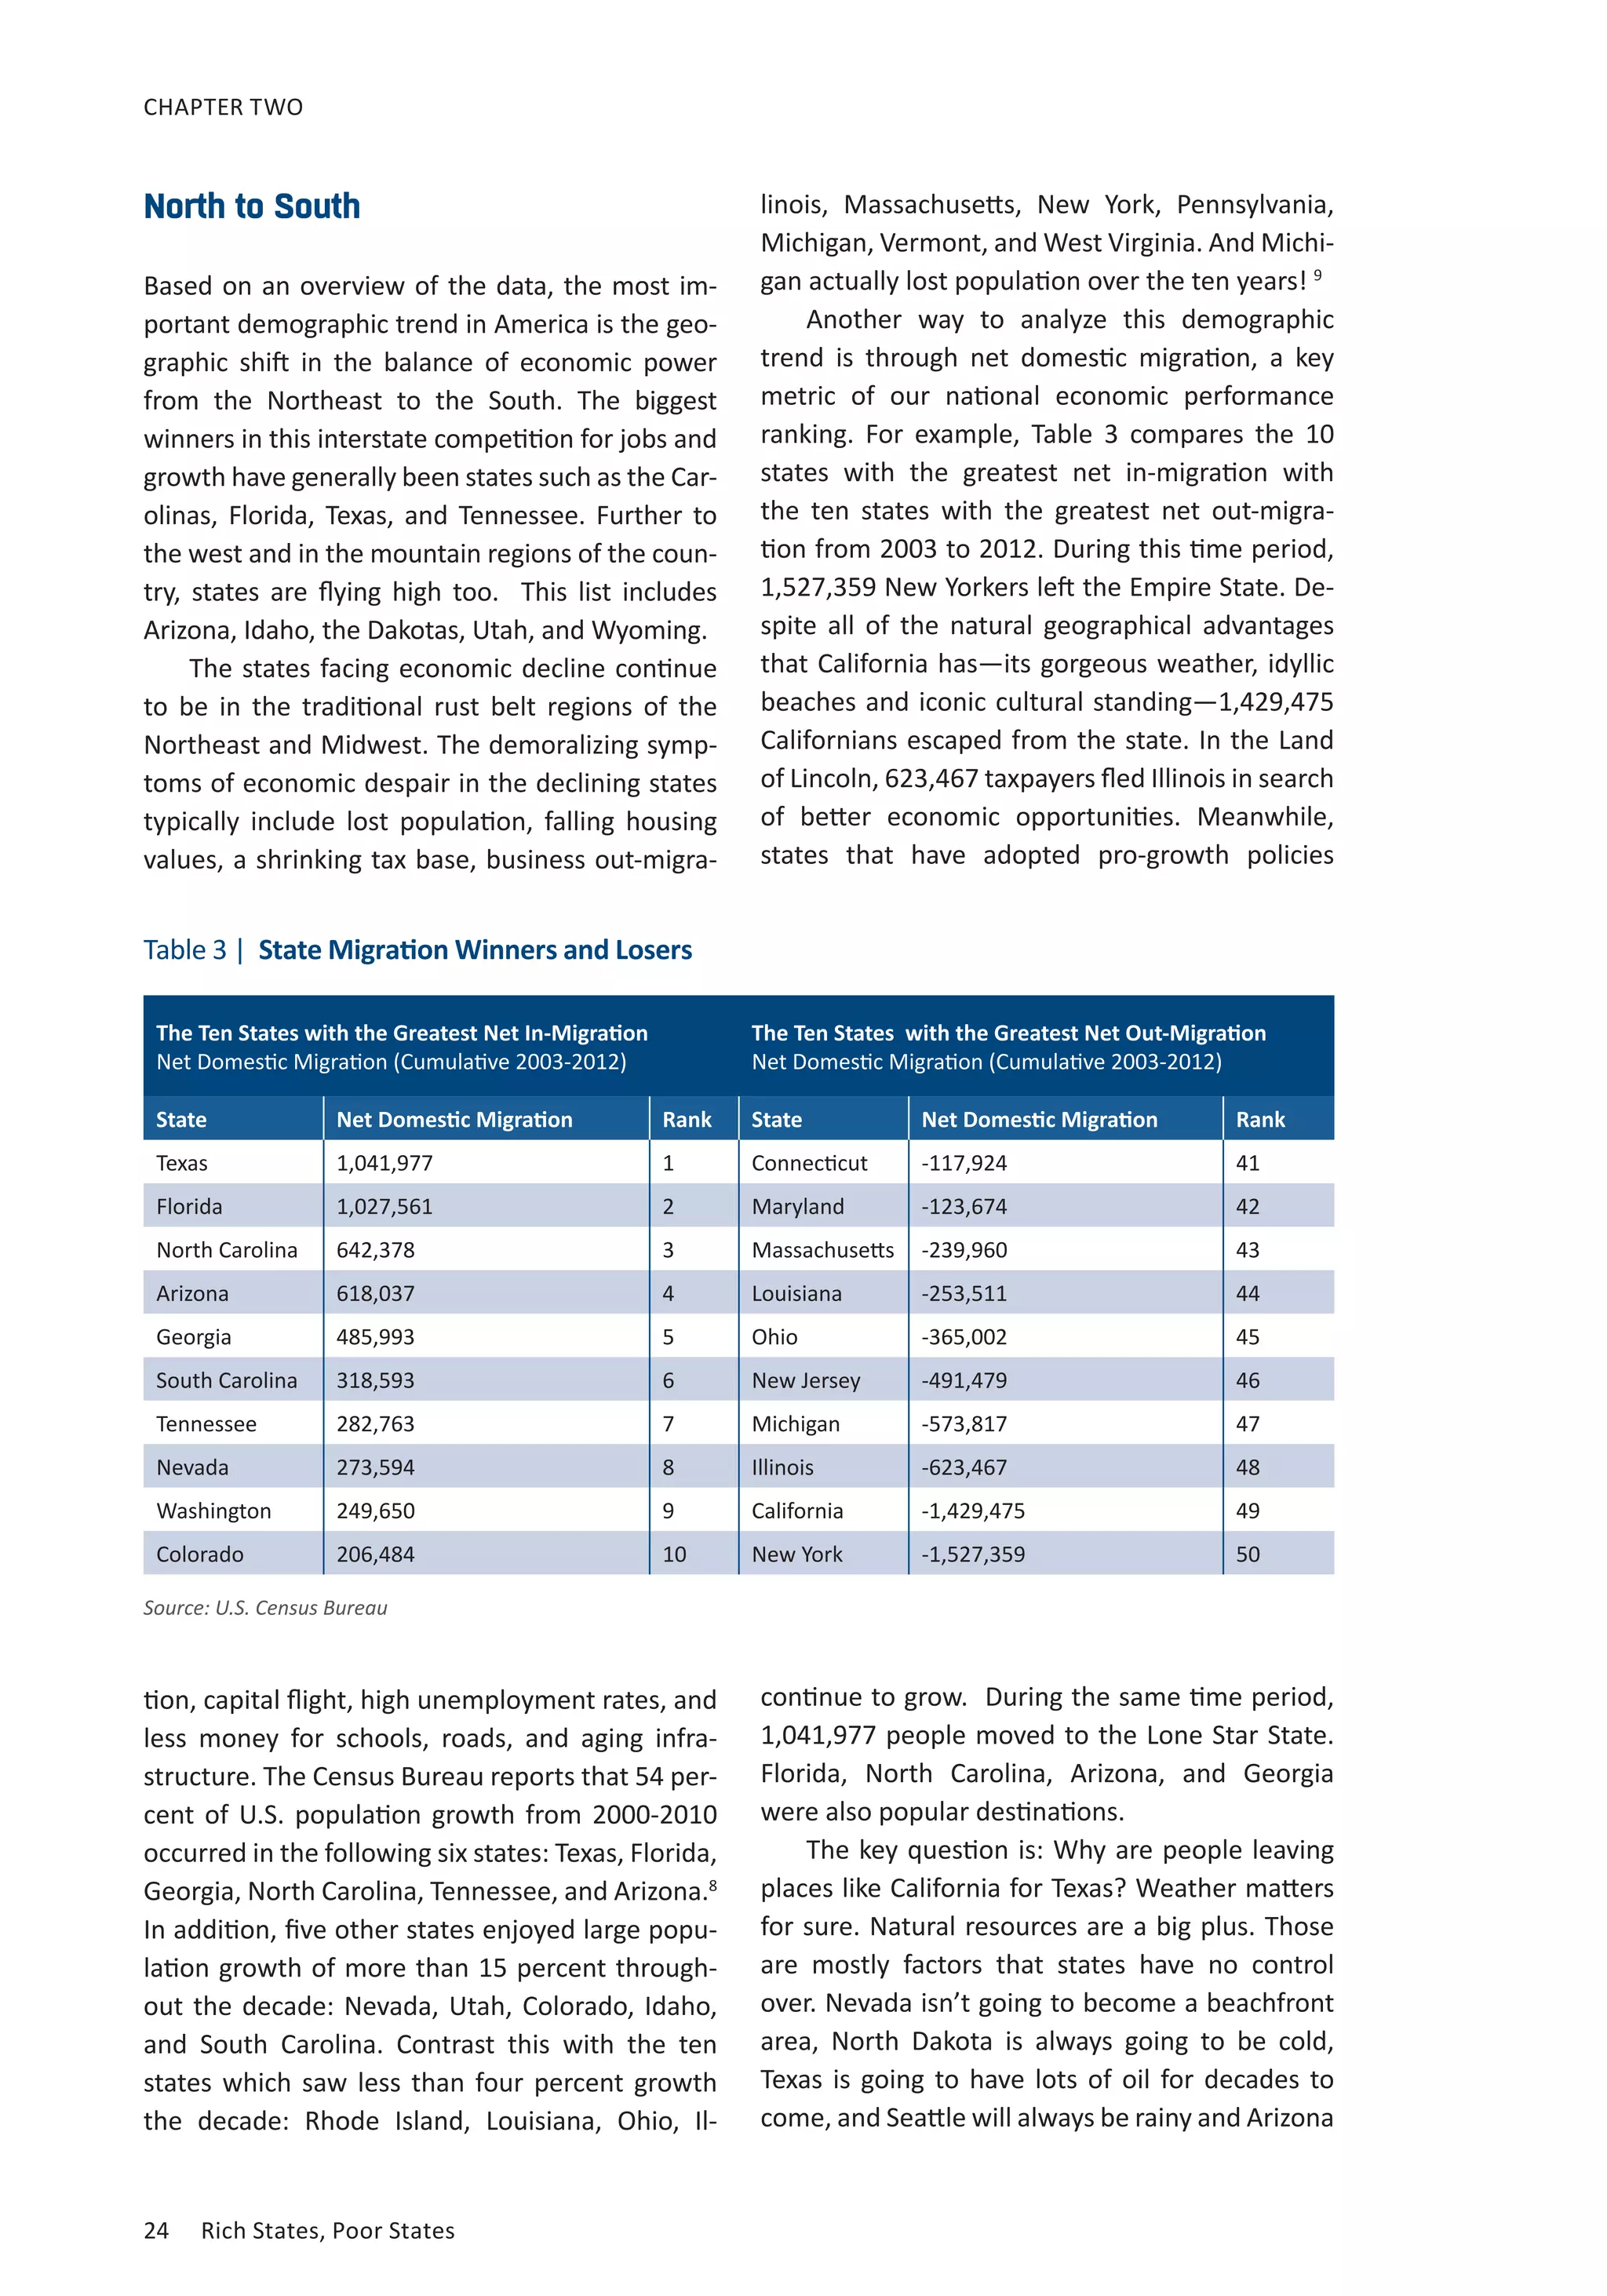
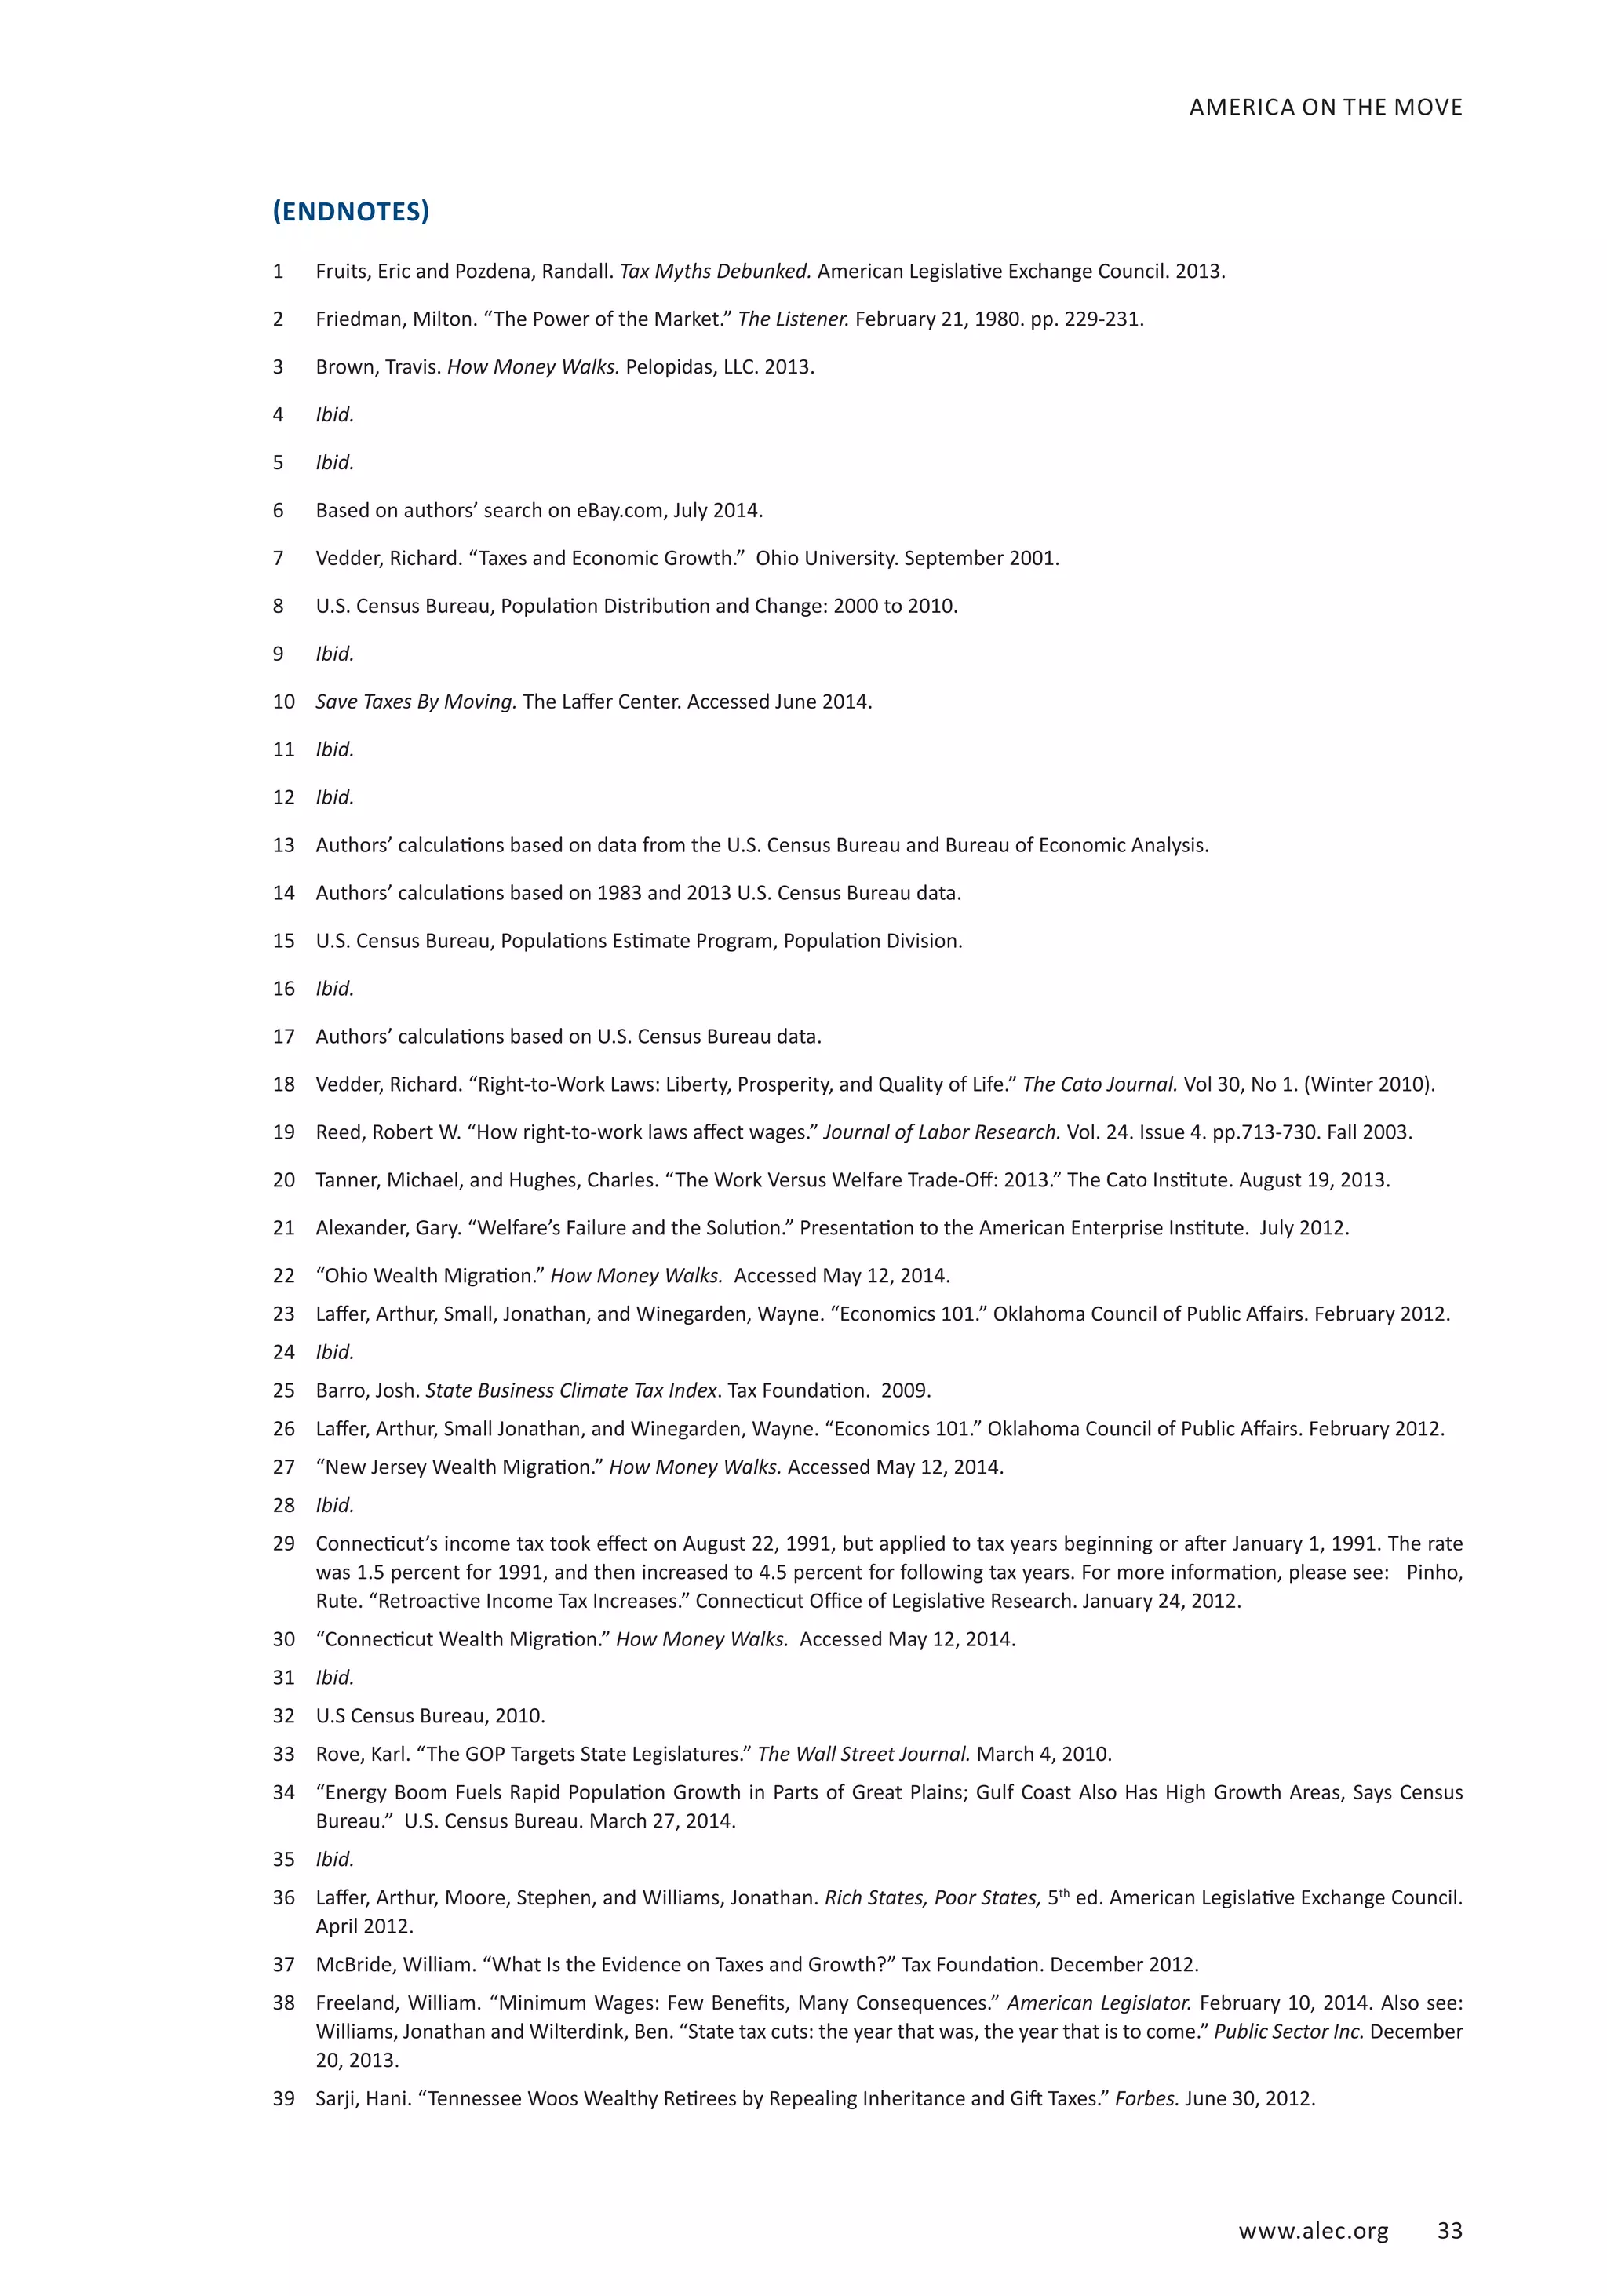
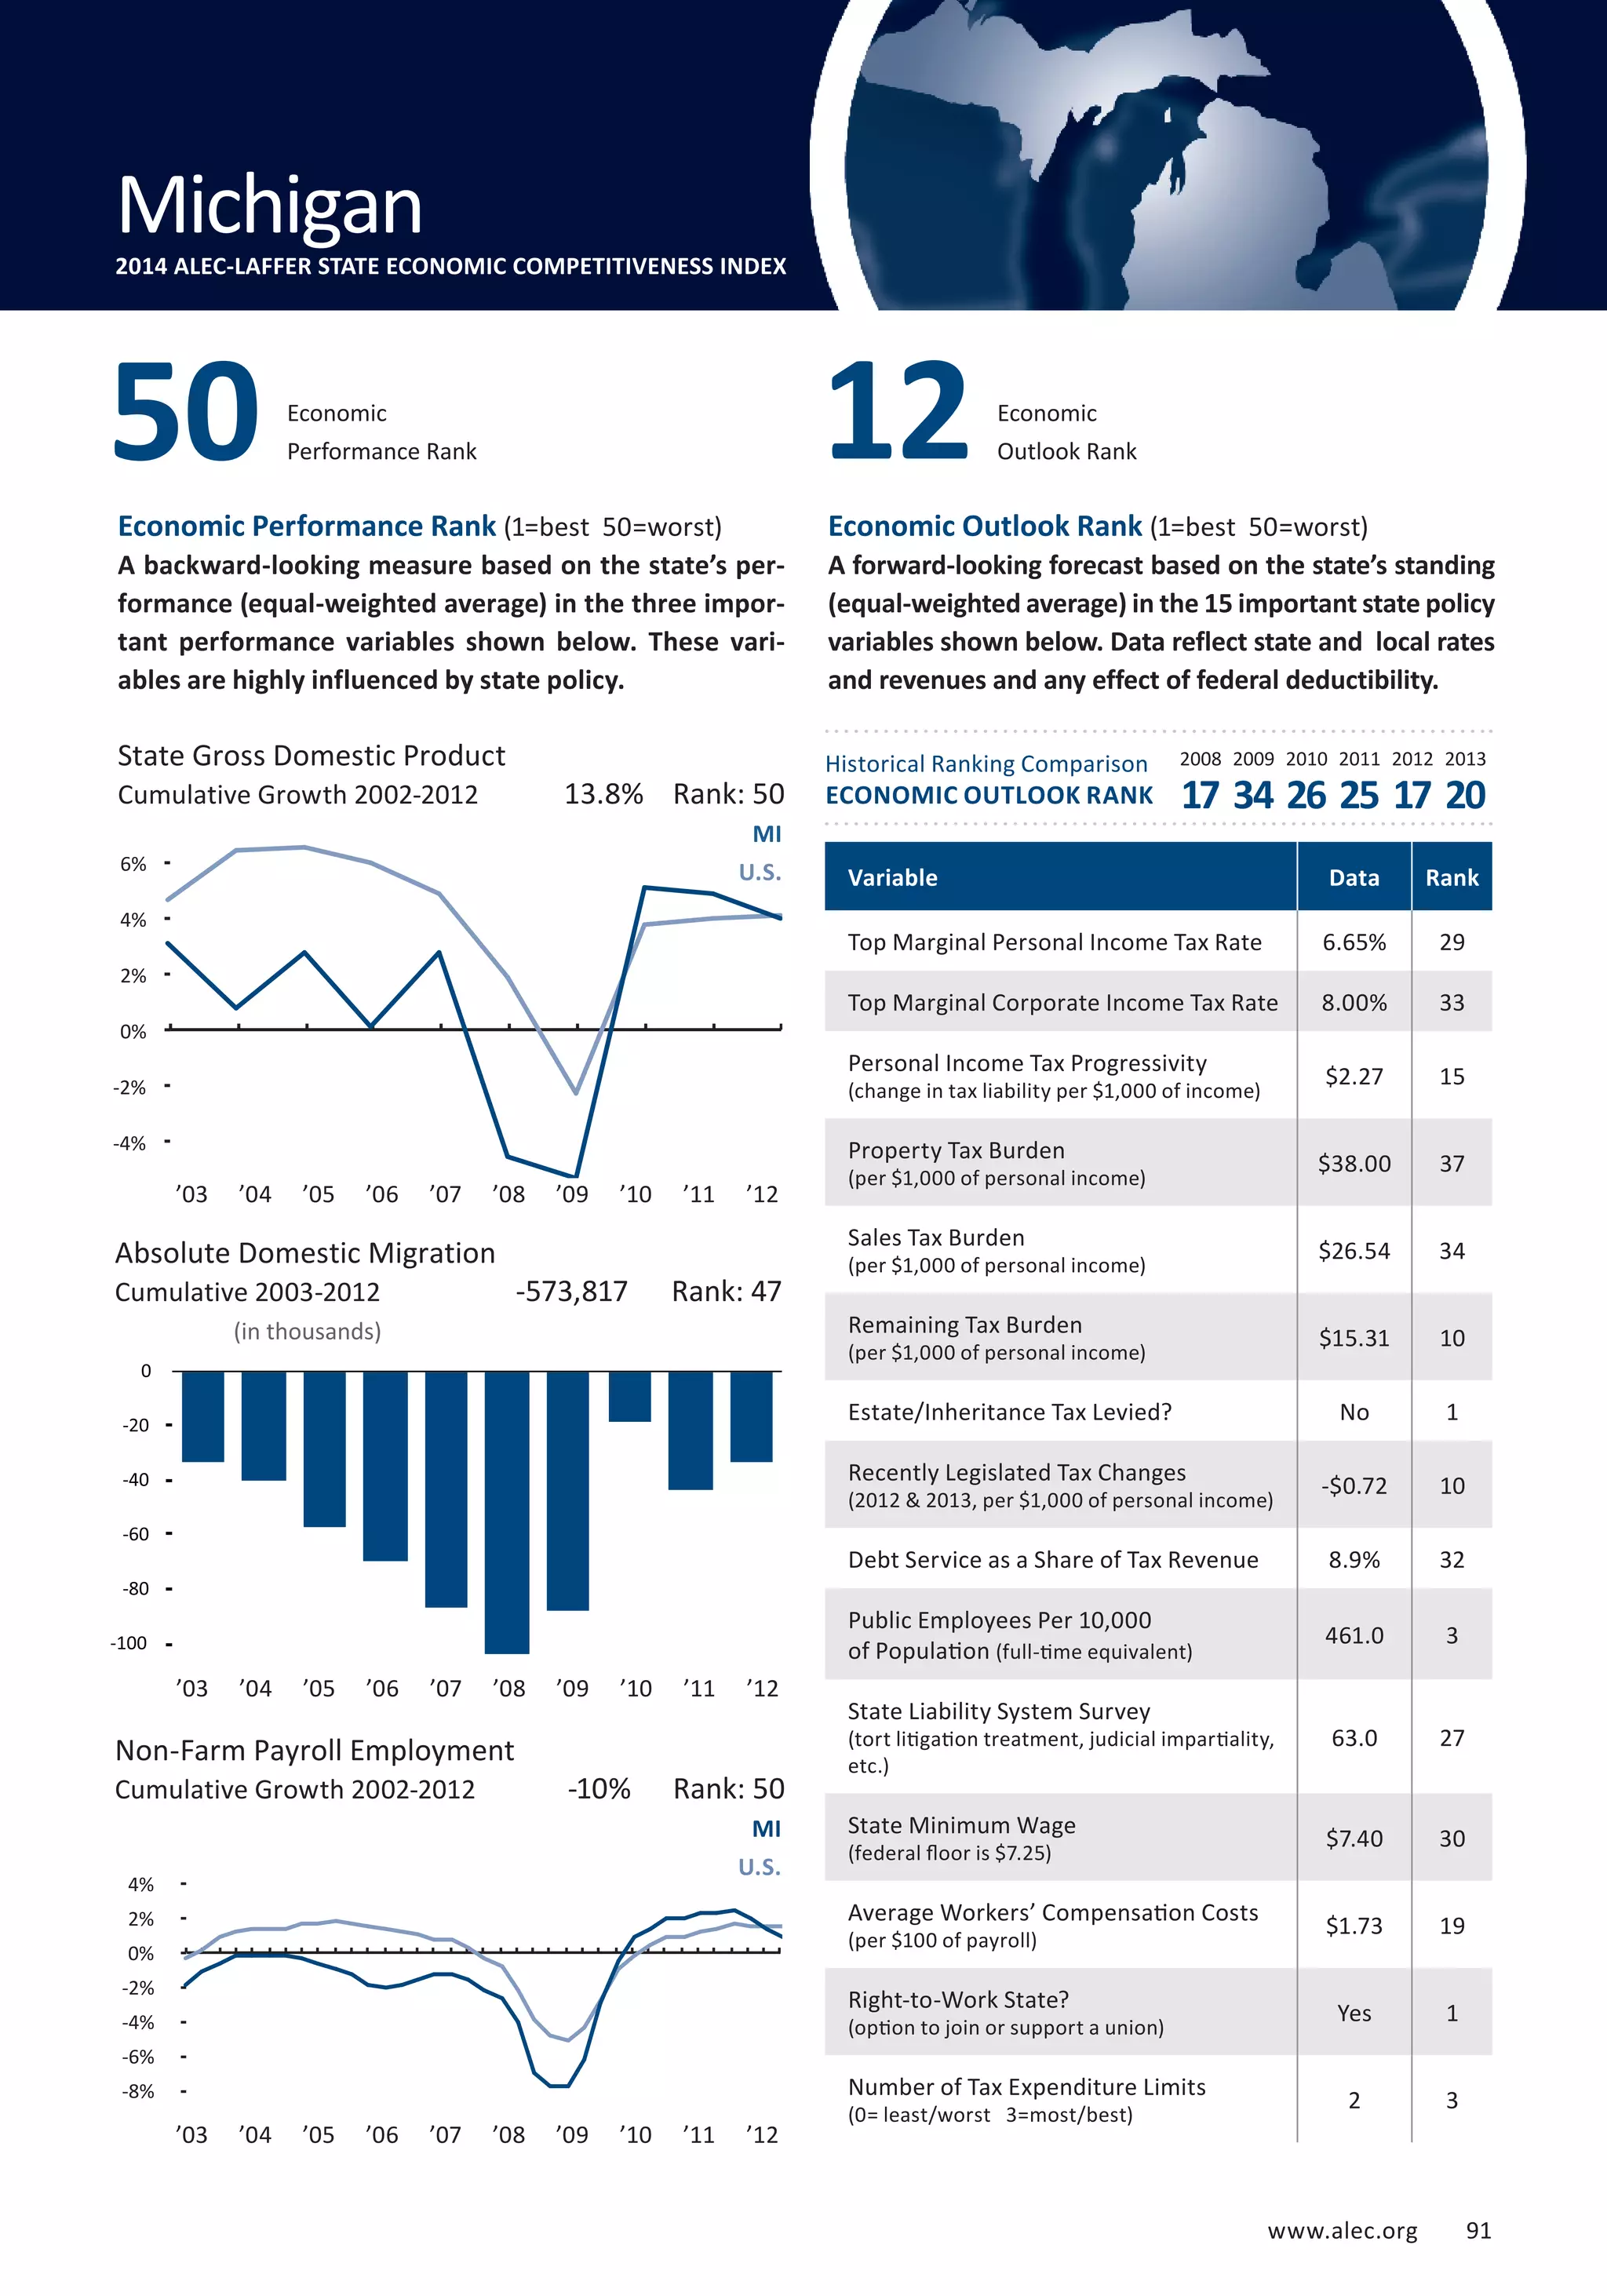
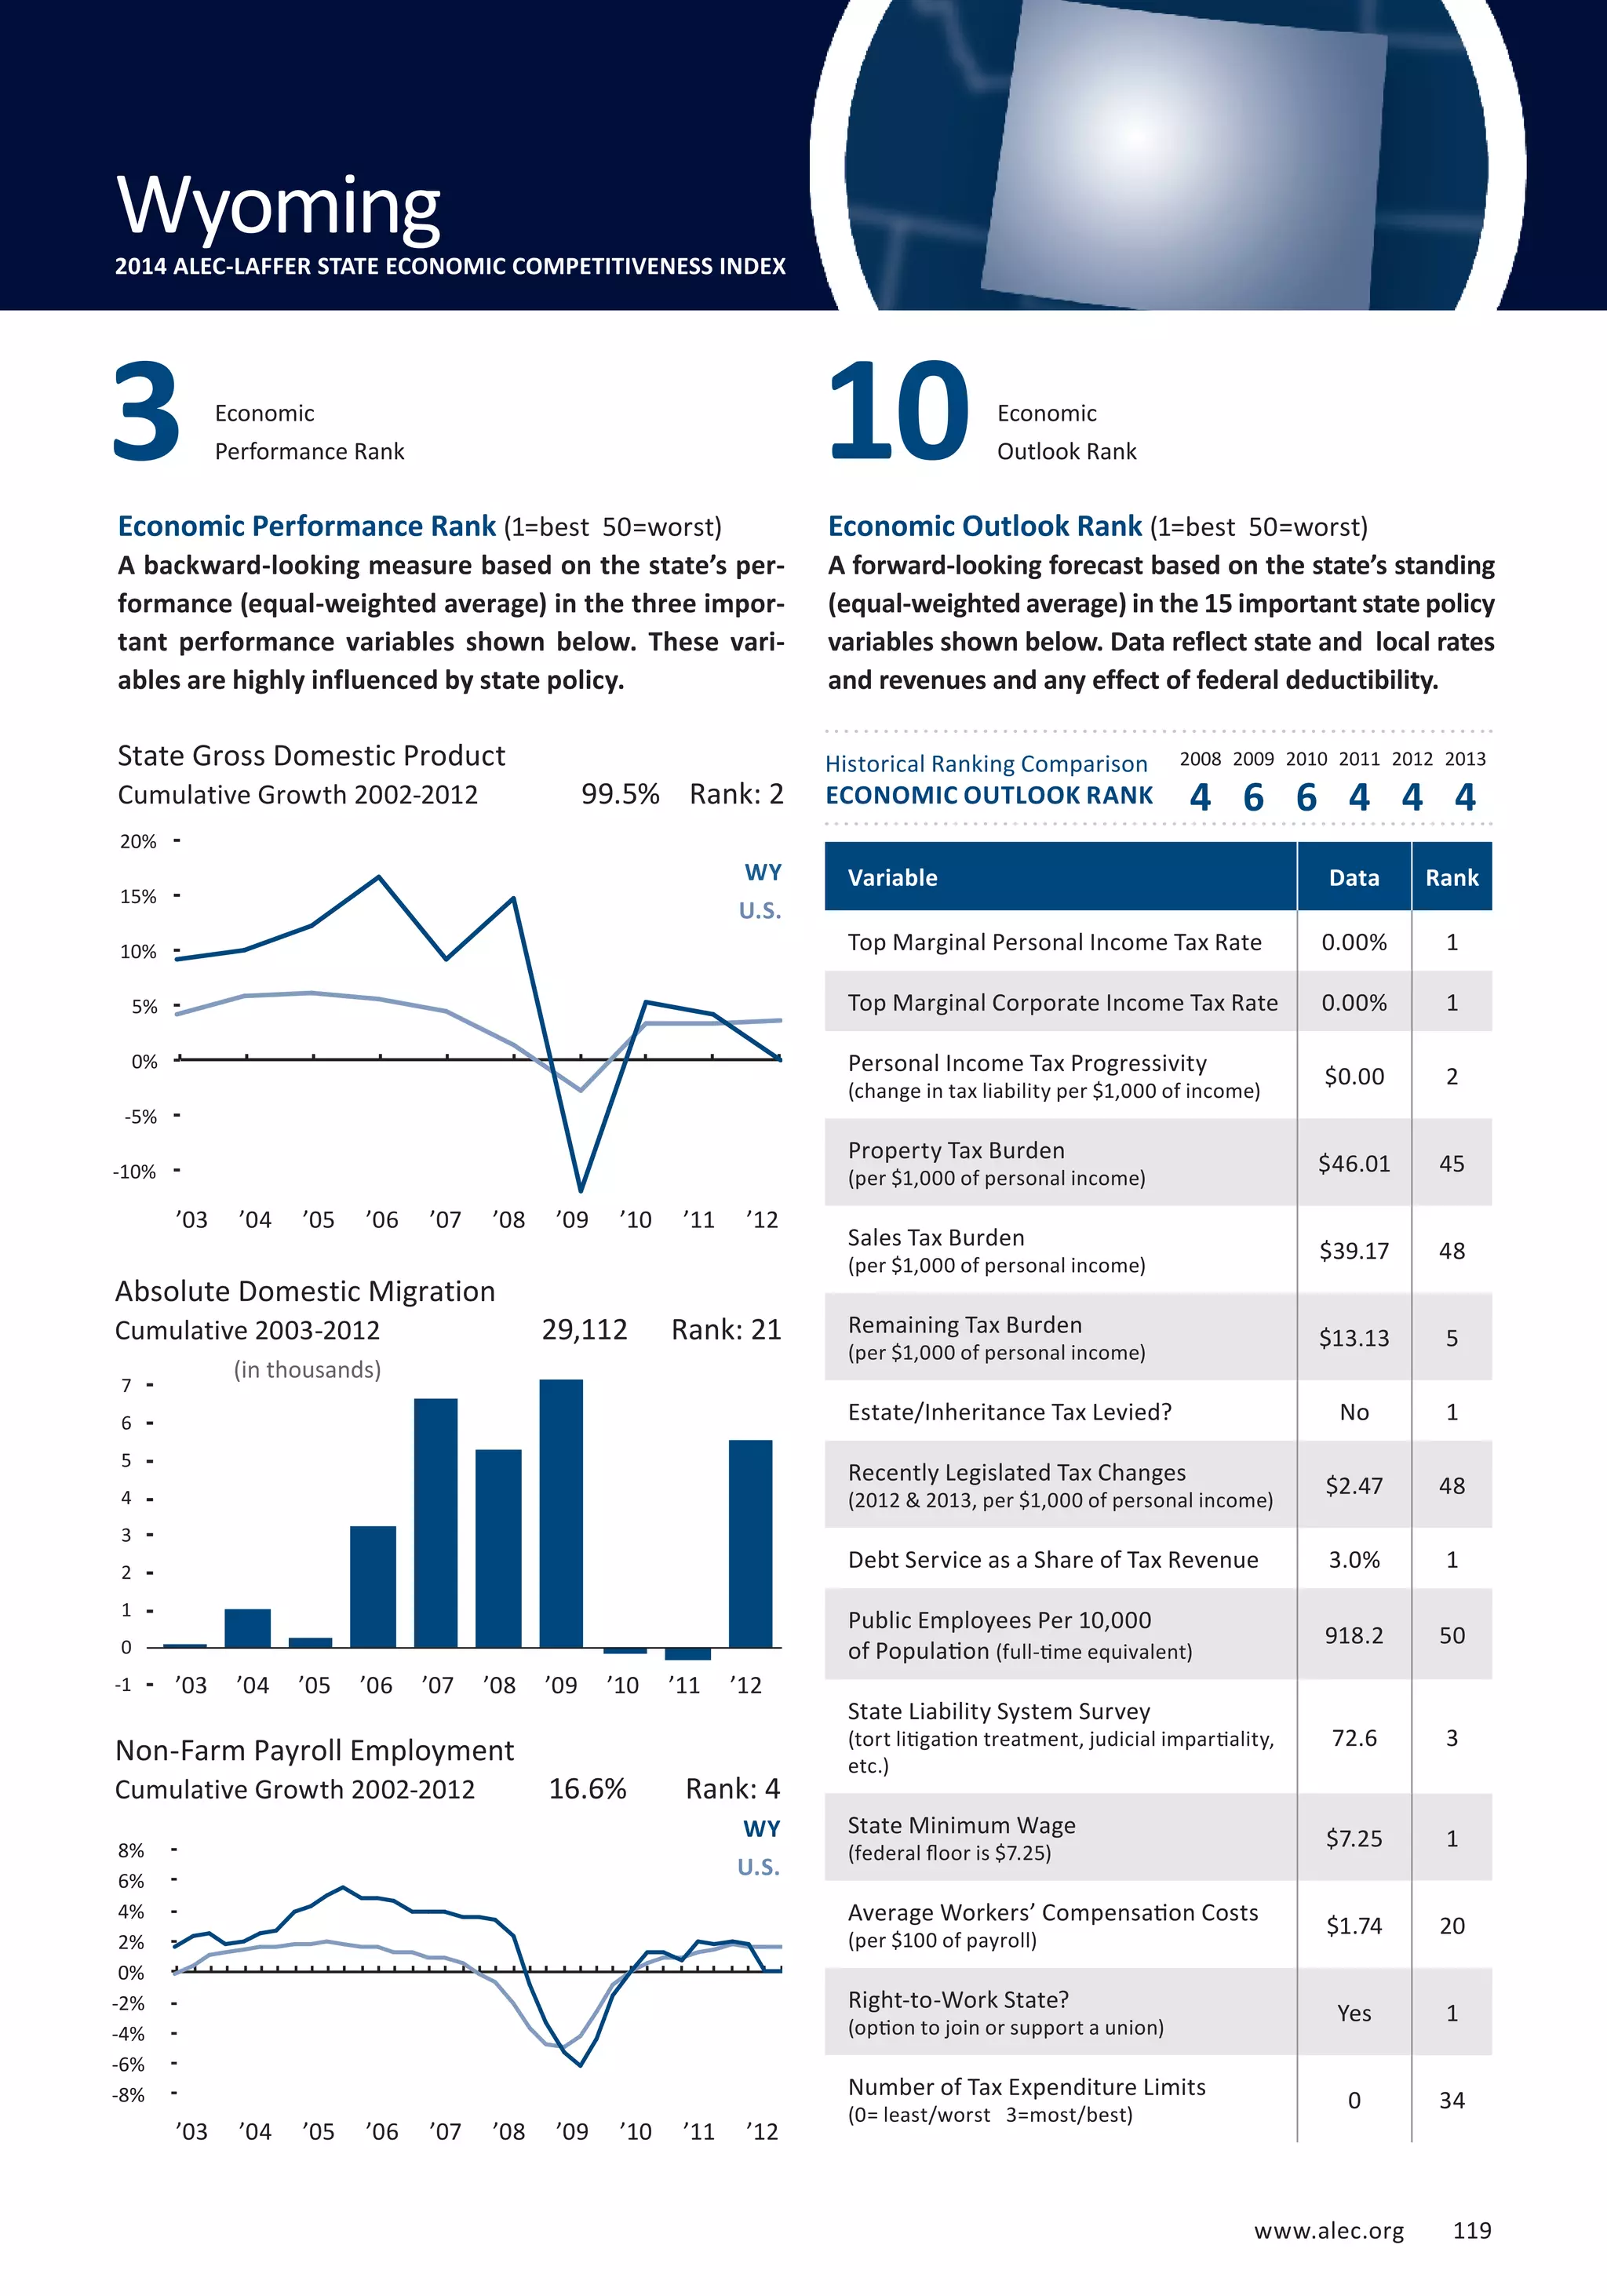
Figure 4 | Net New Taxpayers as a Percentage of Total Taxpayers by State
(Returns in + returns out, ranked highest to lowest)
92/93 93/94 94/95 95/96 96/97 97/98 98/99 99/00 00/01 01/02 02/03 03/04 04/05 05/06 06/07 07/08 08/09 09/10
ID NV NV NV NV NV NV NV NV FL NV NV AZ AZ SC SC TX TX
NV AZ AZ AZ AZ AZ AZ AZ FL NV FL FL FL NV NC NC SC DC
CO ID NC NC NC NC CO GA AZ AZ AZ AZ NV TX NV TX NC CO
OR GA GA GA FL FL GA FL CO OR ME DE ID NC AZ CO CO OK
AZ NC OR OR GA GA NC CO GA ME DE NC NC GA GA OR WY LA
MT CO TN TN CO CO SC NC NC DE SC ID SC SC TN AZ WA SC
WA TN ID FL OR SC FL DE NH NC ID SC TN ID TX WA DC ND
GA FL CO CO SC OR DE NH OR GA OR GA DE OR ID GA OK NC
UT OR FL ID WA TX NH SC DE SC VA TN OR TN OR UT OR AK
NC UT MT AR TN TN TN VA WA NH GA MT GA FL UT TN LA WV
TN MT AR WA ID DE ID ME ME MD TN VA AR AL WY NV TN NM
FL NM WA SC DE WA OR TN TX TX NC ME WA WA CO ID WV VA
AR AR UT UT UT ID TX ID SC CO MT AR MT AR WA WY AL SD
NM WA NM DE TX NH VA MN VA VA NH NM AL DE MT MT AR FL
AL TX DE NH NH KY WA TX ID TN NM WA TX CO DE DE AZ KY
DE DE MO TX AL AL MN AR MD ID KY HI NM UT LA AL GA TN
TX MS SC MO MO VA KY OR TN RI AR AL KY MT AL LA DE AZ
MN KY NH MT KY AR ME VT RI WA HI KY VA NM KY AR UT DE
KY AL TX NM AR MS MO RI CA NM WV TX CO WY AR KY NM AR
WV MO MS KY VA OK AR WA MN WY TX MS HI OK OK SD ND OR
MO SC KY MN MS MO MS KY VT KY RI SD MO KY NM WV KY AL
SC SD AL MS OK KS MD MD MO AK MD NH ME MO FL OK SD WA
MS NH VA OK MN UT VT MO KY VT MO MO UT HI WV DC VA GA
VA VA MN AL KS CA MA WI AR WV WA WY NH WV SD MS MT MT
WI MN IN VT IN MN MT MT DC HI AL OR WV VA MO NM AK UT
SD WY SD VA NM MD CA CA HI MO VT WV MS DC MS VA ID MD
IN OK VT IN ME MA RI MS WI AR AK AK OK SD DC IA MO NE
WY IN WI WI VT VT AL IN AK OK MS CO SD NH VA MO MA HI
OK WI NE NE MA ME WI AL MA MT OK MD WY AK ME HI NV MO
AK AK OK ME MT IN DC SD MT WI PA VT DC IN MN FL IA IA
NH VT WY WV MD AK OK MA UT AL WY DC MD ME NH ND KS ID
VT WV MD WY AK NM KS UT AL MN WI WI IN MN IN KS NE KS
KS MD WV MD WI MT IN WY OK CT CO OK VT PA PA IN MS MS
HI KS KS SD NE WY UT DC SD MS SD PA AK VT AK ME PA VT
MD NE LA MA CA WI AK NM WY PA IN LA PA MD KS NH MD PA
NE HI ME MI WY WV SD KS IN UT CT ND WI IA IA AK FL MA
ND LA ND AK WV RI WV OK MS DC MN UT MN WI ND PA IN NV
IA ND MI ND LA LA WY CT NM KS LA IN IA KS HI MN HI WY
PA ME IA KS MI DC NM MI CT SD NE MN LA NE WI NE CA CA
ME PA OH OH OH NE NE AK NJ IN DC IA NE MS VT MA VT IN
OH IA MA IA RI IA CT WV KS CA CA NE KS ND MD WI NH NH
LA MA AK LA SD NJ NJ NJ WV NJ KS RI ND IL IL MD MN CT
IL OH HI PA IA SD MI PA PA LA ND KS CT CT NE IL WI WI
NJ NJ PA IL ND OH IA HI MI NE UT CA IL MA MA CA IL ME
DC IL NJ HI NJ CT OH NE NE MA NJ CT NJ OH CT VT ME RI
RI MI IL NJ HI PA LA OH OH OH IA OH OH NJ CA CT CT MN
MA DC CT RI DC MI PA IA IL IA OH NJ RI CA OH NY NY NJ
MI RI RI CT IL HI IL IL IA MI MI IL CA RI RI NJ NJ NY
CT CT DC DC CT IL HI LA LA ND MA MI MA NY NJ RI OH IL
NY NY CA CA PA ND ND ND NY IL IL MA MI MI NY OH RI OH
CA CA NY NY NY NY NY NY ND NY NY NY NY LA MI MI MI MI
Cleveland’s Lakeview Cemetery, he surveyed the
Cleveland where he had been raised. Today, the
city is a hollowed-out, crushed shadow of its for-mer
self.
In Youngstown, where he was born, a city or-dinance
requiring abandoned houses to be torn
down and grass planted where they once stood
has transformed Youngstown from a thriving steel
town into what looks like an abandoned farm.
Legend has it that in years past, the then-mayor
of Youngstown blurted out that “The Mahoning
River [the river that runs through Youngstown]
is for jobs not for fishes.” Today, both jobs and
“fishes” are gone.
28 Rich States, Poor States
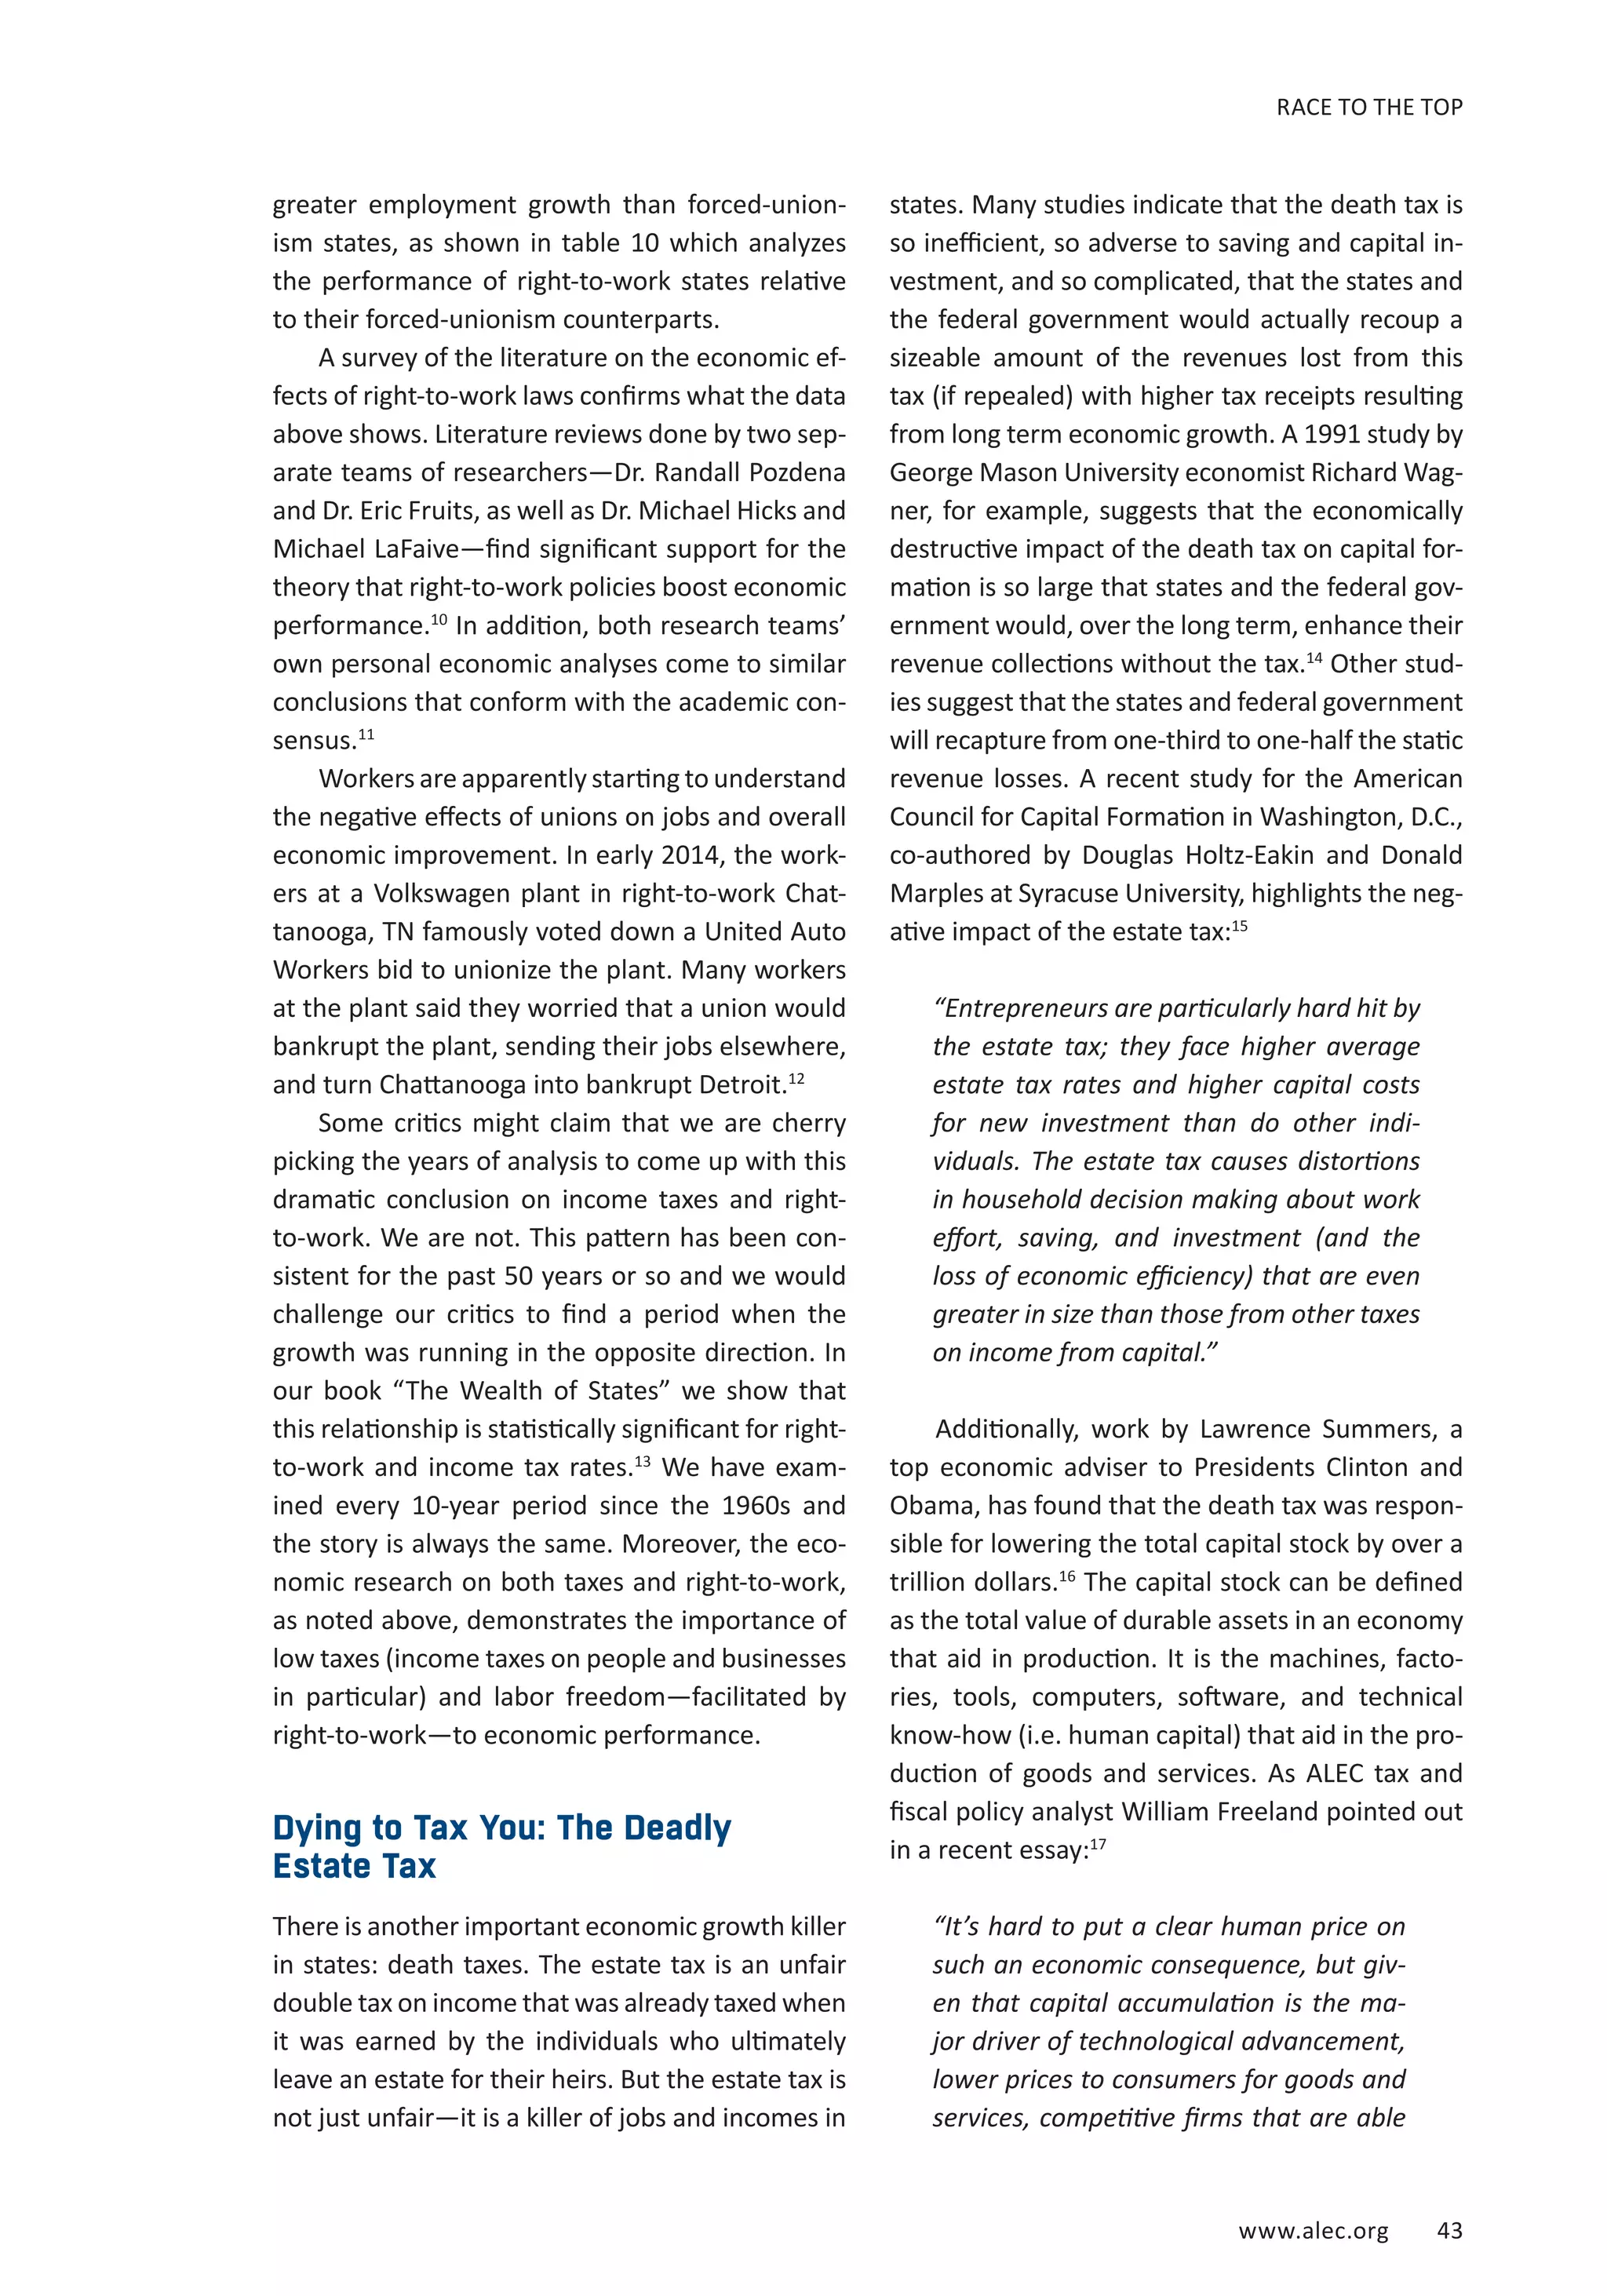
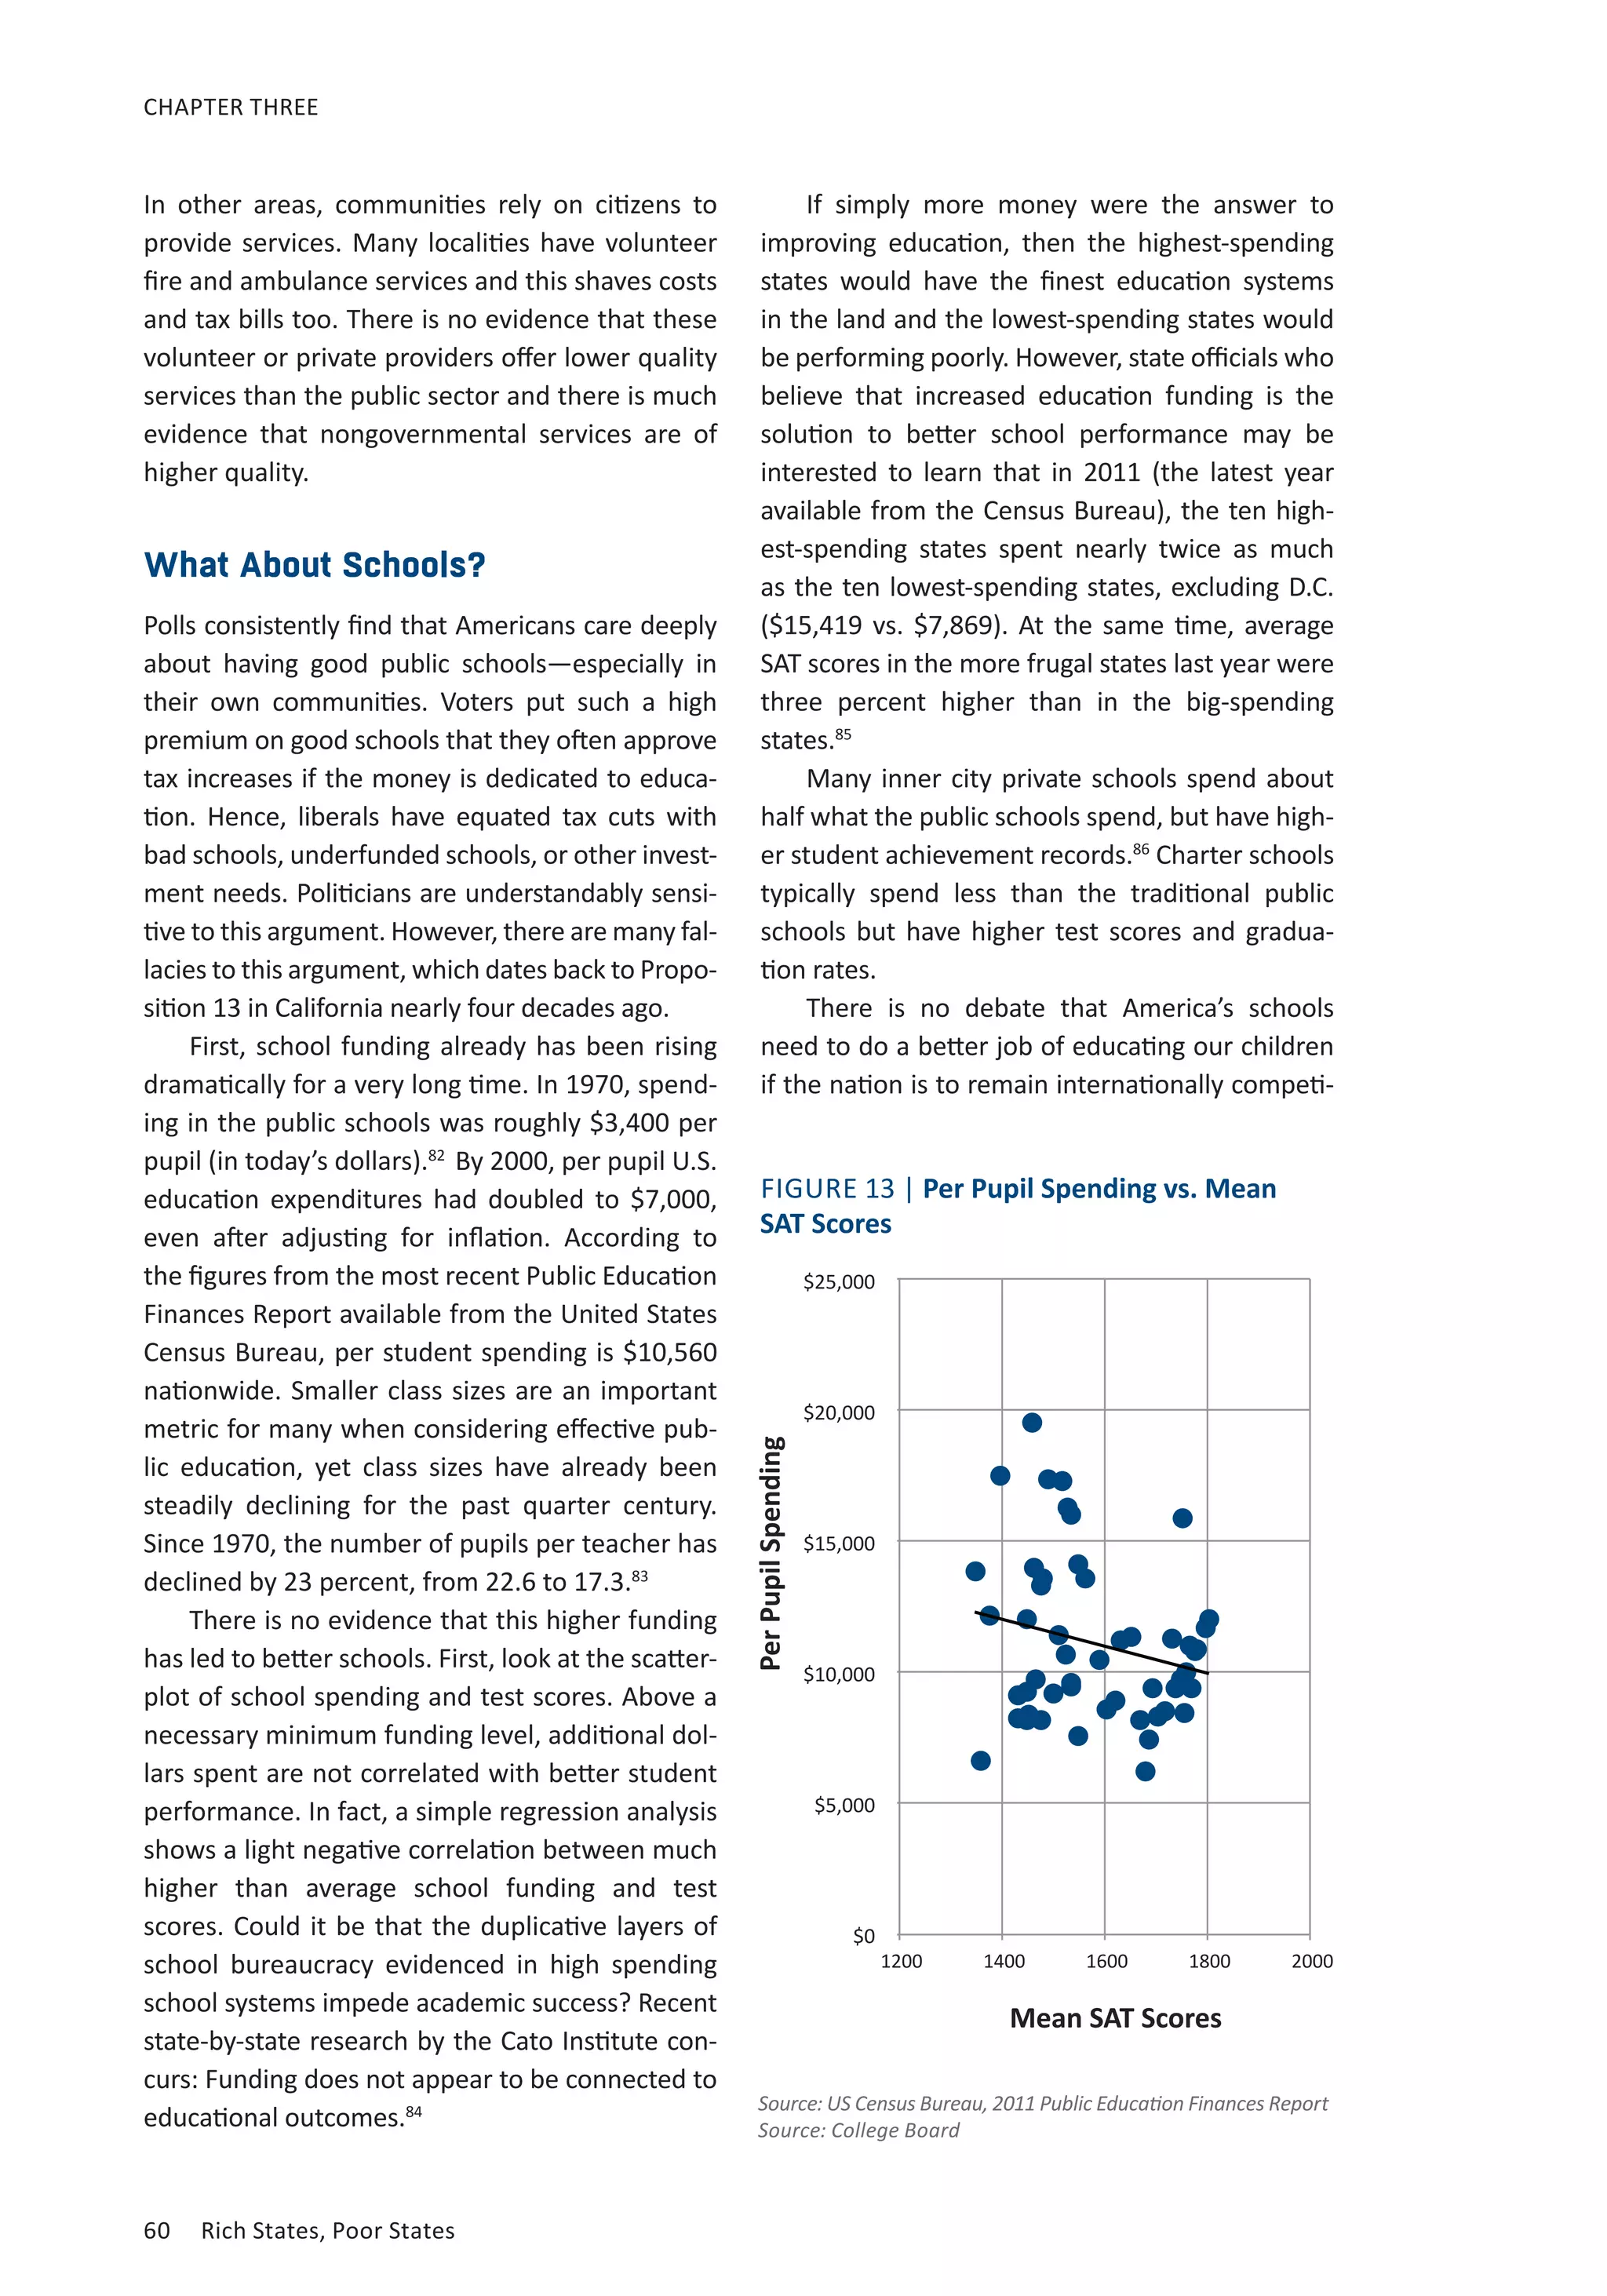
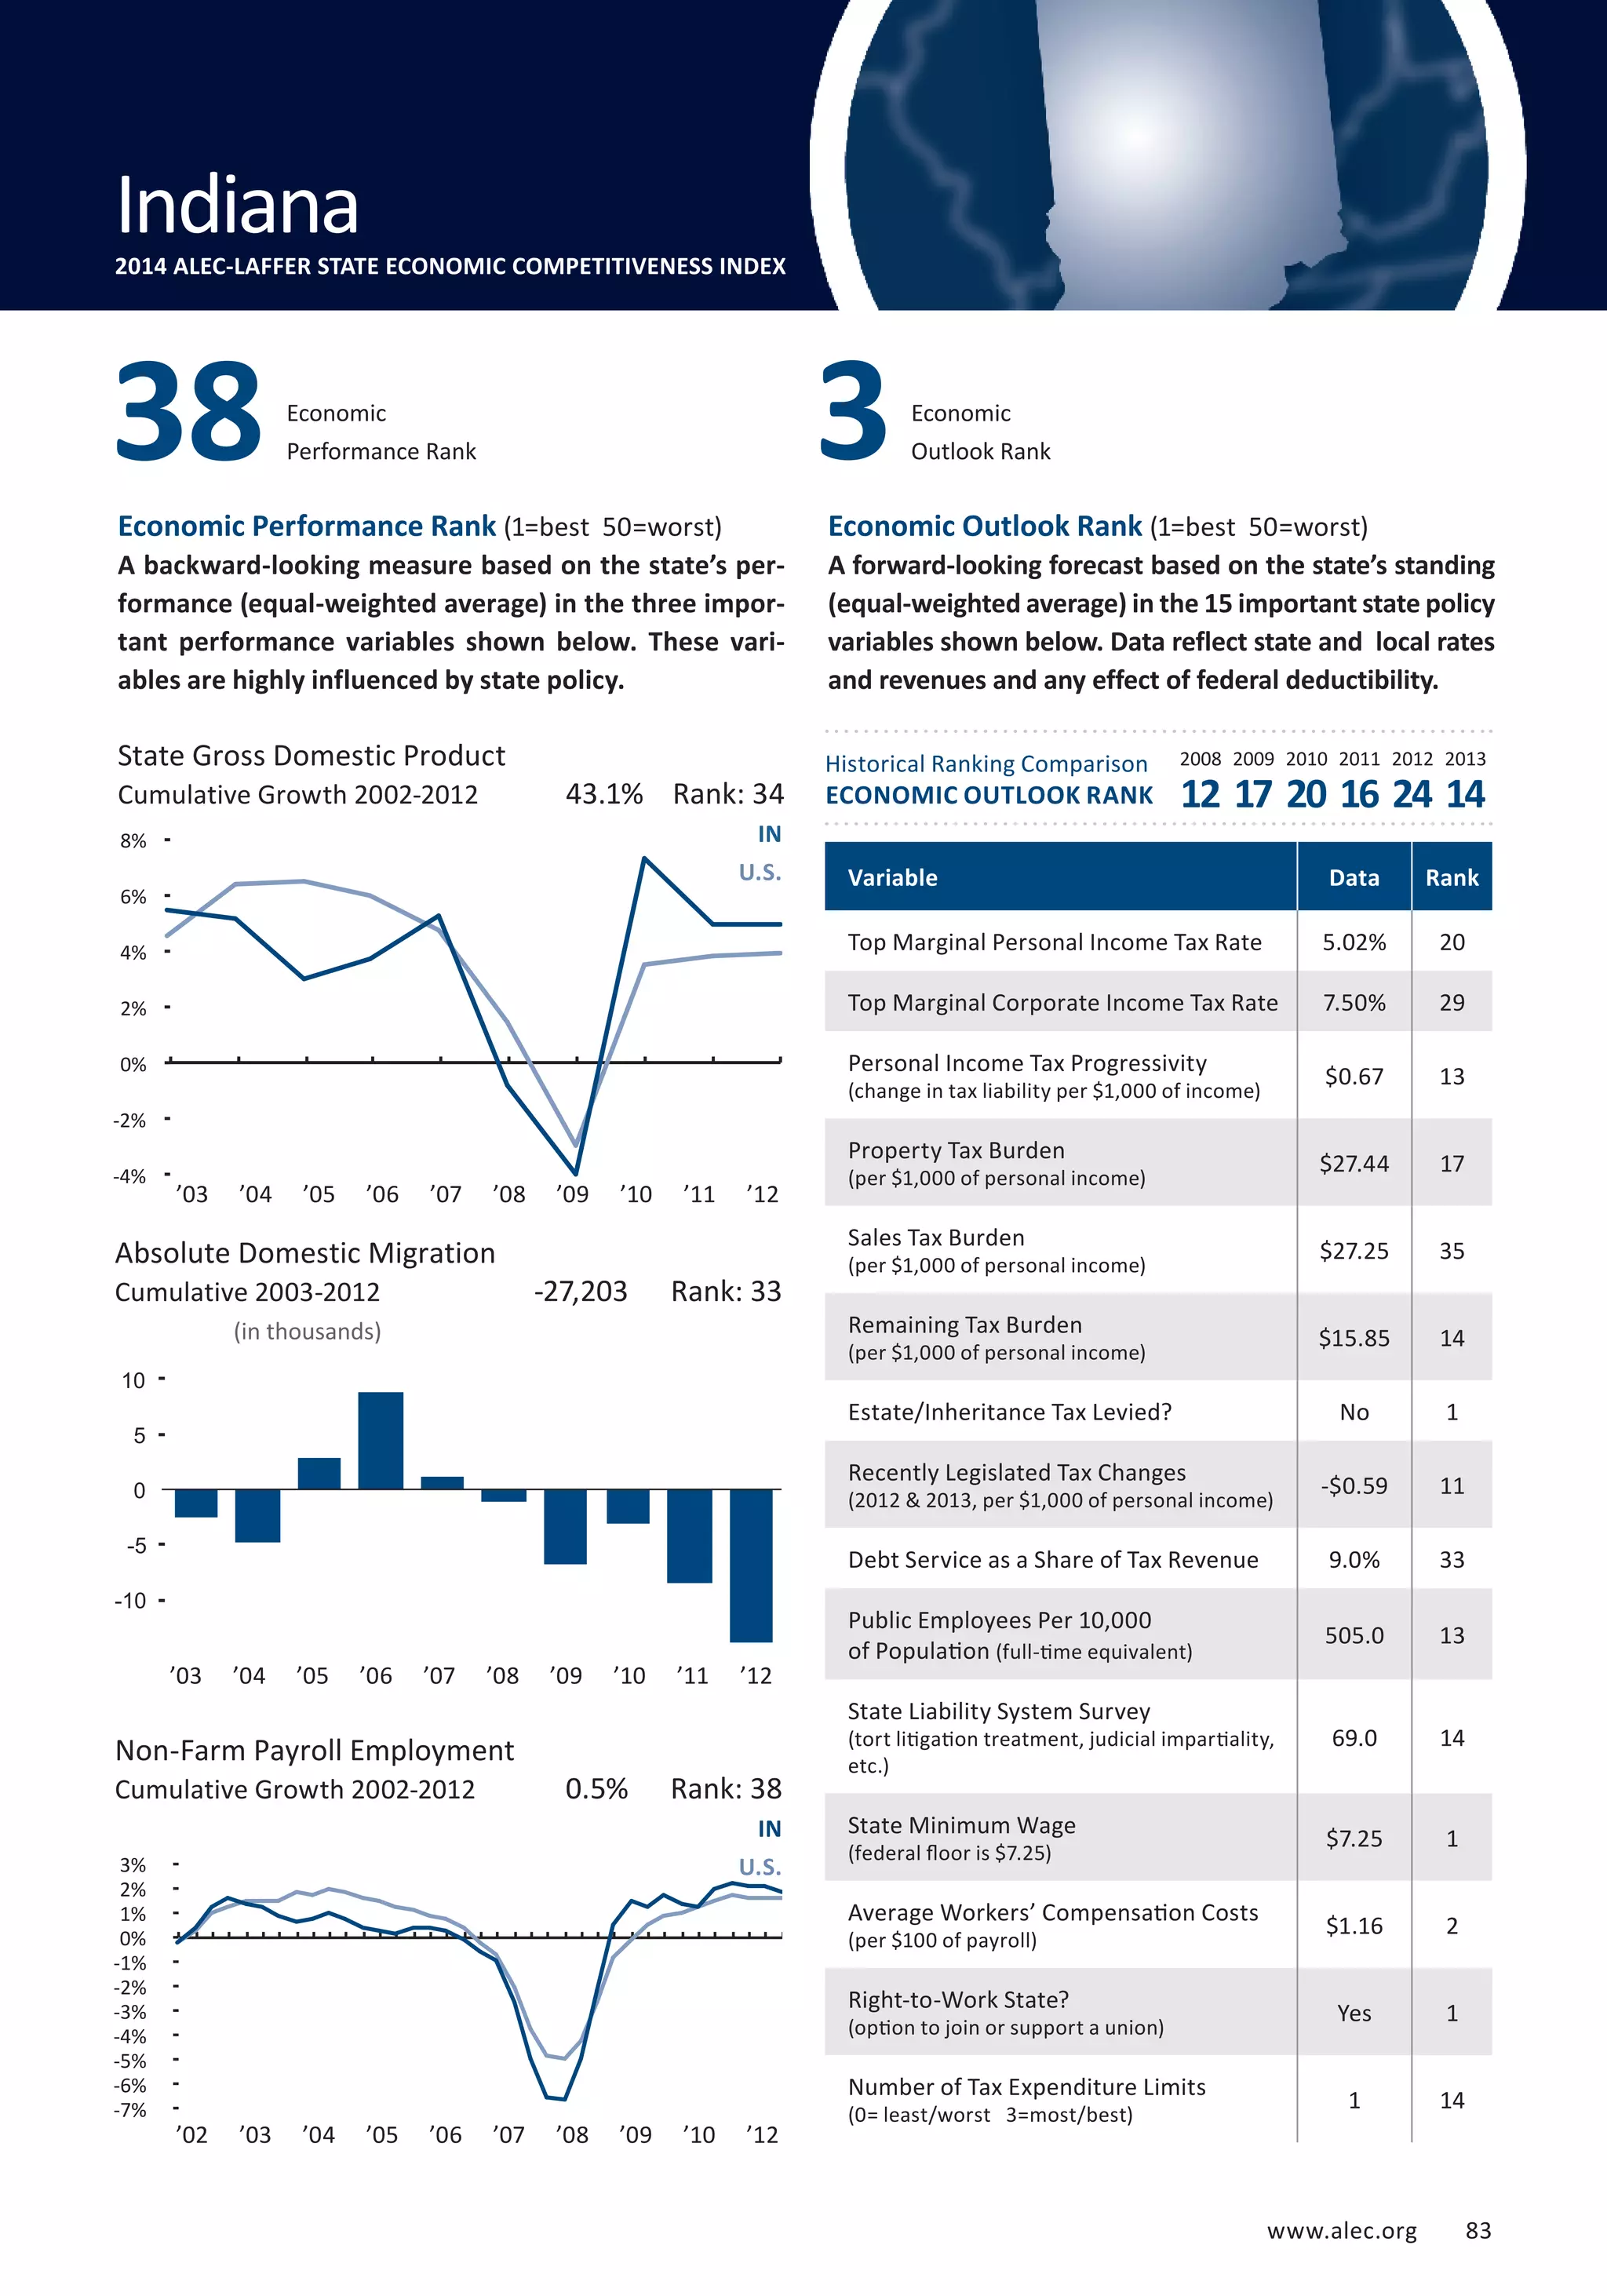
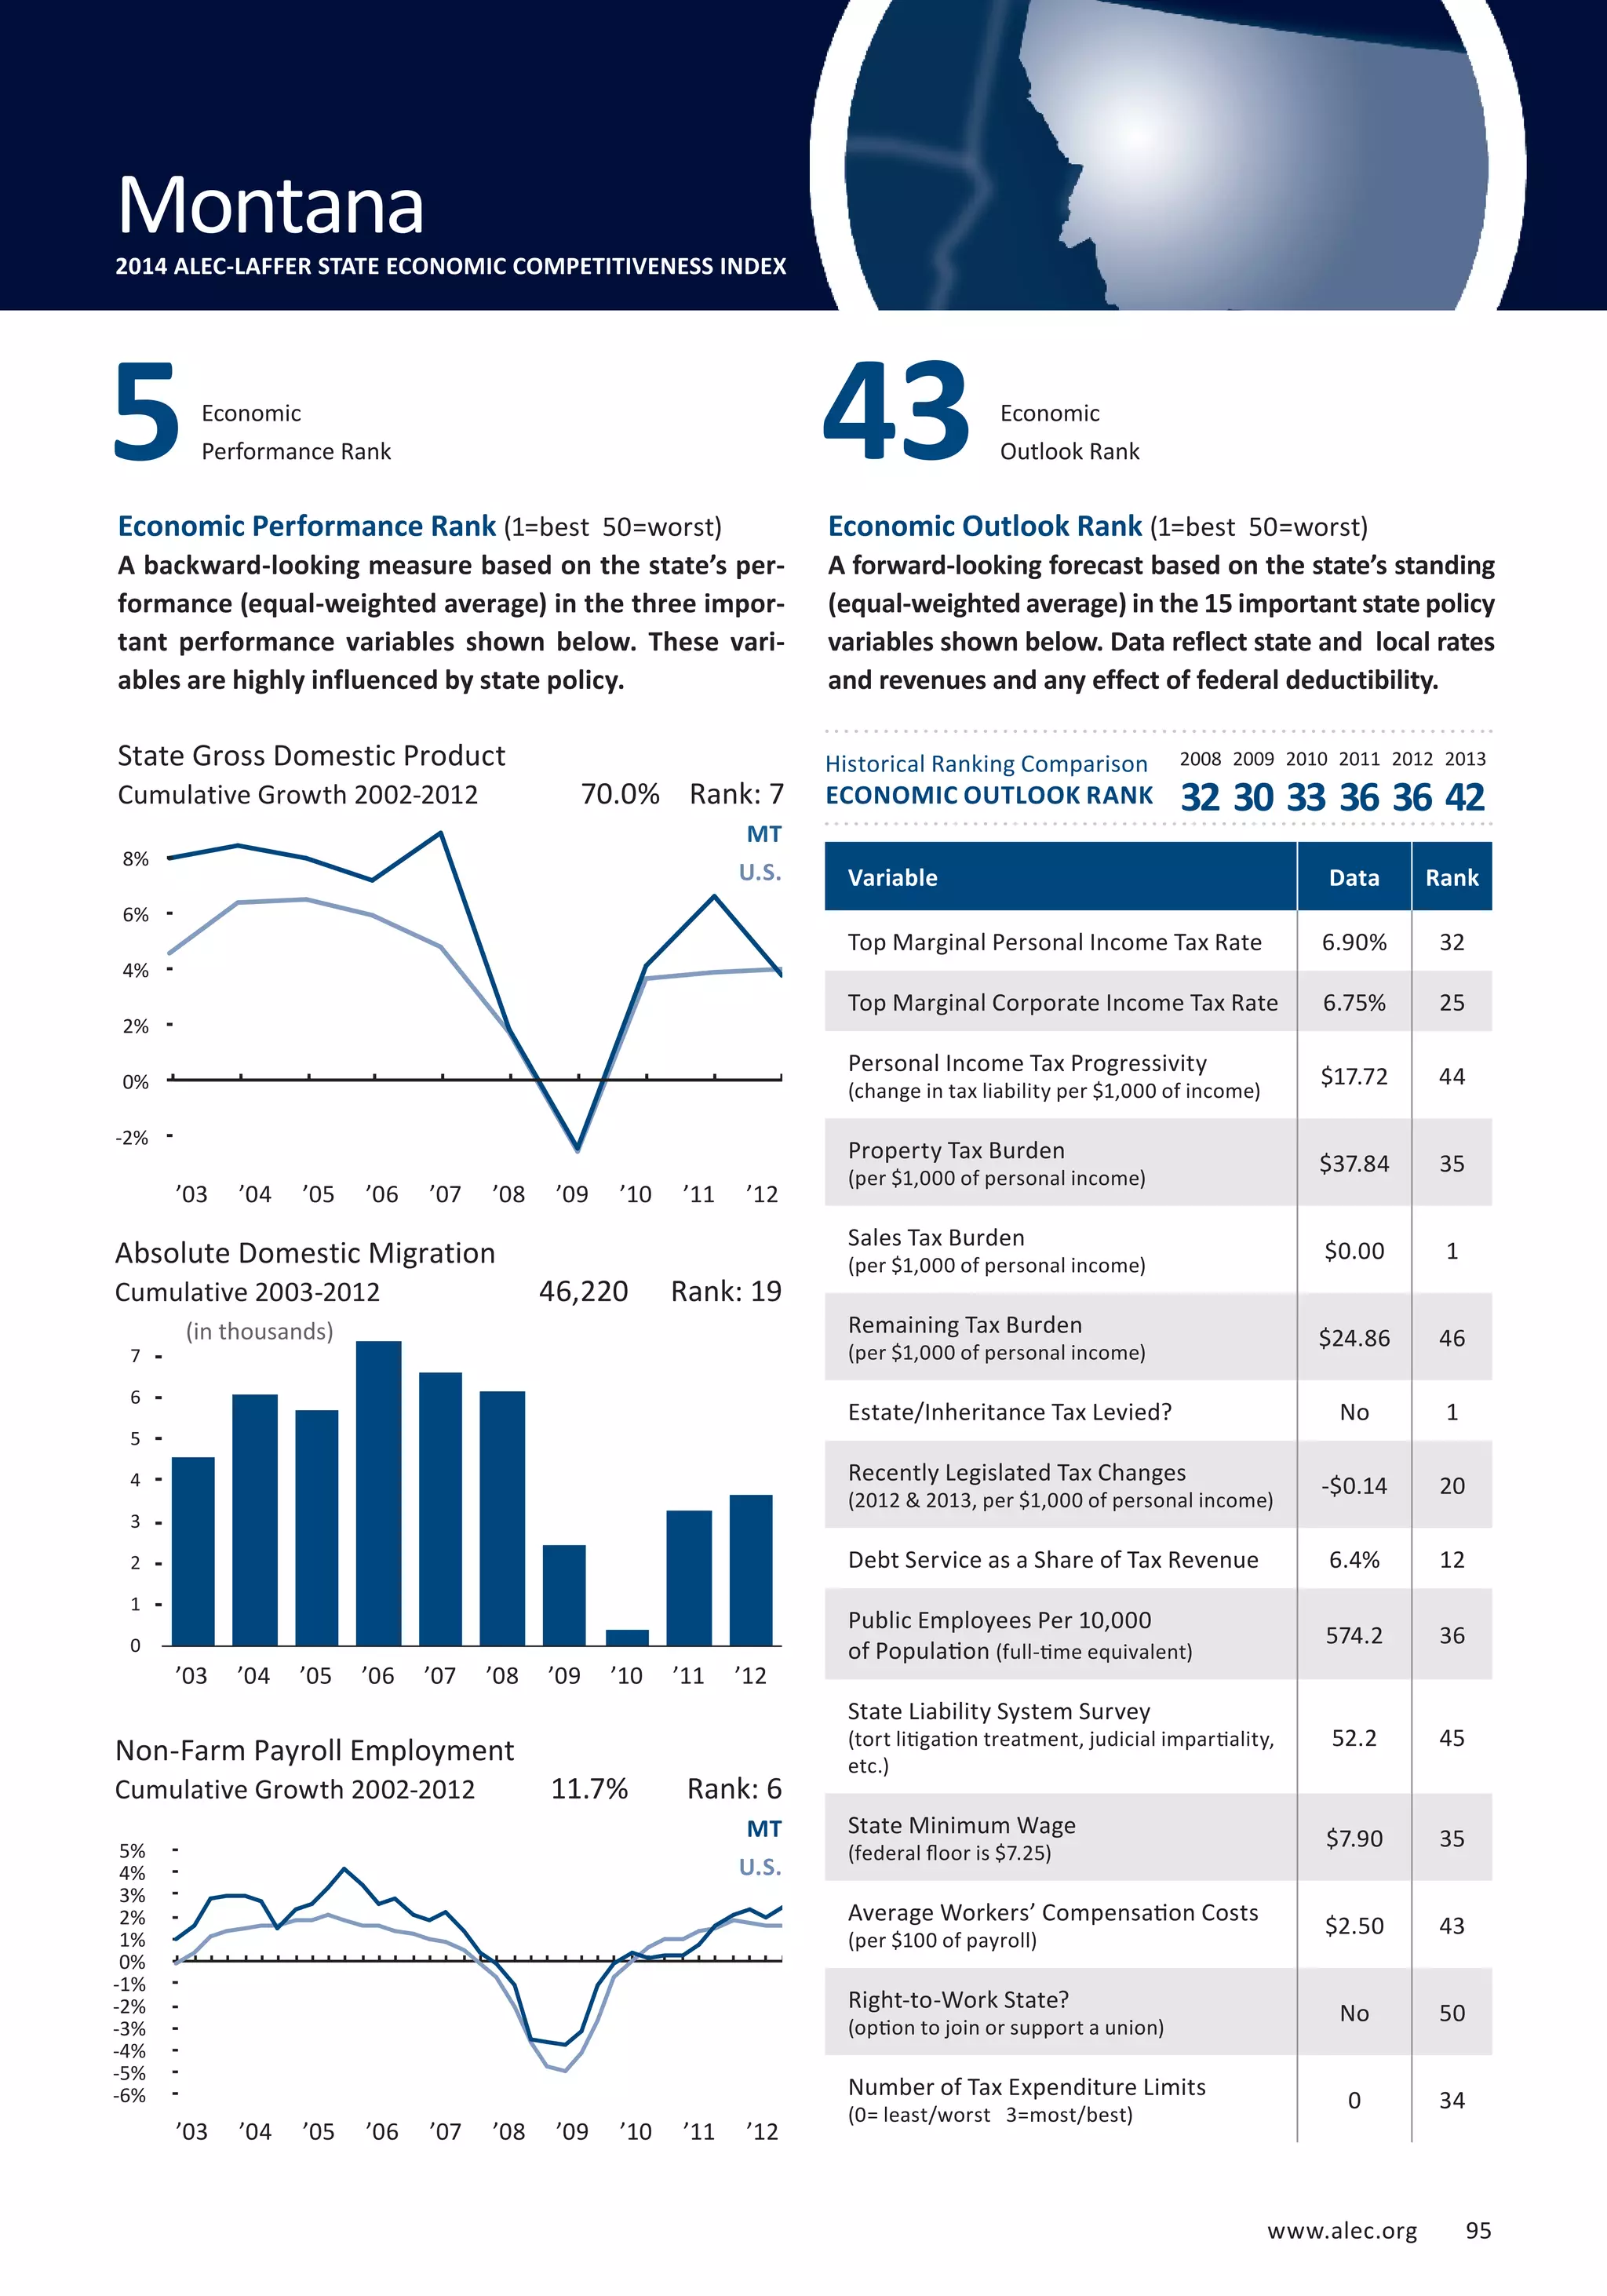
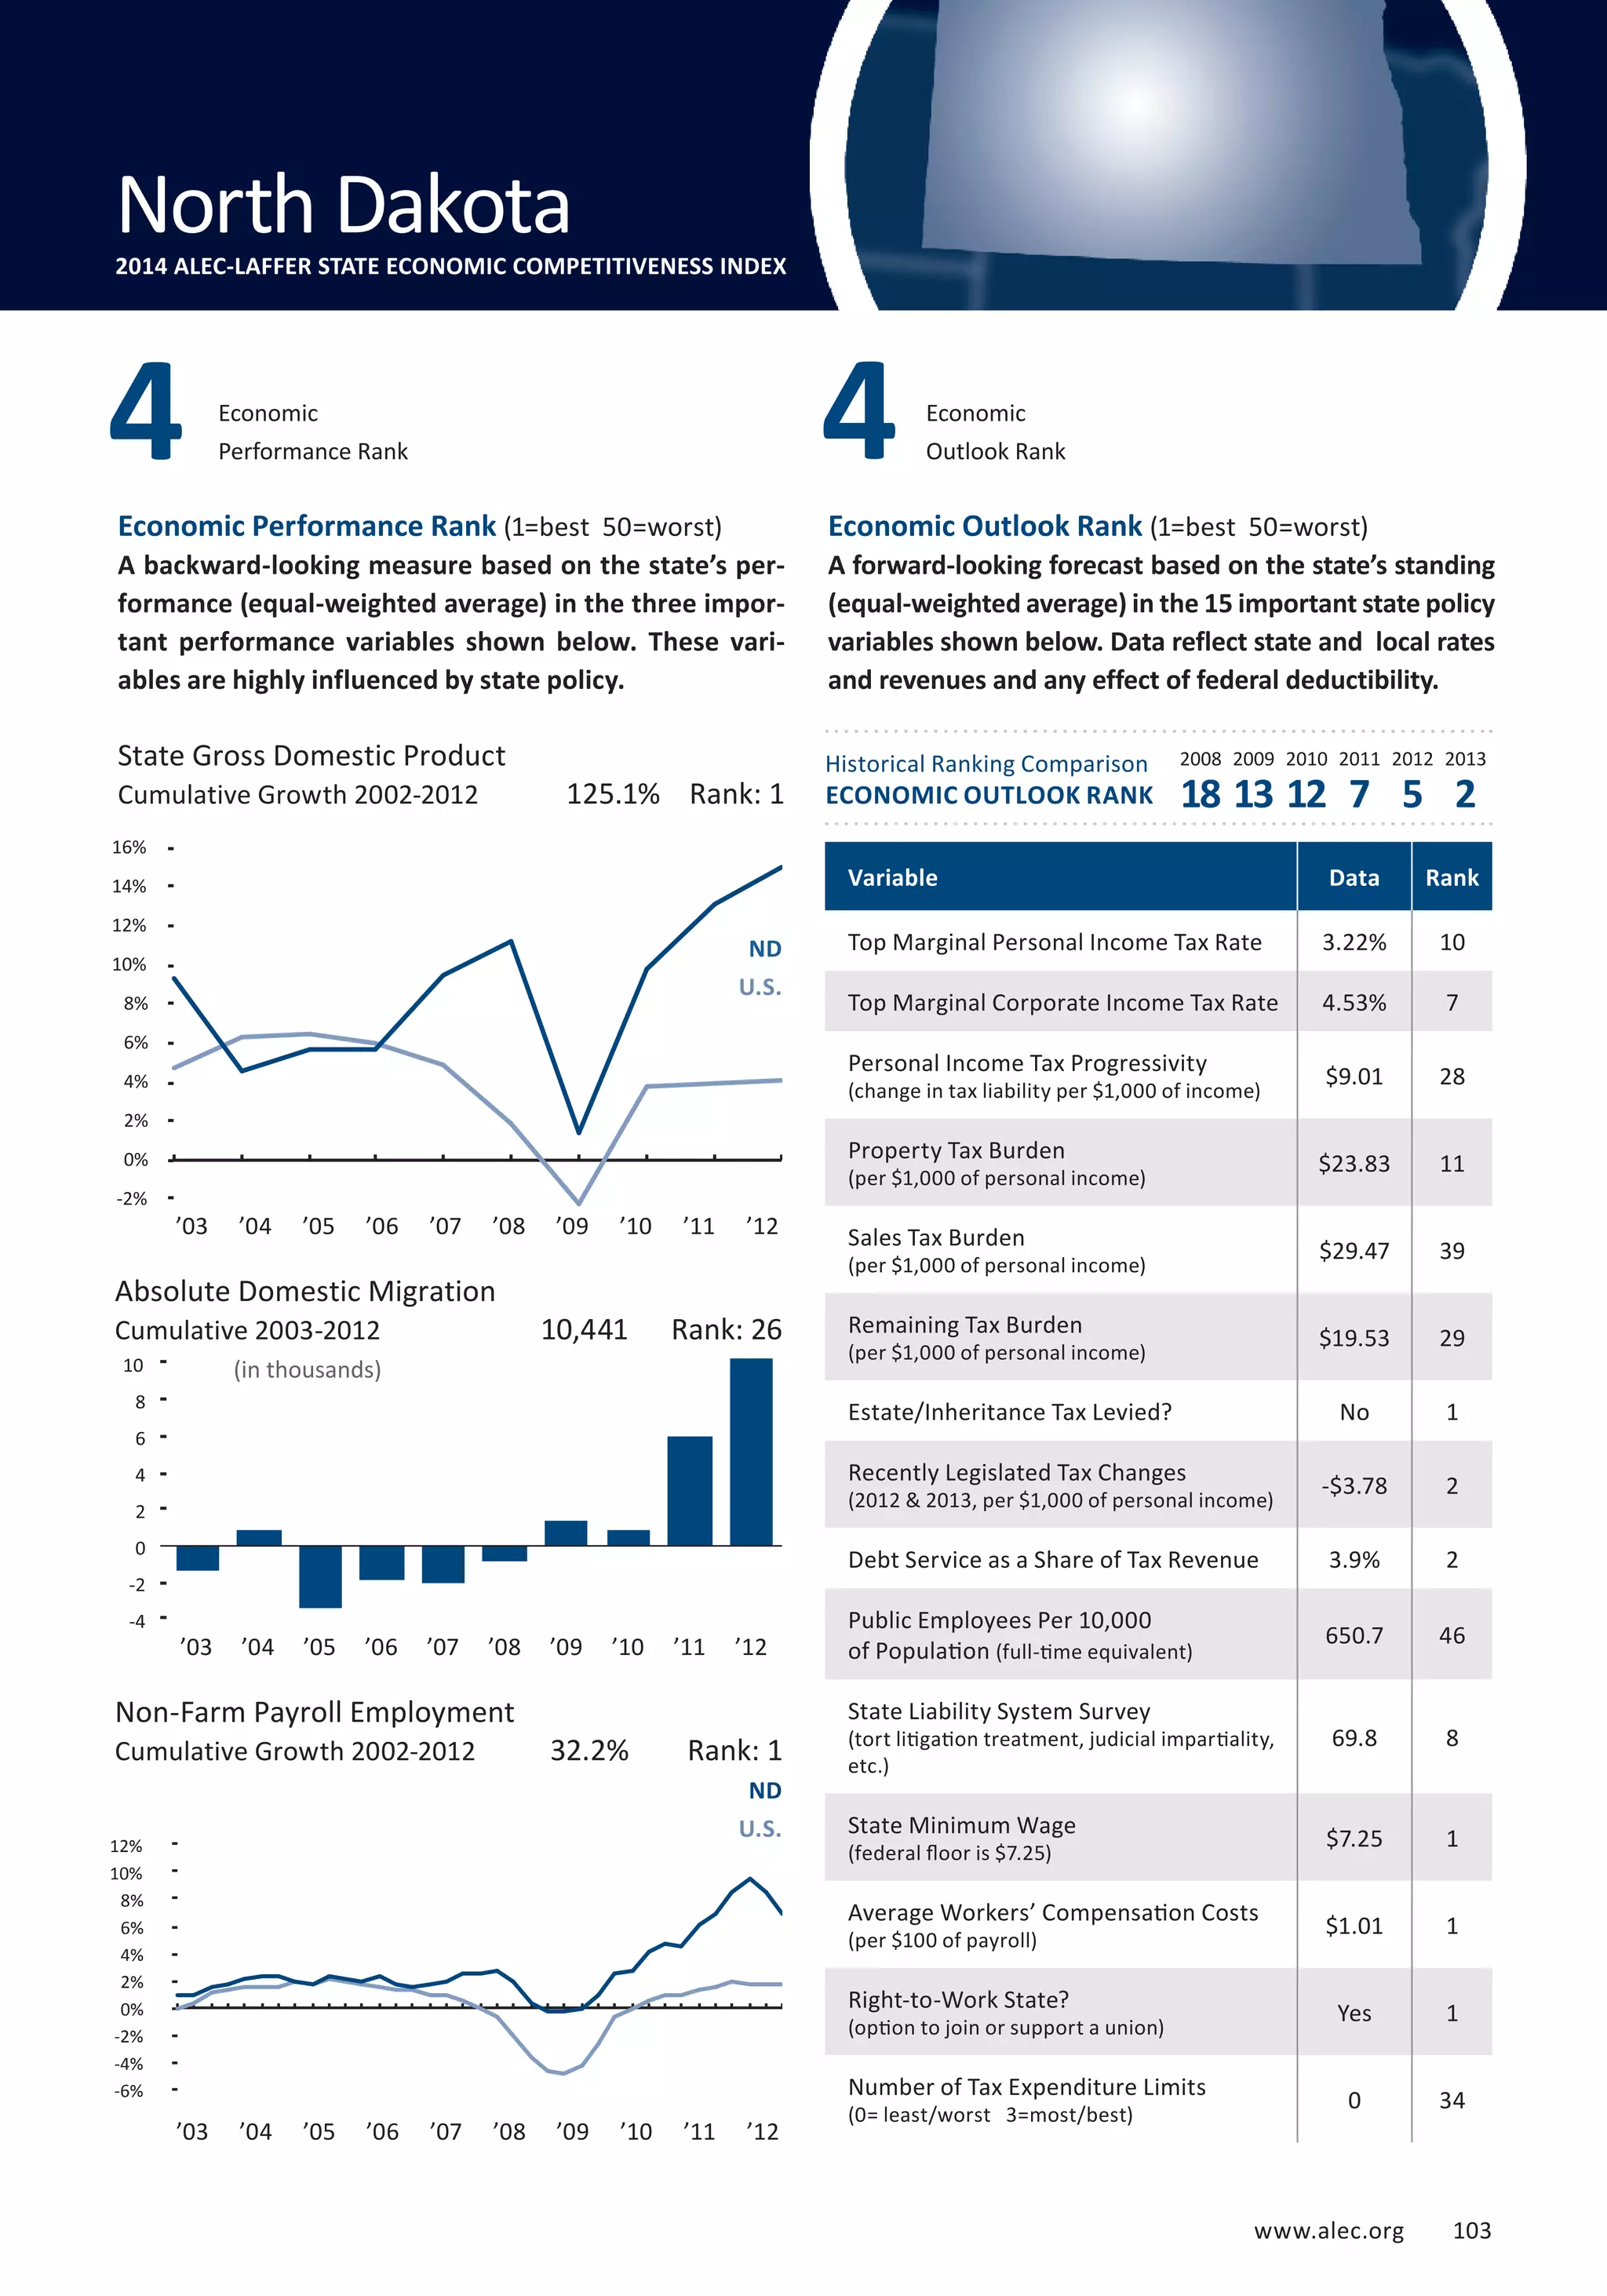
To examine Ohio’s poor performance over the
past 20 years, we have listed and plotted in Figure
4 above, the number of federal tax returns mov-ing
into Ohio less the number of federal tax returns
leaving Ohio as a share of the sum of both. Buck-eyes
have left in search of better opportunities,
bringing their talents and businesses with them. In
fact, during 2009-2010, Ohio lost more taxpayers
then almost any other state (expect for Michigan).
Furthermore, from 2003 to 2012, over 365,000 tax-payers
left Ohio in search of better opportunities.
Buckeyes are packing up and moving into low
tax states, and taking their incomes with them.
From 1992-2011, Ohio has lost $19.5 billion in an-
Connecticut New Jersey Ohio
Source: Laffer Associates, Internal Revenue Service
1
51](https://image.slidesharecdn.com/rsps-2014-7th-edition-140414230543-phpapp01/75/Rich-States-Poor-States-2014-Edition-42-2048.jpg)
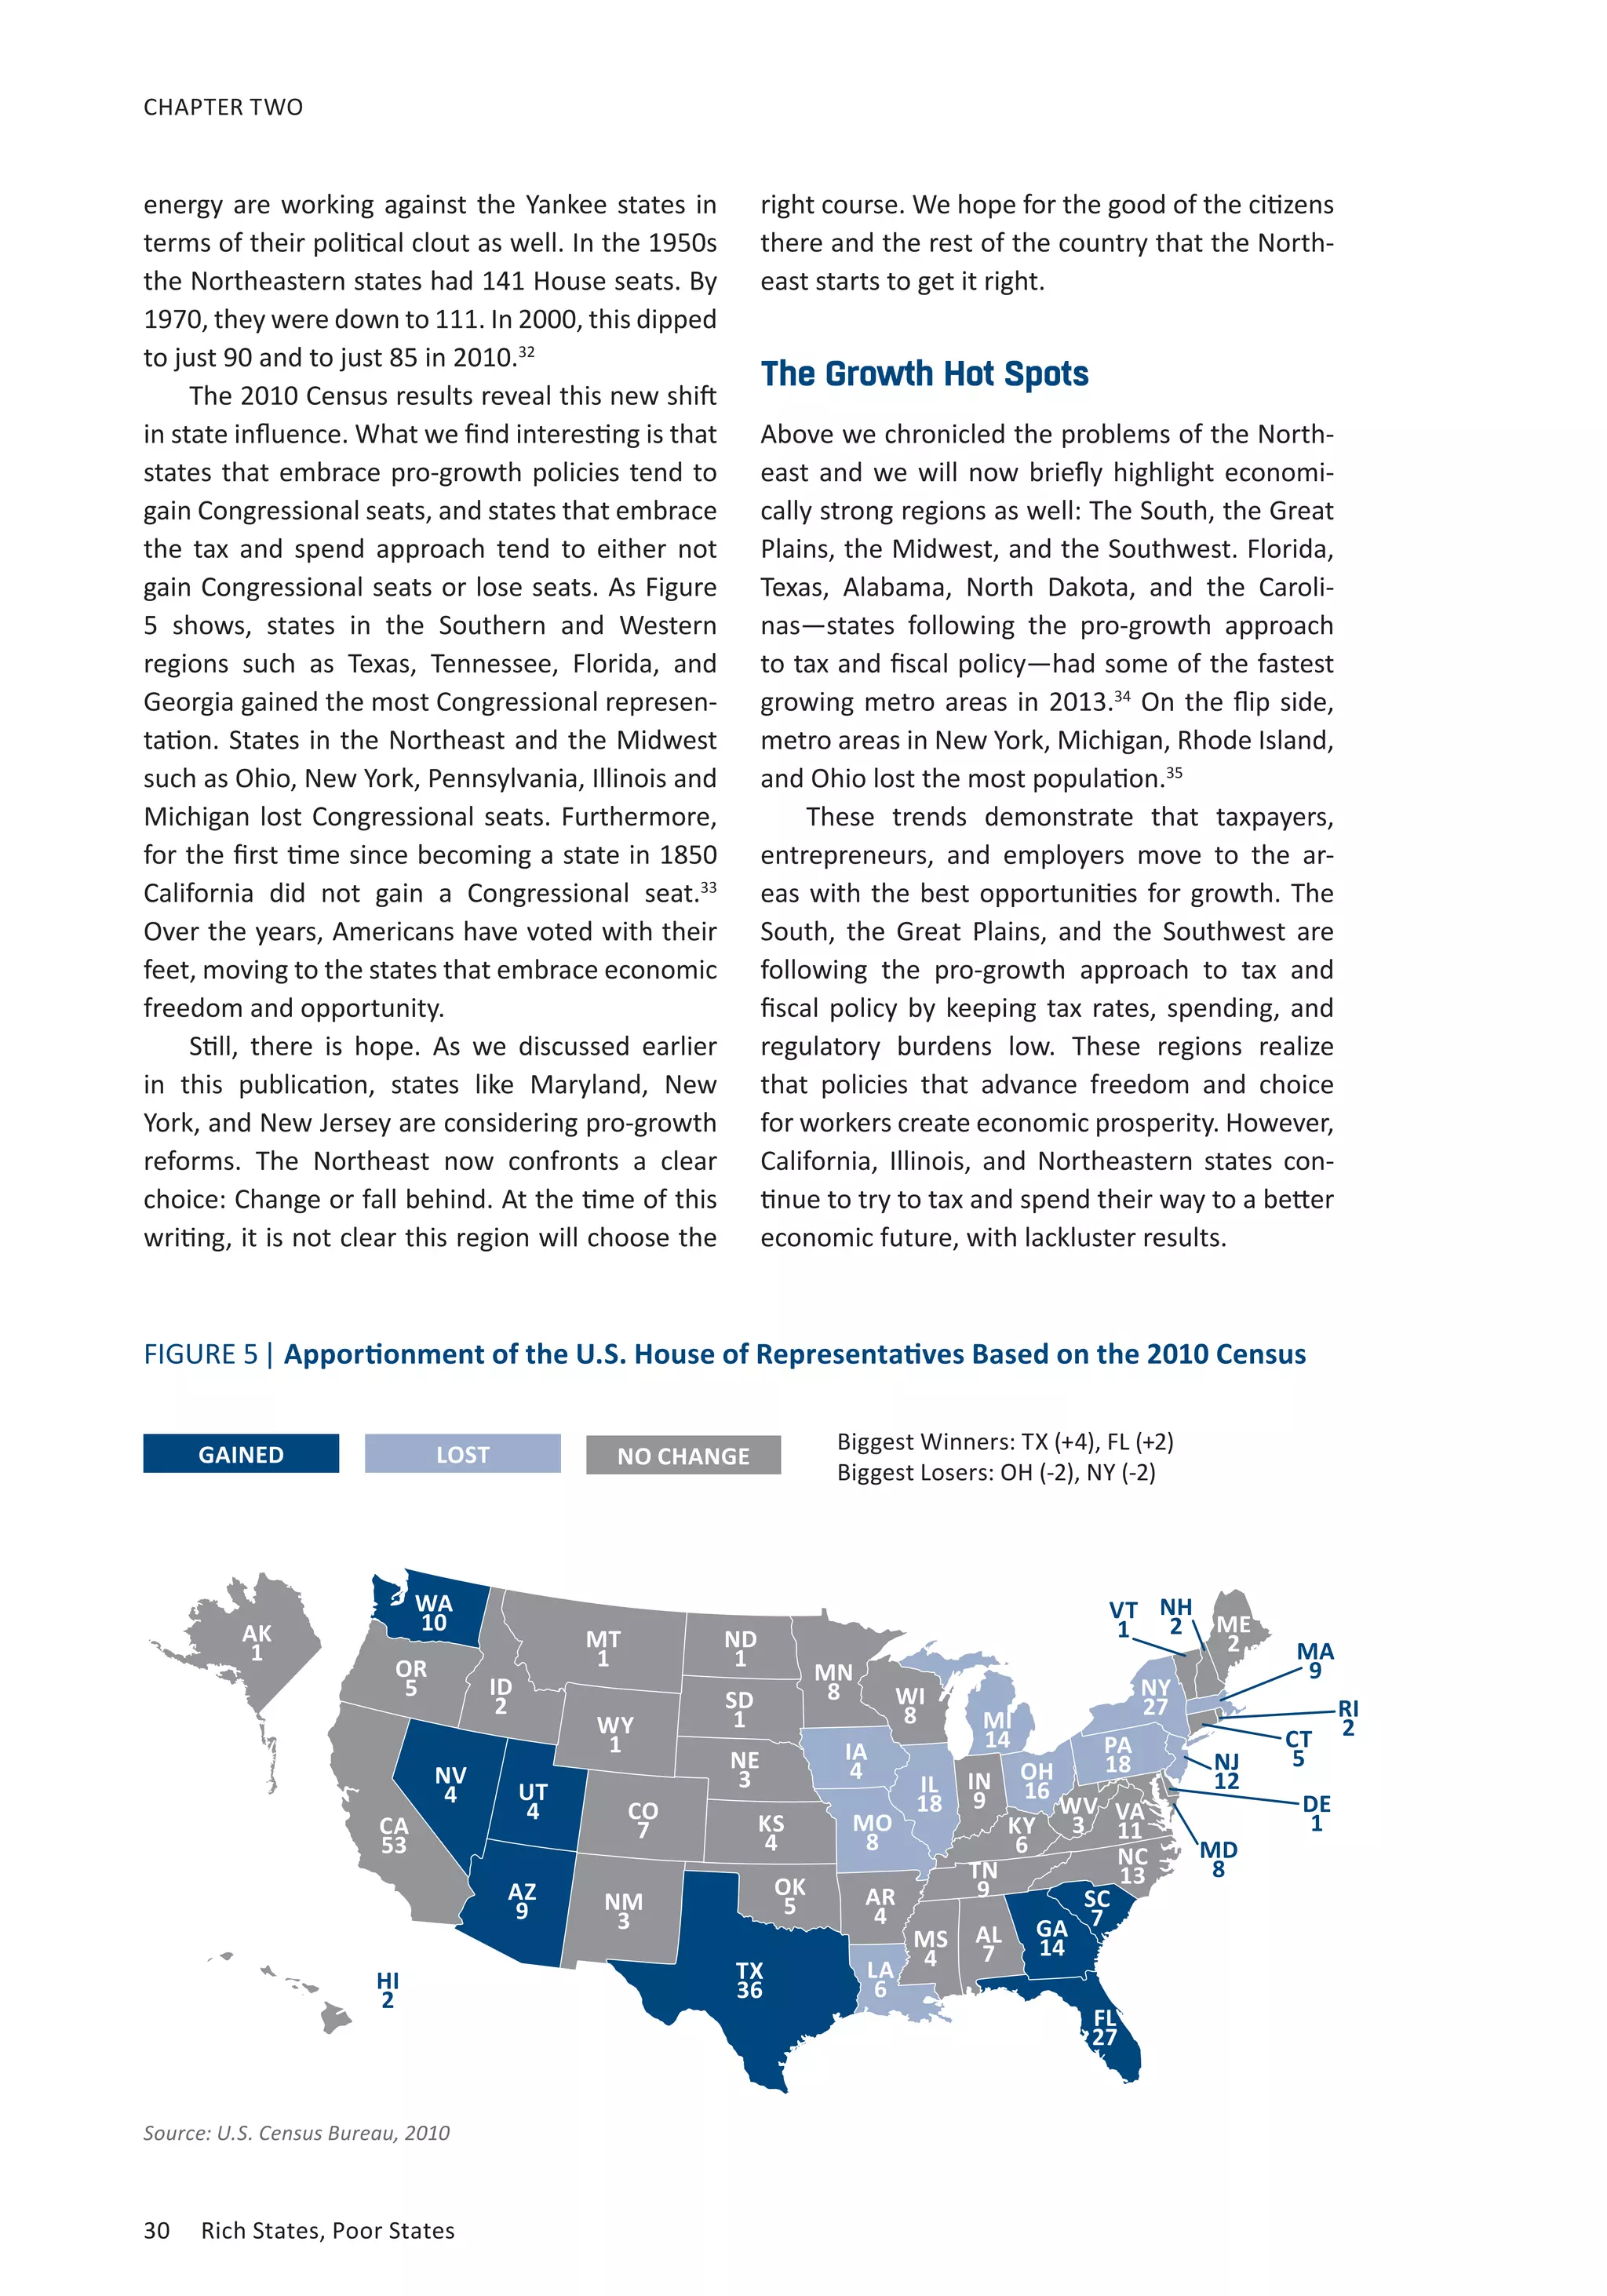


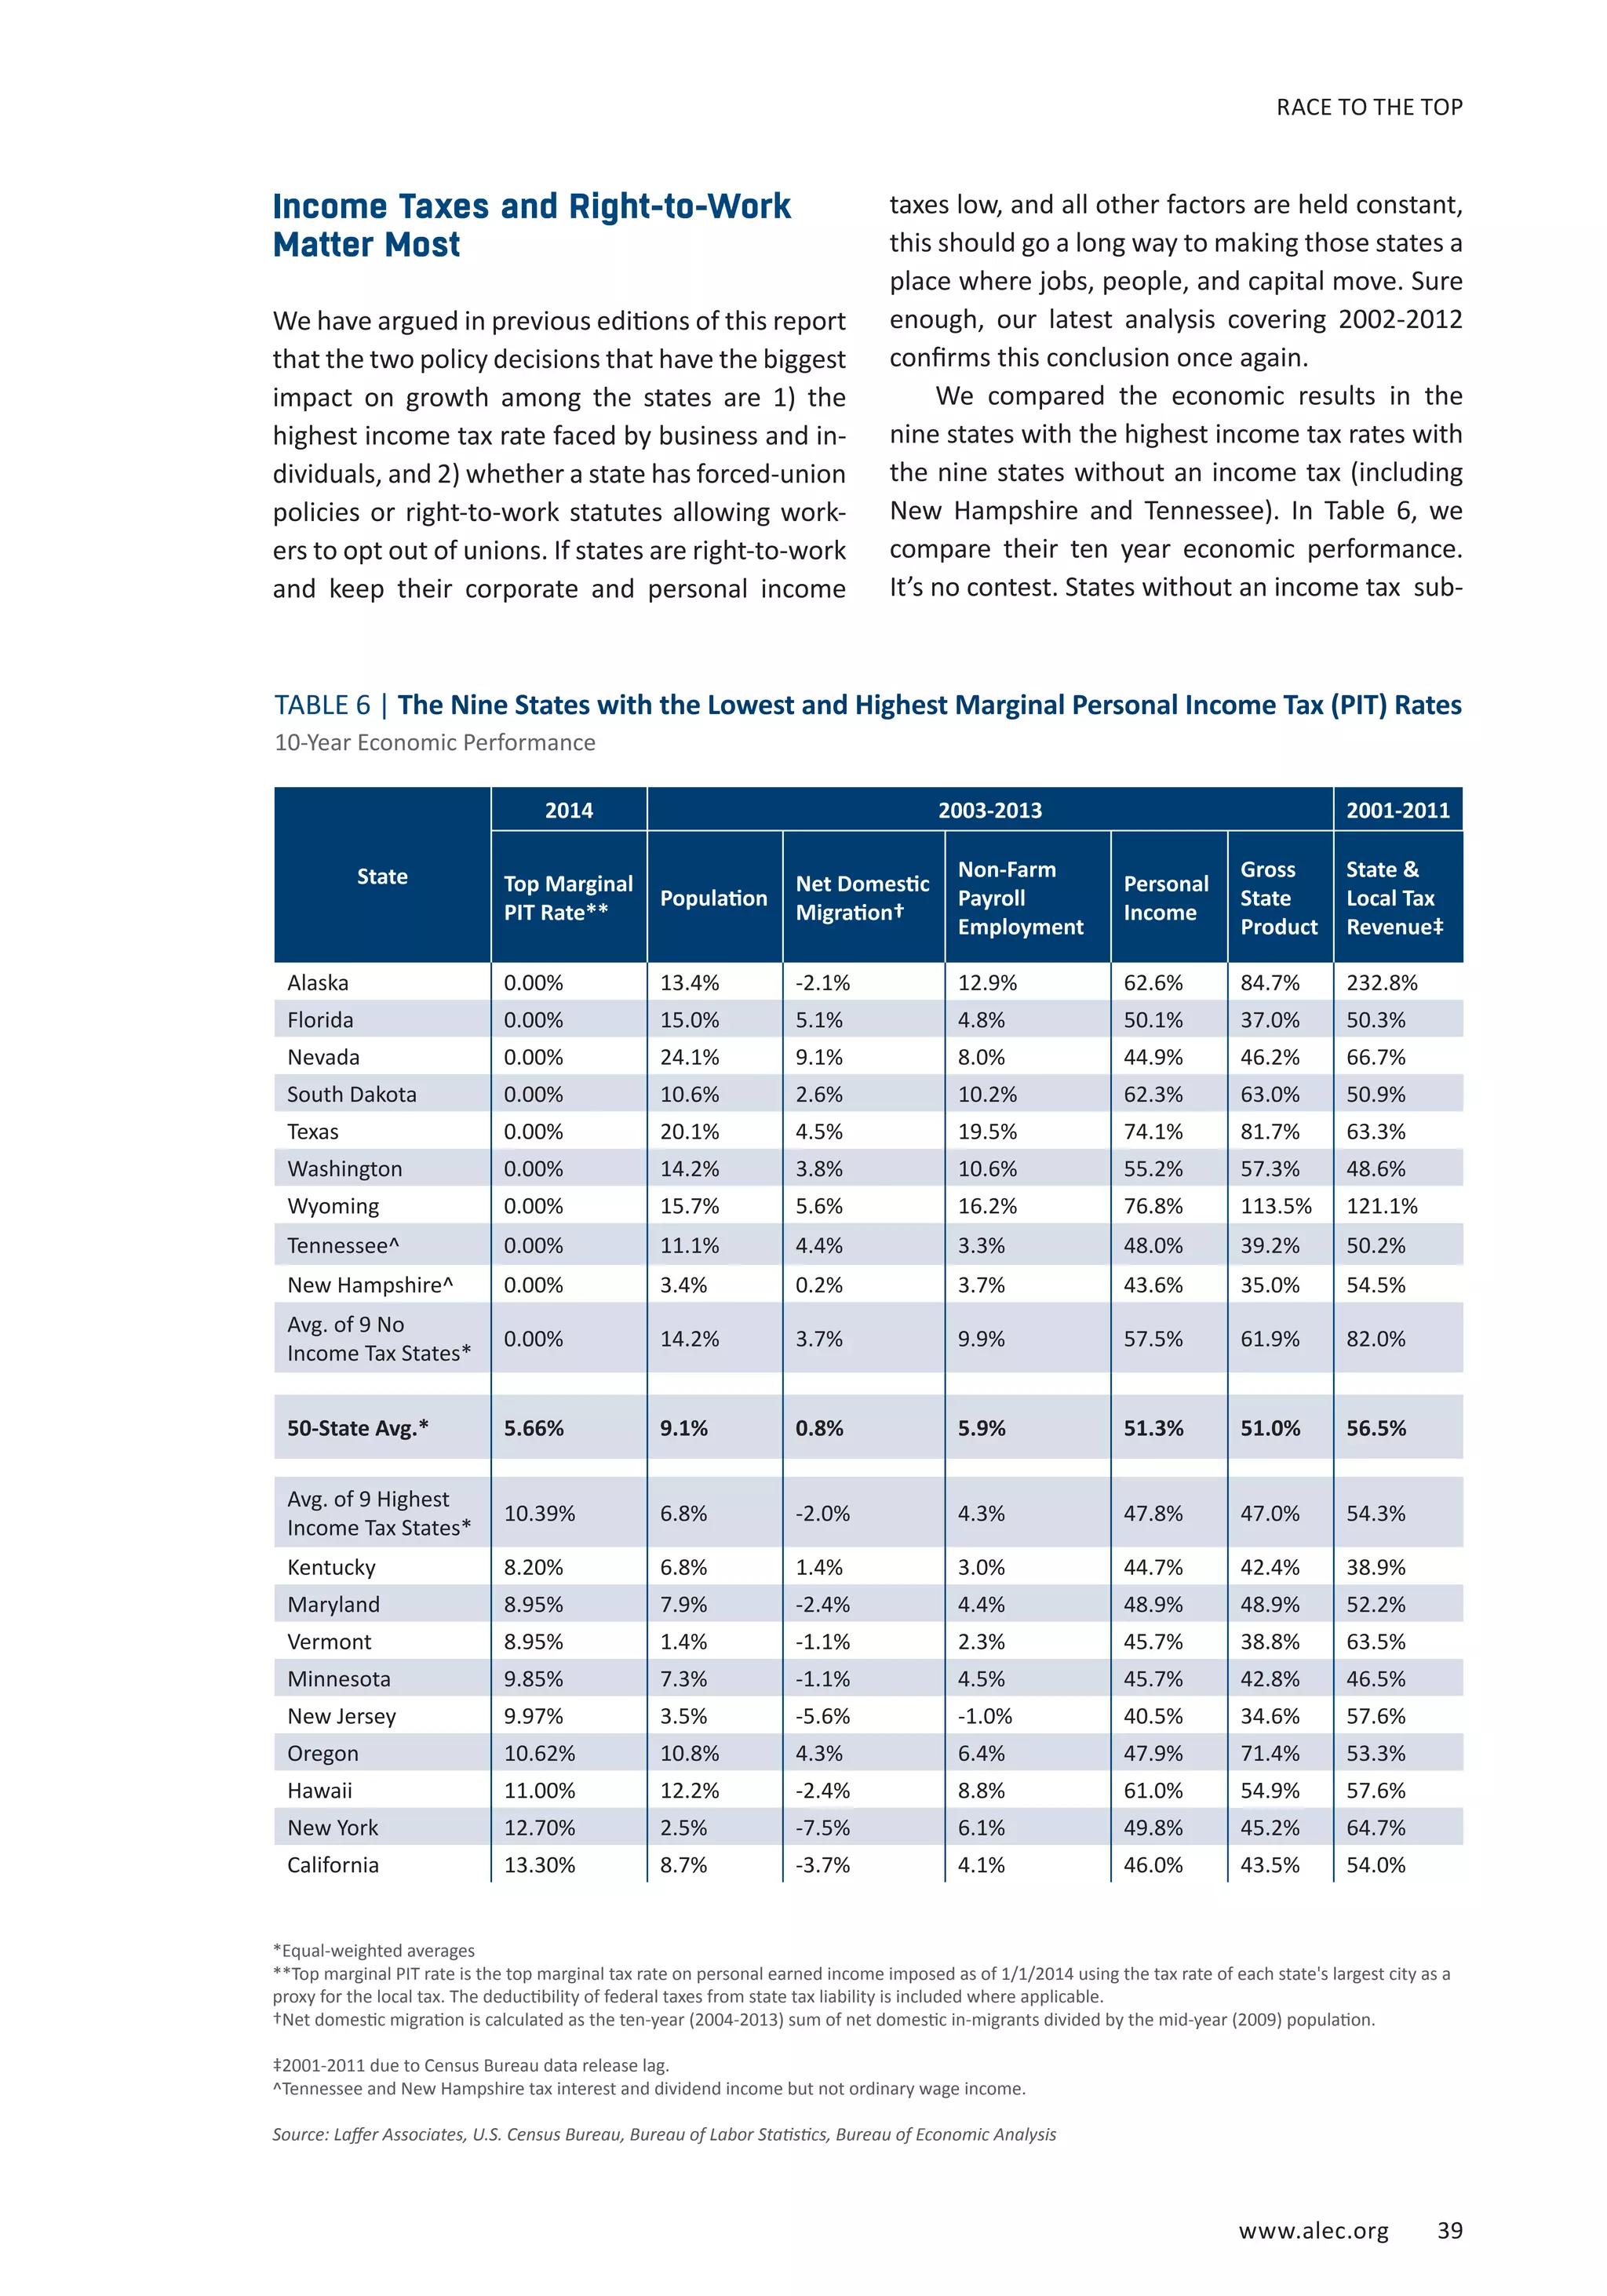
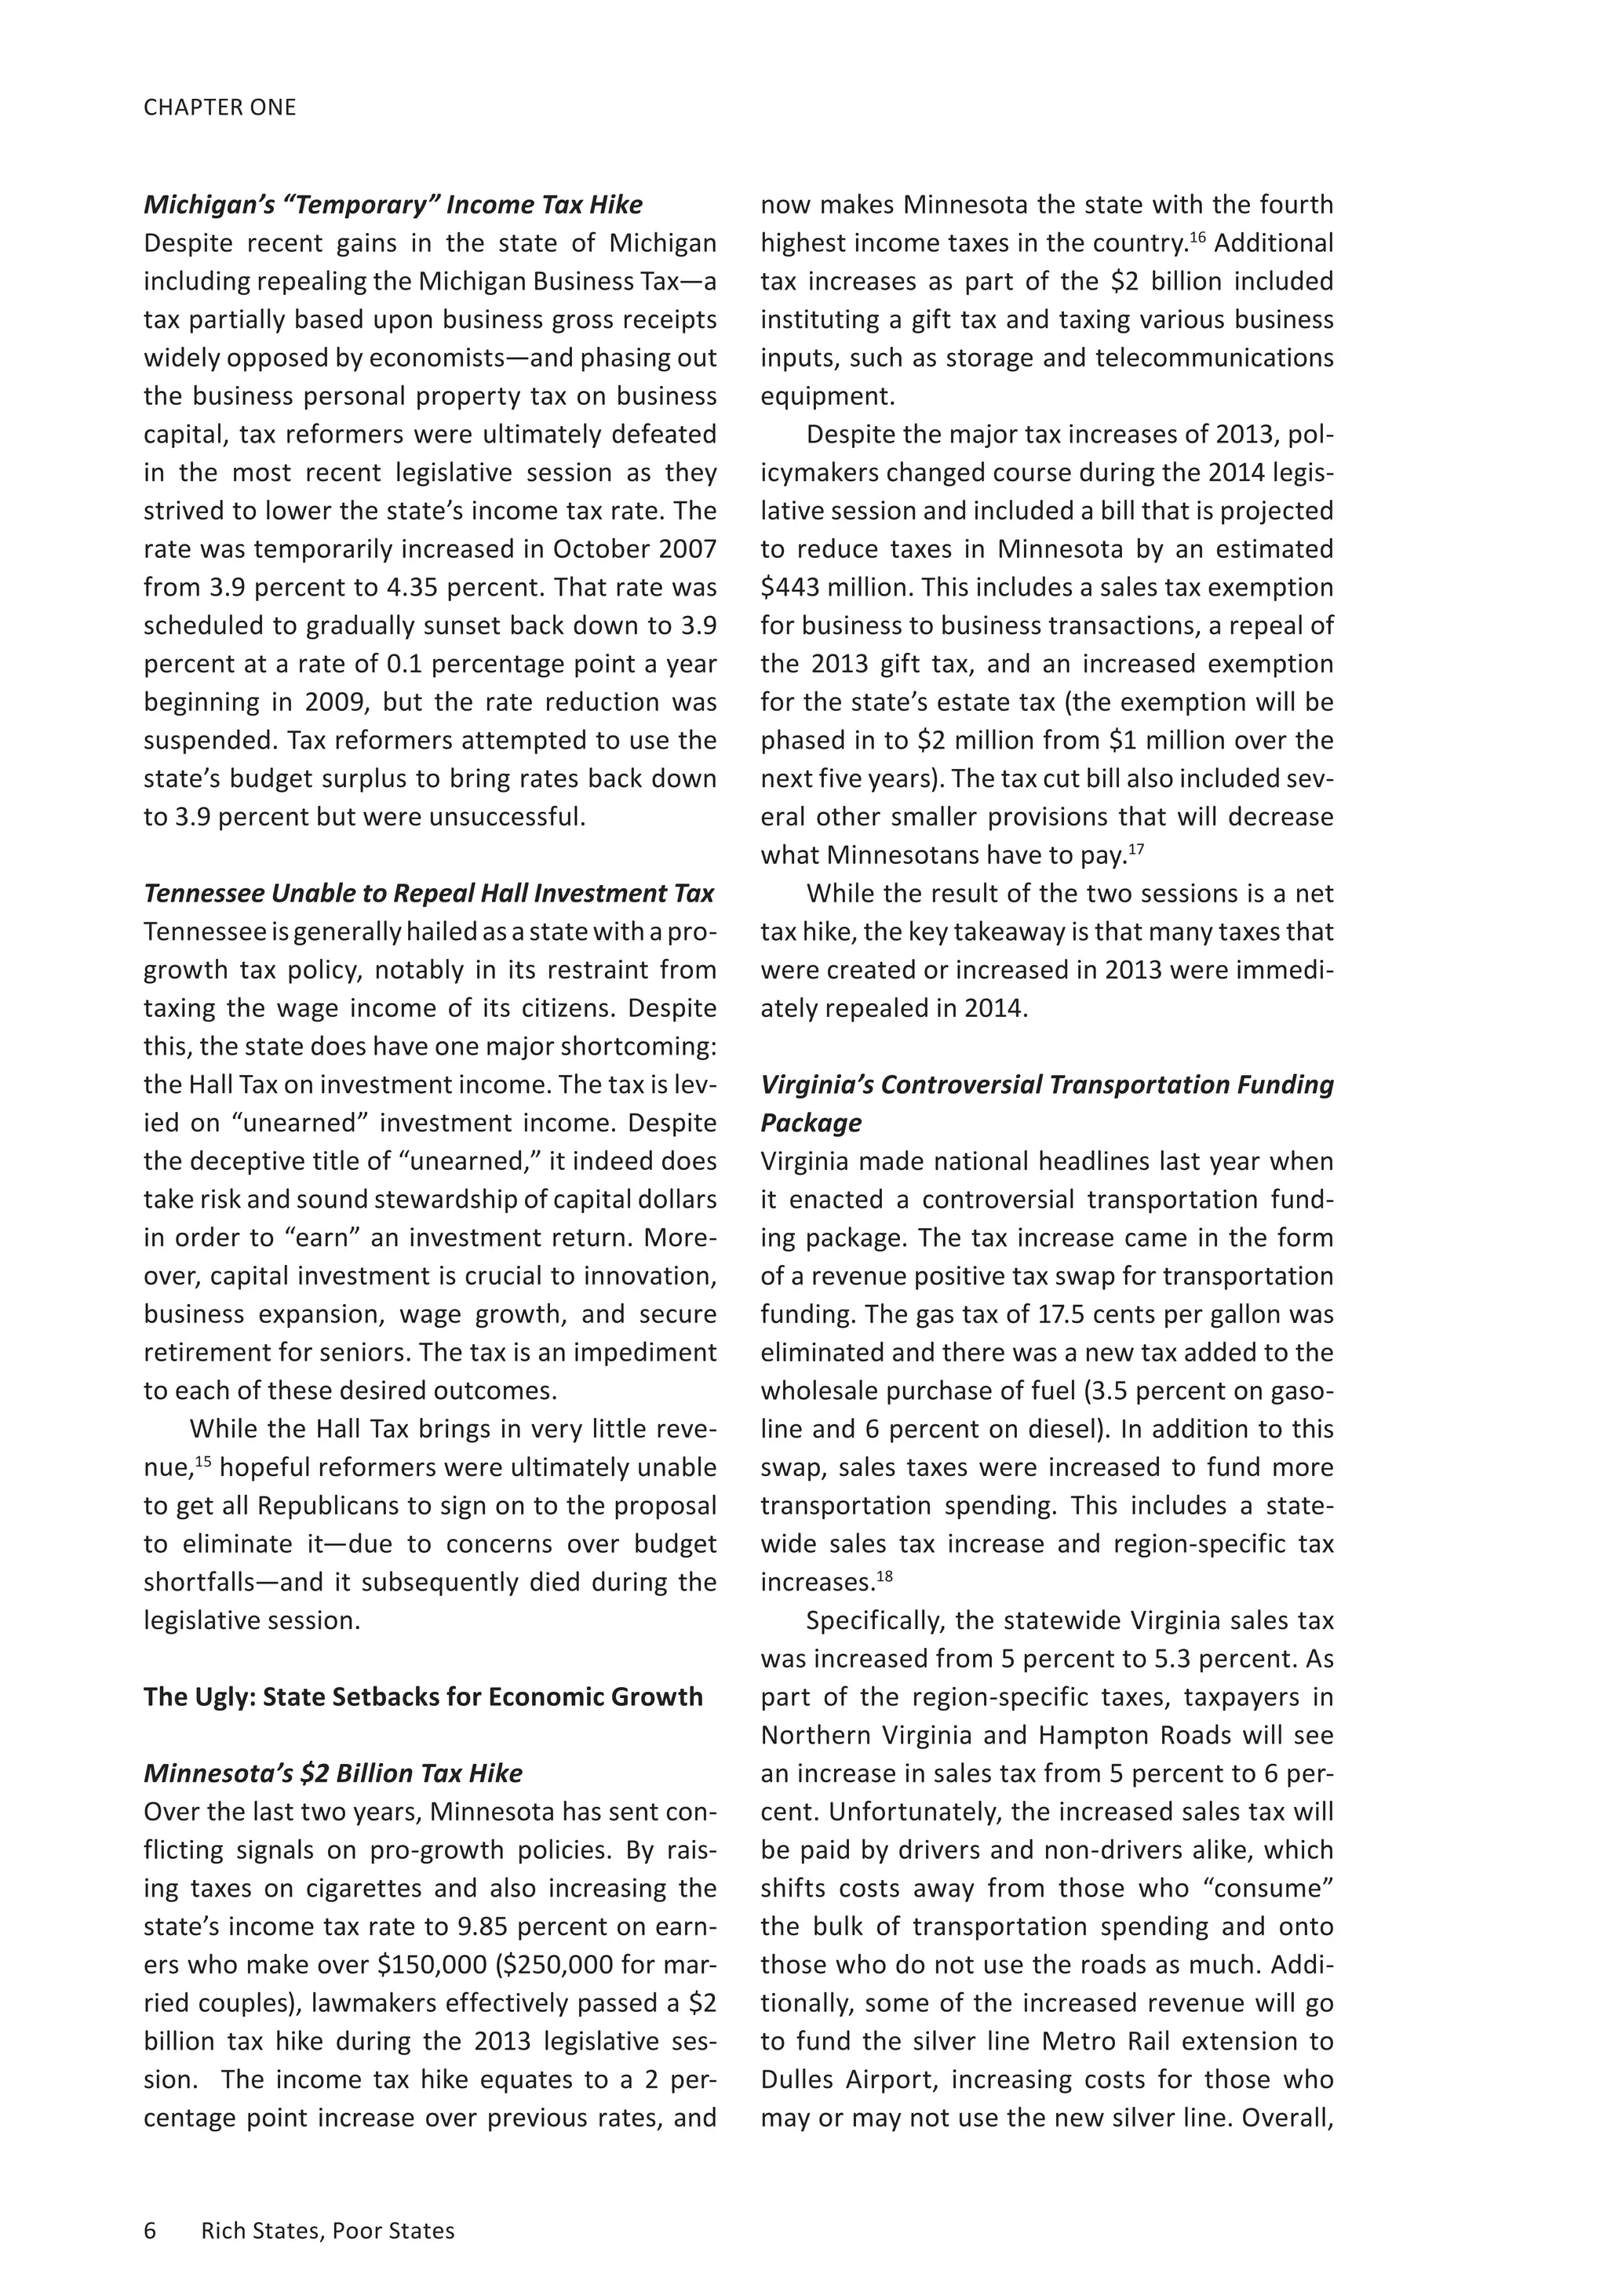
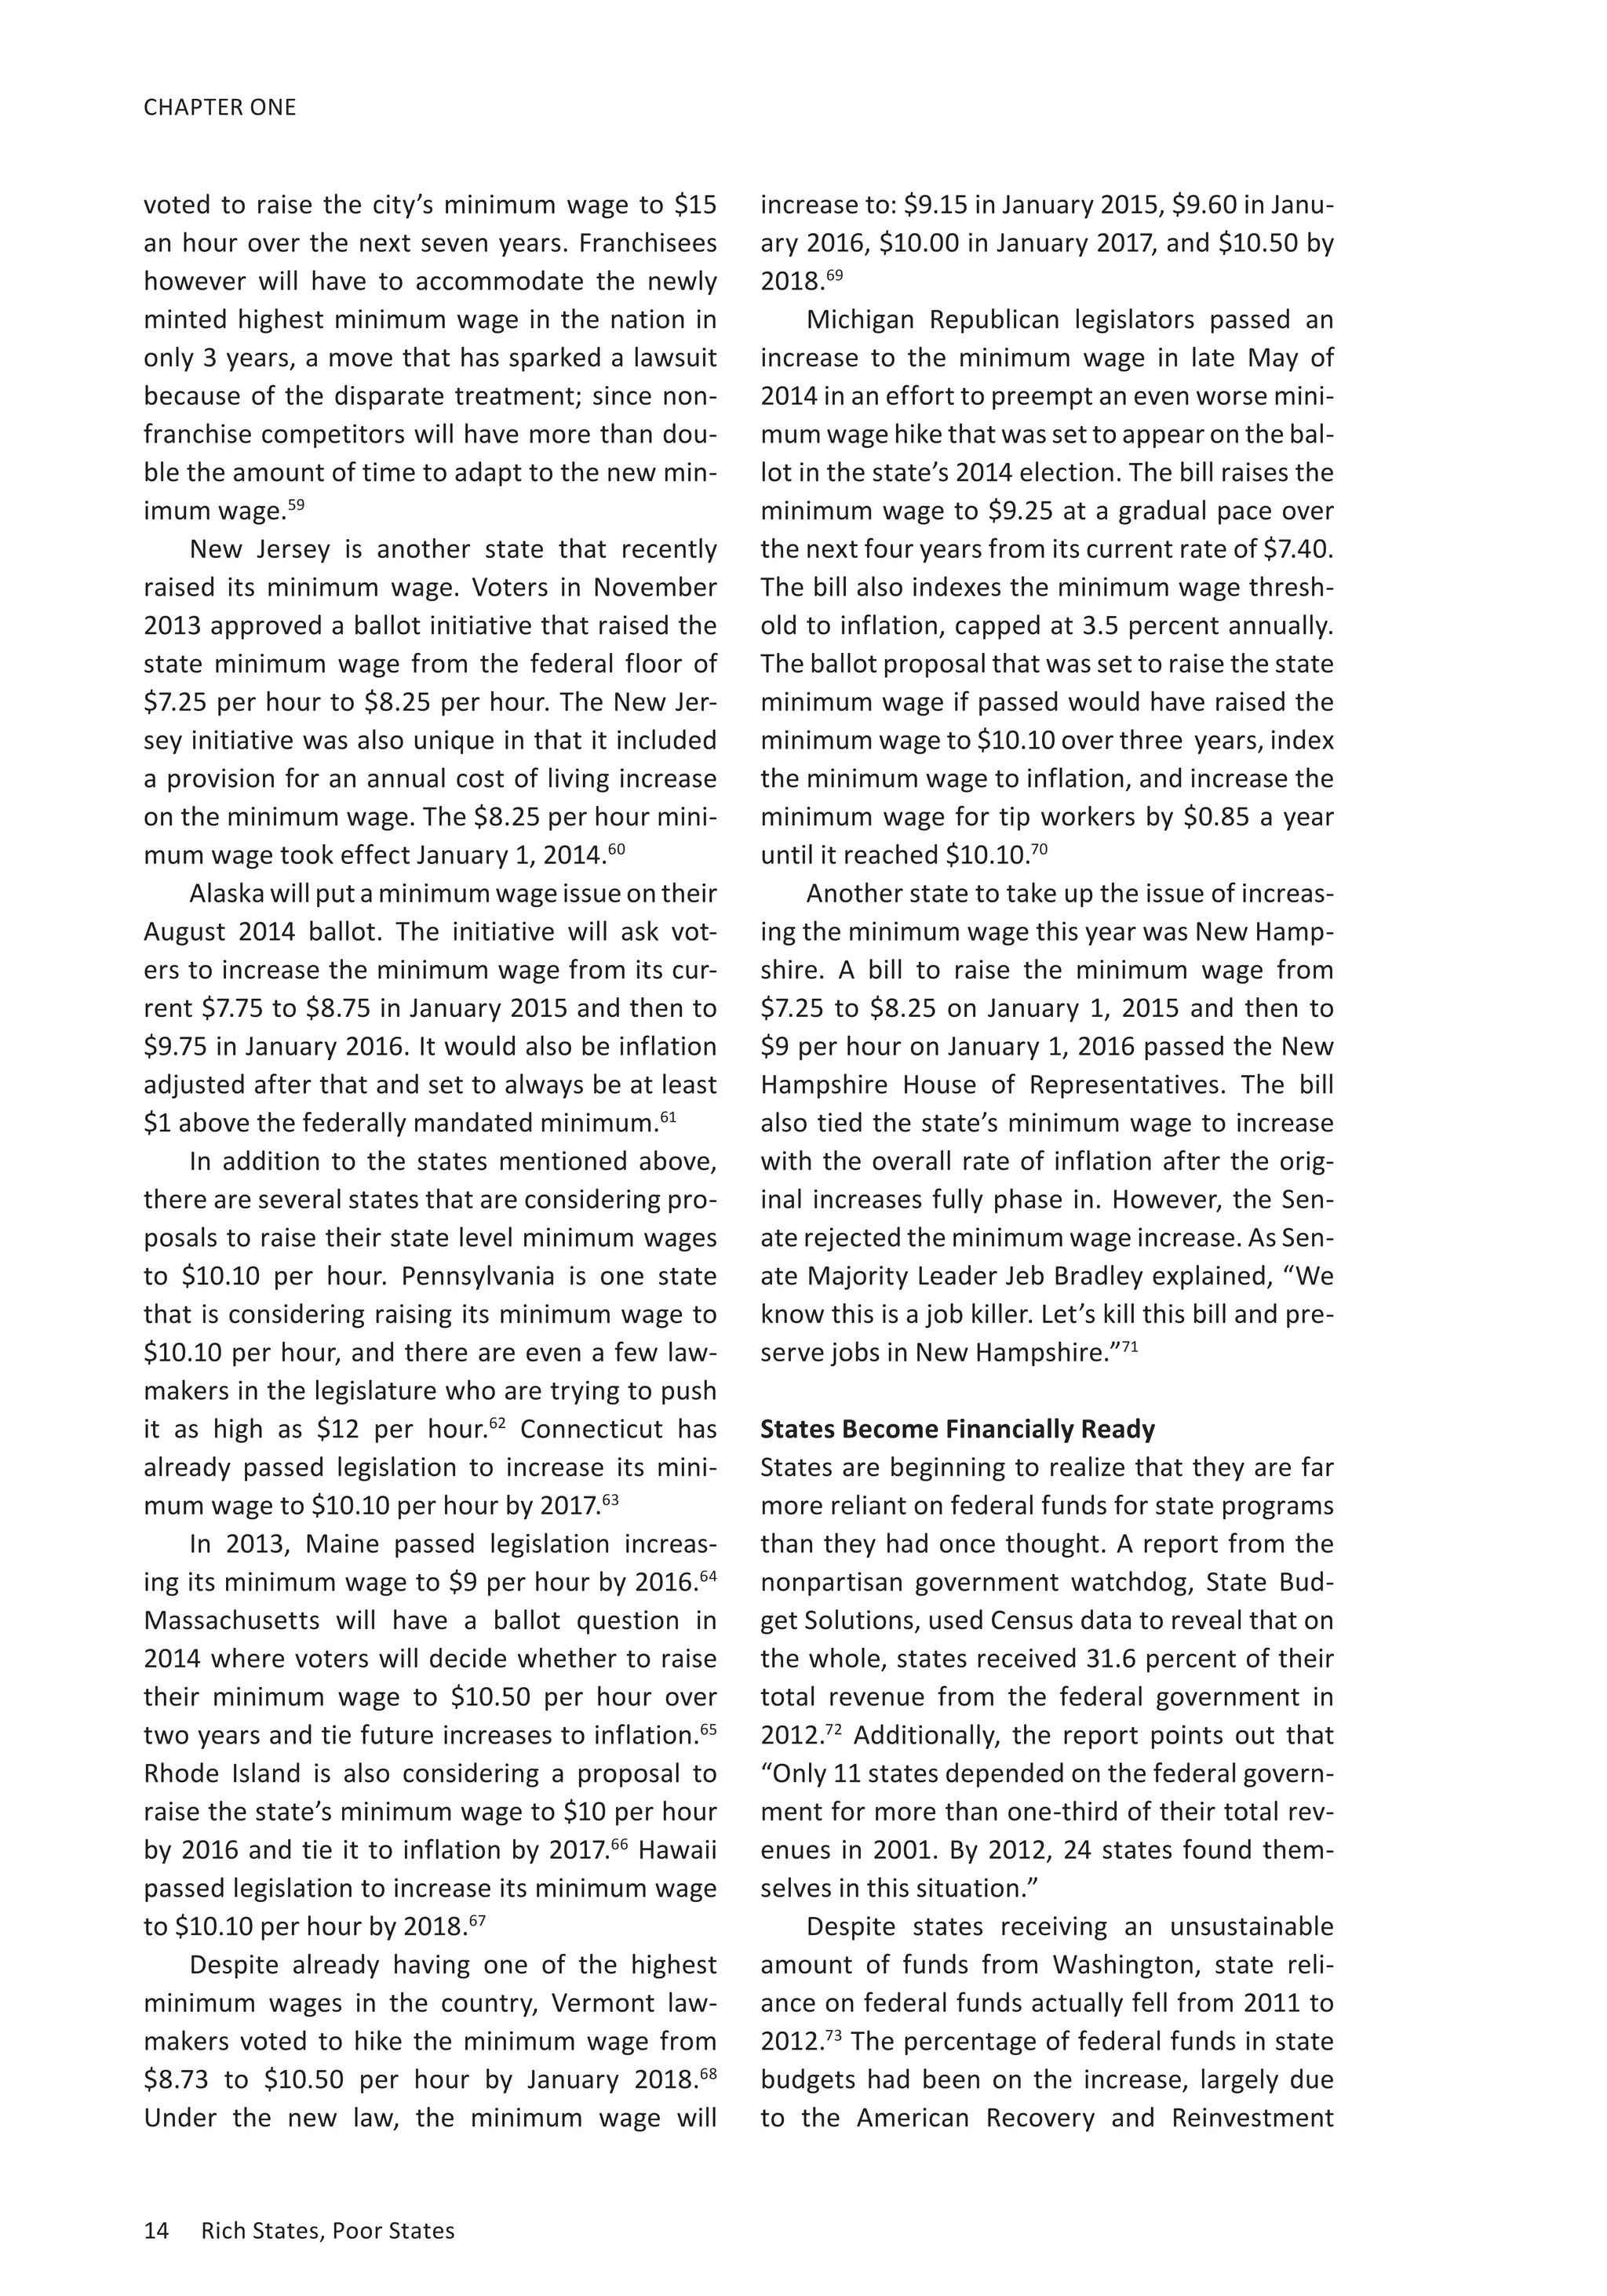
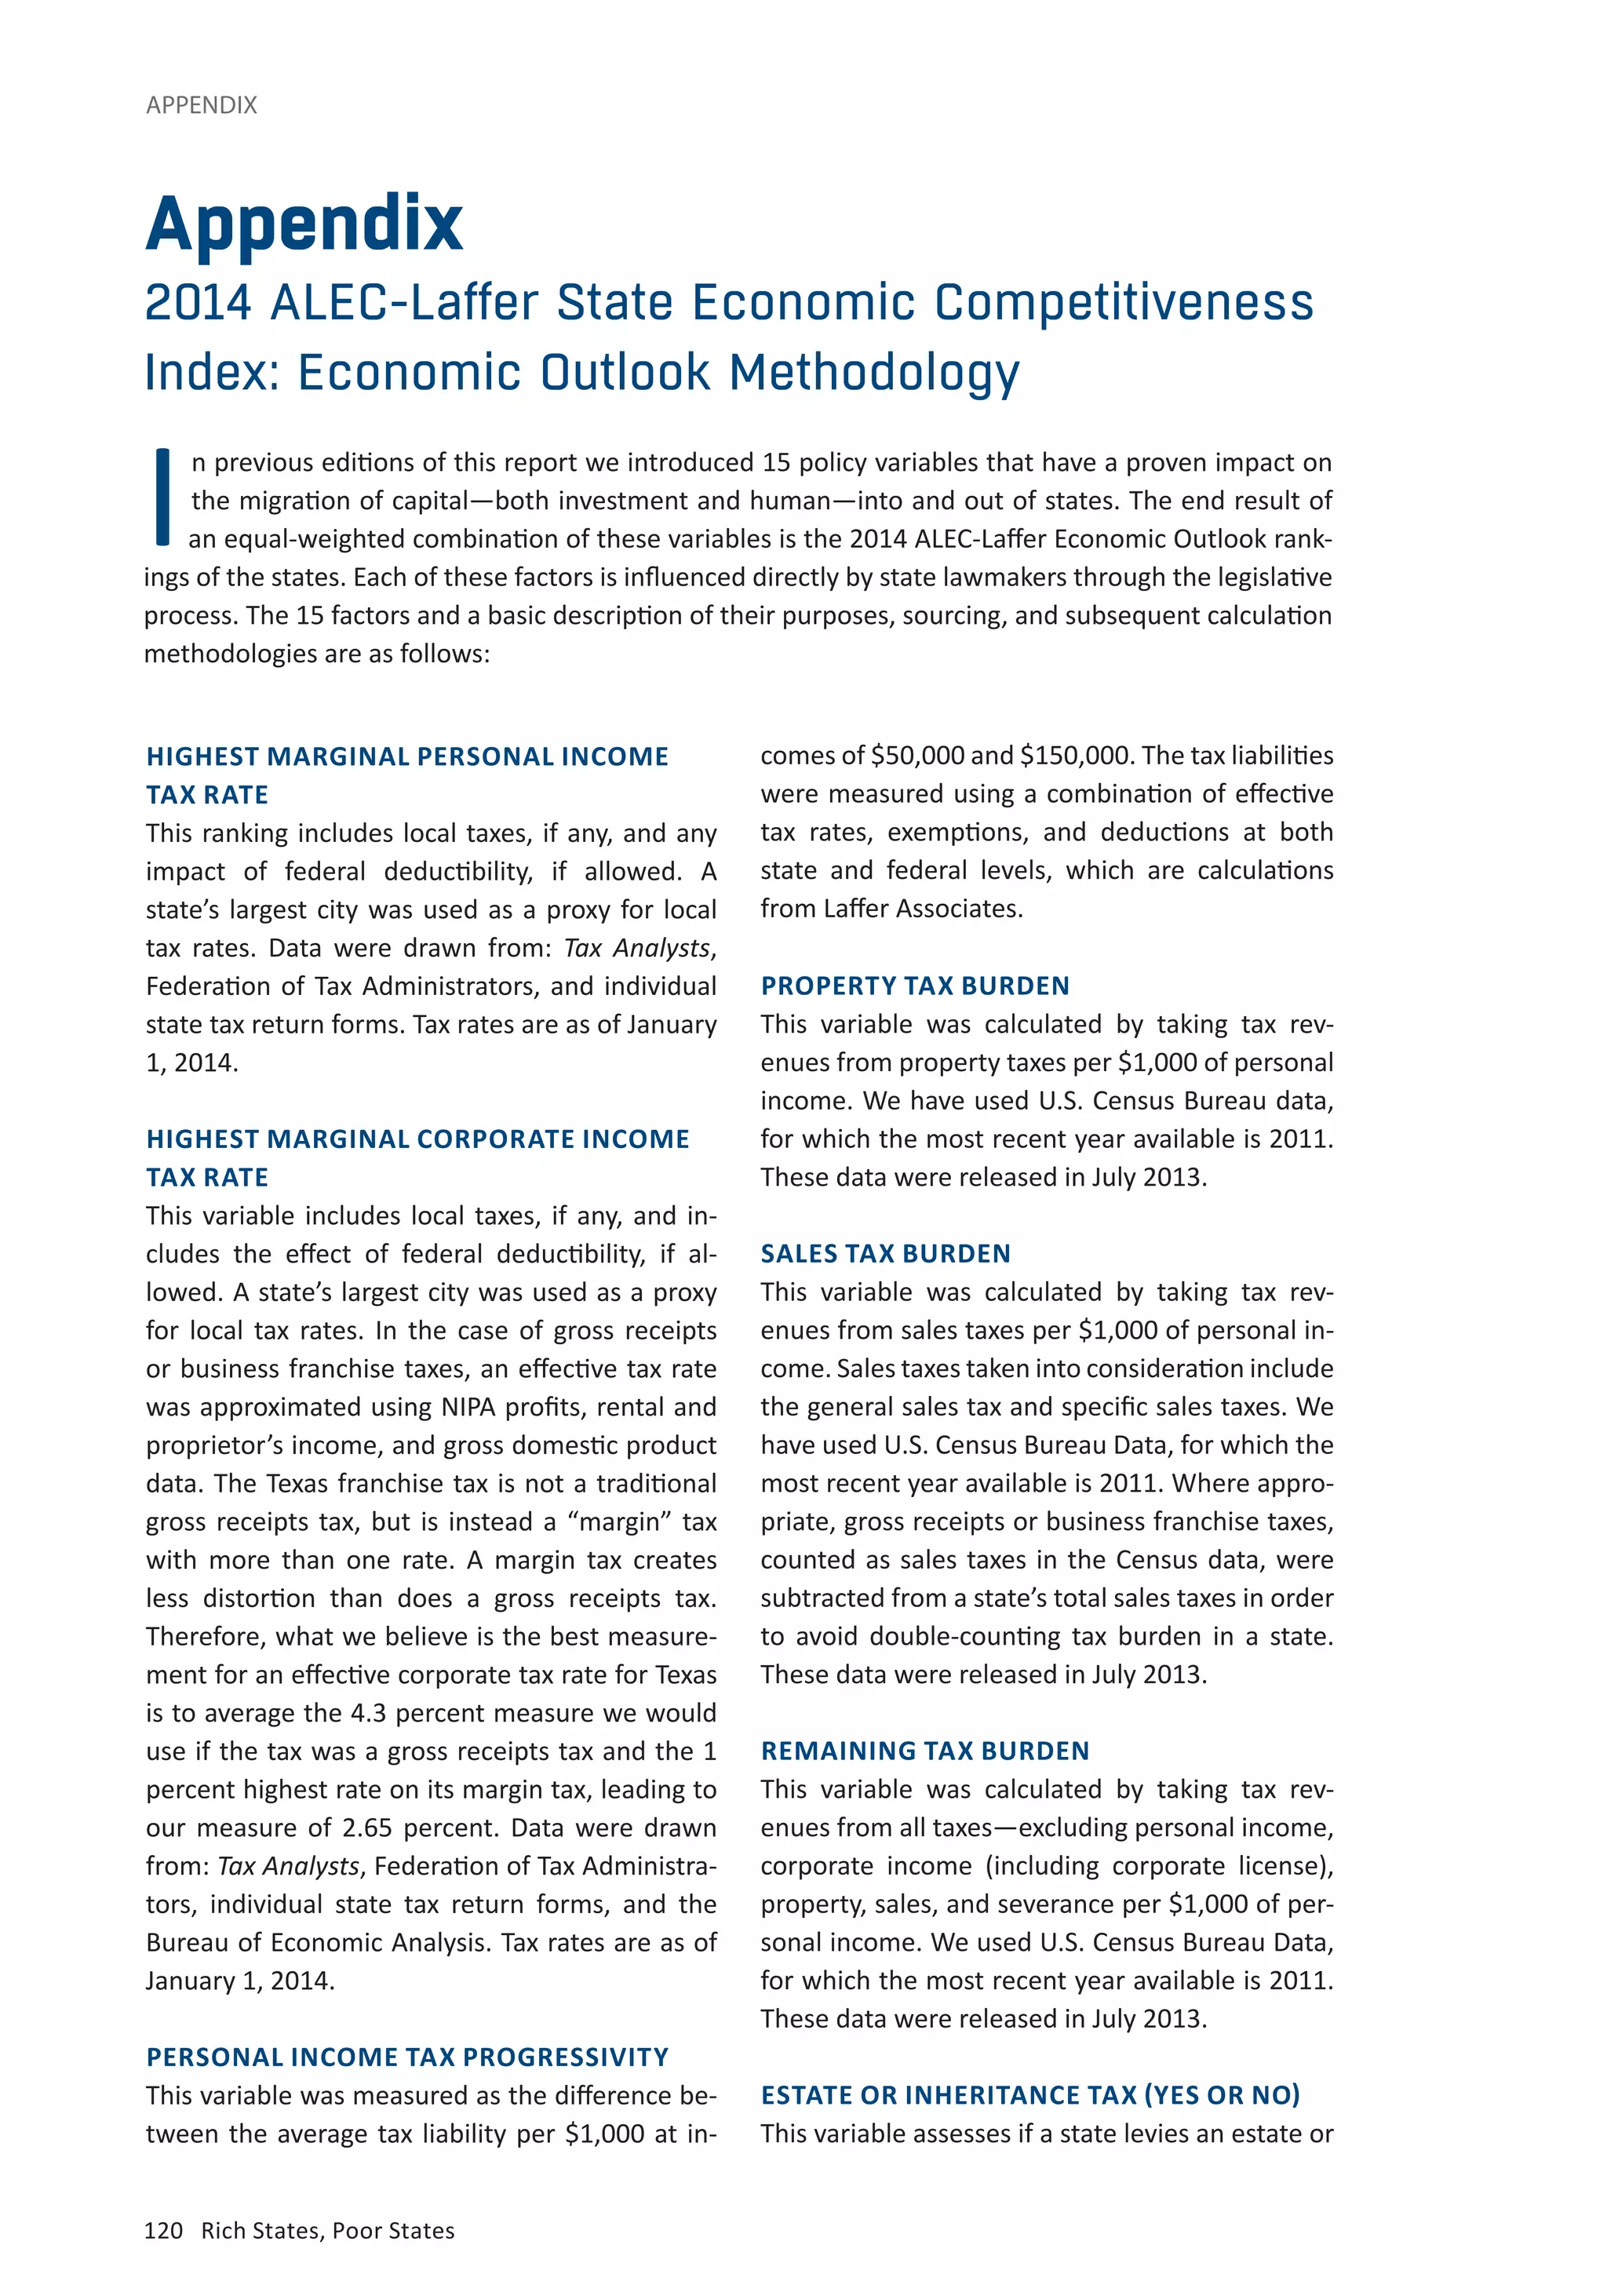
![RACE TO THE TOP
www.alec.org 57
Tax Cuts and Debt—Does More of
One Lead to More of the Other?
The next issue in this “race to the bottom” de-bate
is whether tax reductions lead to a subse-quent
deterioration in a state’s fiscal condition.
The evidence from the 1990s and 2000s indicates
precisely the opposite. If tax cuts contribute to
fiscal deterioration, then the bond ratings of
states that cut taxes should be worse than those
of states that raise them. A Cato Institute com-parison
of tax raising and tax cutting states in the
early 1990s found that in the tax cutting states,
the average Moody’s bond rating in 1995 was
between AAA and AA. In the tax raising states,
the average Moody’s bond rating was between
AA and A1. Moreover, the tax cutting states had
much larger budget reserves (7.1 percent of state
expenditures) than the tax increasing states (1.7
percent).52
The best modern example of tax hikes not
helping state bond ratings is the sad plight of
Illinois. In January 2011 Illinois Gov. Pat Quinn
bullied through the legislature a 67 percent
personal income tax hike, the biggest in state
history.53 The income tax rose to five percent from
three percent. The corporate tax rate soared to
9.5 percent, giving the state the fourth highest
corporate tax rate in the industrialized world. This
provoked Indiana Gov. Mitch Daniels to remark
that being a neighboring state to Illinois was like
living down the street from the Simpsons.54
Two and a half years later, Springfield was still
swimming in red ink. According to a 2013 report
by the state comptroller, Illinois finished the 2011
fiscal year $6.1 billion in the red with the amount
of unpaid bills expected to grow to about $9 bil-lion
by December.55
Most astounding is what has happened to Il-linois’
bond ratings. A 2013 analysis from the Il-linois
Policy Institute reports that the Land of Lin-coln
“has suffered 13 downgrades from the three
major rating agencies since Gov. Pat Quinn took
office in 2009.”56 In the summer of 2013, Fitch
Ratings and Moody’s Investors Service downgrad-ed
Illinois to A- and A3 respectively.57 Then Fitch
further chopped Chicago’s credit rating by an un-usually
large three notches to AA- on $8 billion
of debt.
We’re no fans of exclusively using bond rat-ings
to measure state health. However it’s in-structive
that even the rating agencies have been
forced to concede that giant tax hikes haven’t
solved the structural imbalance, which is driven
by runaway pension costs. Moody’s explained its
downgrade by noting “severe pension liabilities
[are] the state’s greatest credit challenge.”58 Stan-dard
and Poor’s has even gone so far as to call
low reliance on income taxes a strong boon to
a high credit rating due to the incredible volatil-ity
of income tax relative to consumption taxes or
property taxes.59
As for Illinois, the “optimistic” estimate is
that taxpayers are facing a $97 billion unfunded
public employee pension deficit. Using a more re-alisitic
estimate on the rate of return on pension
reserves, however, widens that gap to closer to
$200 billion.60
Minor pension reform band aids signed by
Mr. Quinn haven’t stopped the fiscal bleeding,
while tax increases have arguably made the pen-sion
crisis worse by delaying action. In the Windy
City, Mayor Rahm Emanuel’s solution is to try to
plug a multi-billion funding gap by taxing smokers
another 75 cents a pack.
Meanwhile, Indiana and Iowa, neighbors of
Illinois, have cut taxes, not raised them. Despite
this, both states have balanced budgets and AAA
bond ratings.62
However, that is not the end of the story of
how high tax states like Illinois waste money and
leave their states awash in red ink. An analysis
by the Illinois Policy Institute finds that “eighty
cents of every tax hike dollar went to government
worker pensions,” not to schools, roads, police,
or balancing the budget.63 So Illinois progressives
are hatching their latest tax scheme to scrap the
constitutionally-mandated flat rate income tax,
and replace it with a “progressive” tax that in-cludes
a top rate of 11 percent. That’s more than
double the current rate of five percent and more
than triple the three percent when Gov. Quinn
entered office.
Illinois is one of seven states that constitu-tionally
require that the income tax be applied at
a “non-graduated rate,” i.e., a flat tax (the other
six are Colorado, Indiana, Massachusetts, Michi-gan,
Pennsylvania, and Utah).64 These flat tax
requirements were wisely put into state constitu-tions
on equal protection grounds—that the laws
should apply equally to all citizens. Liberals hate
that because if they want to soak the rich, they](https://image.slidesharecdn.com/rsps-2014-7th-edition-140414230543-phpapp01/75/Rich-States-Poor-States-2014-Edition-71-2048.jpg)


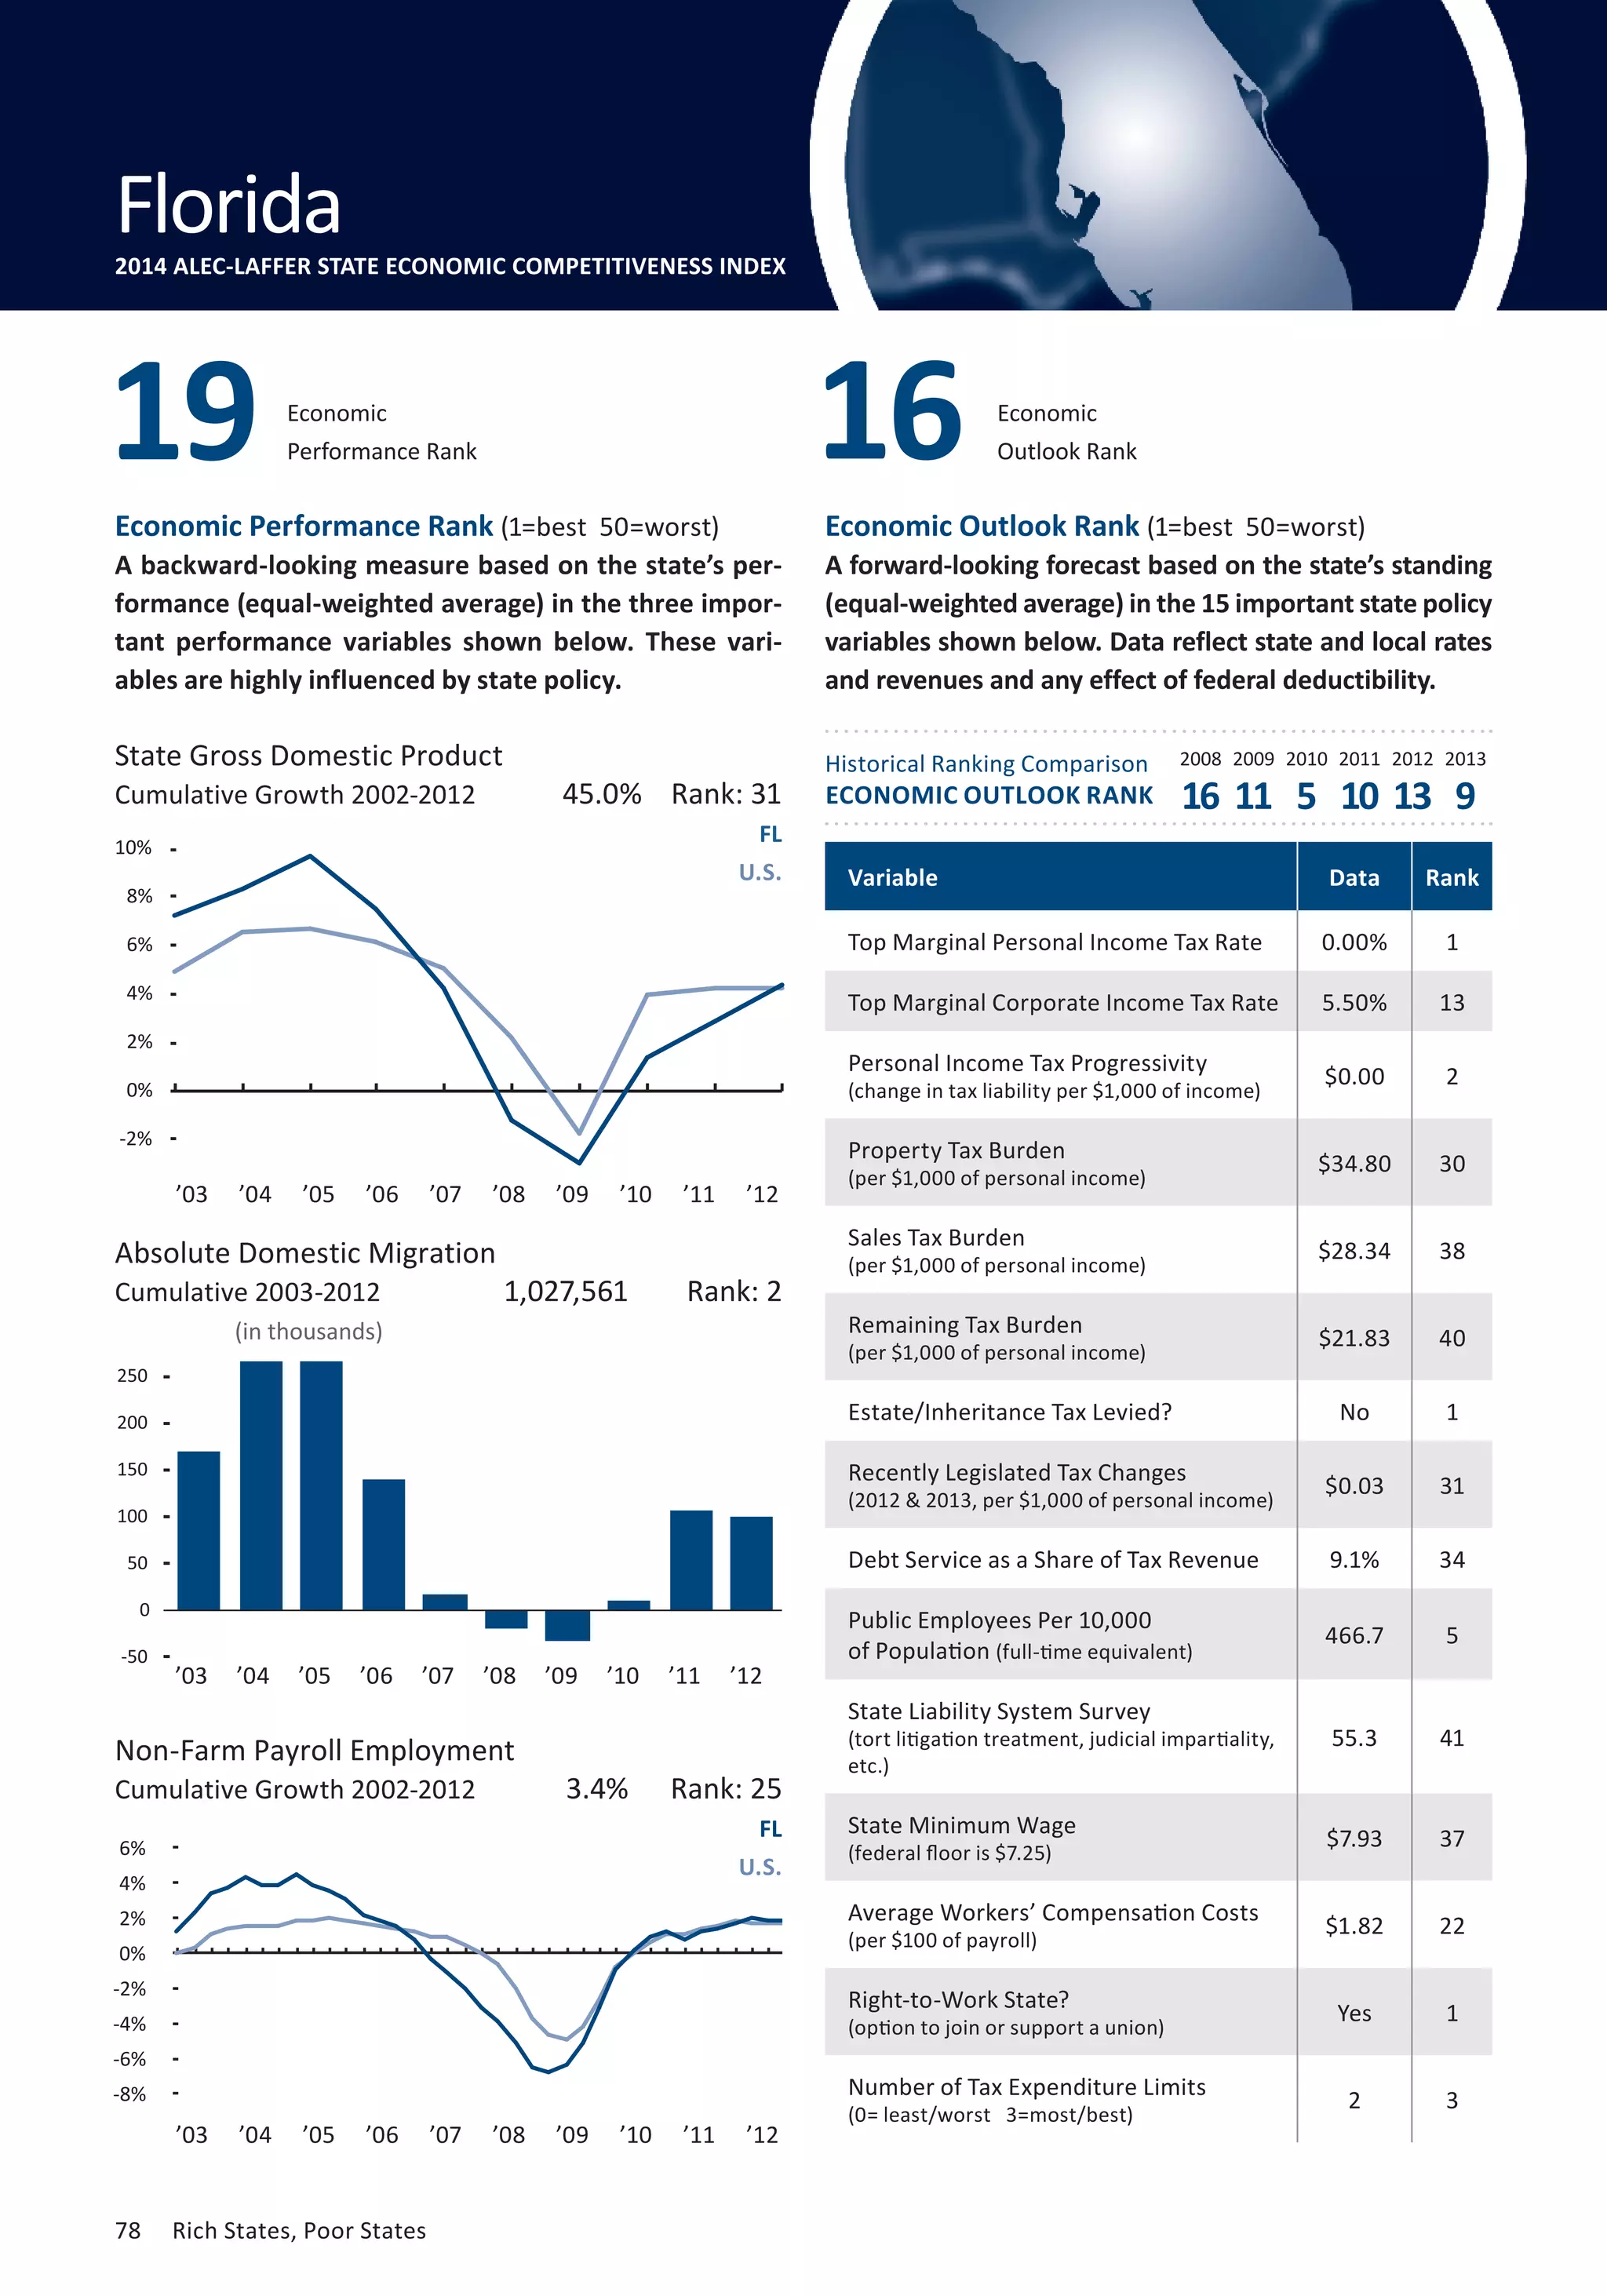
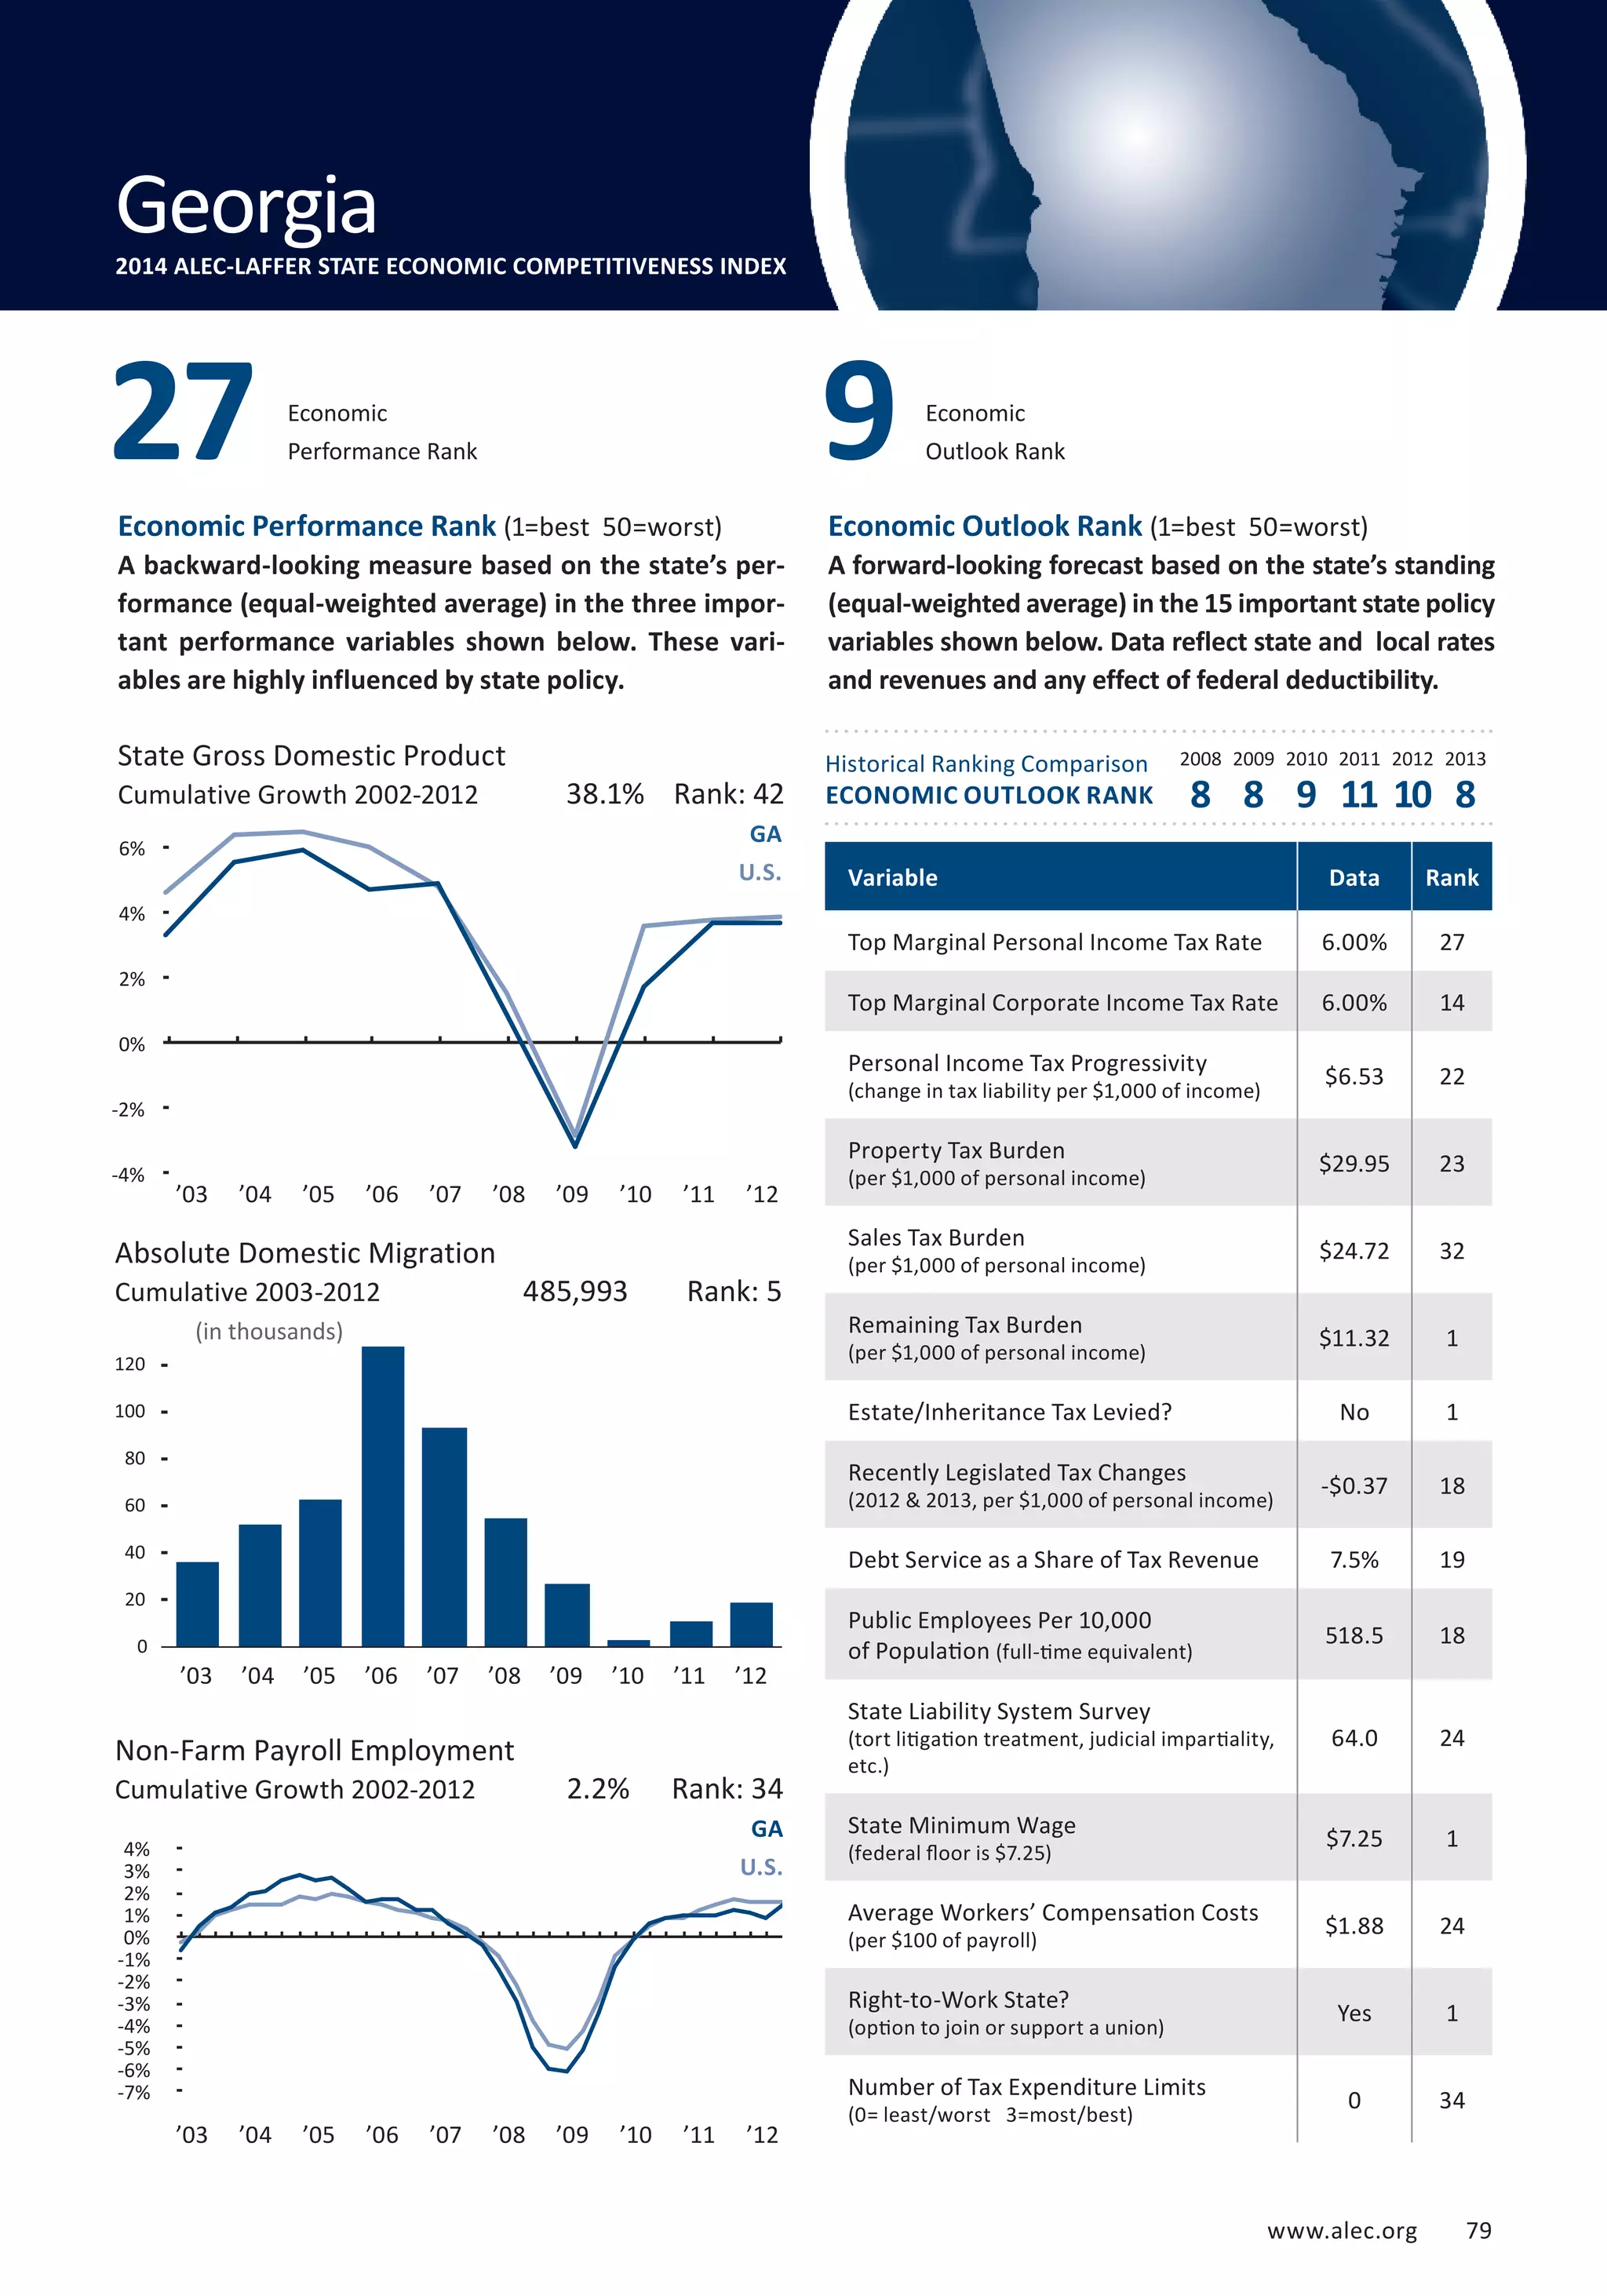
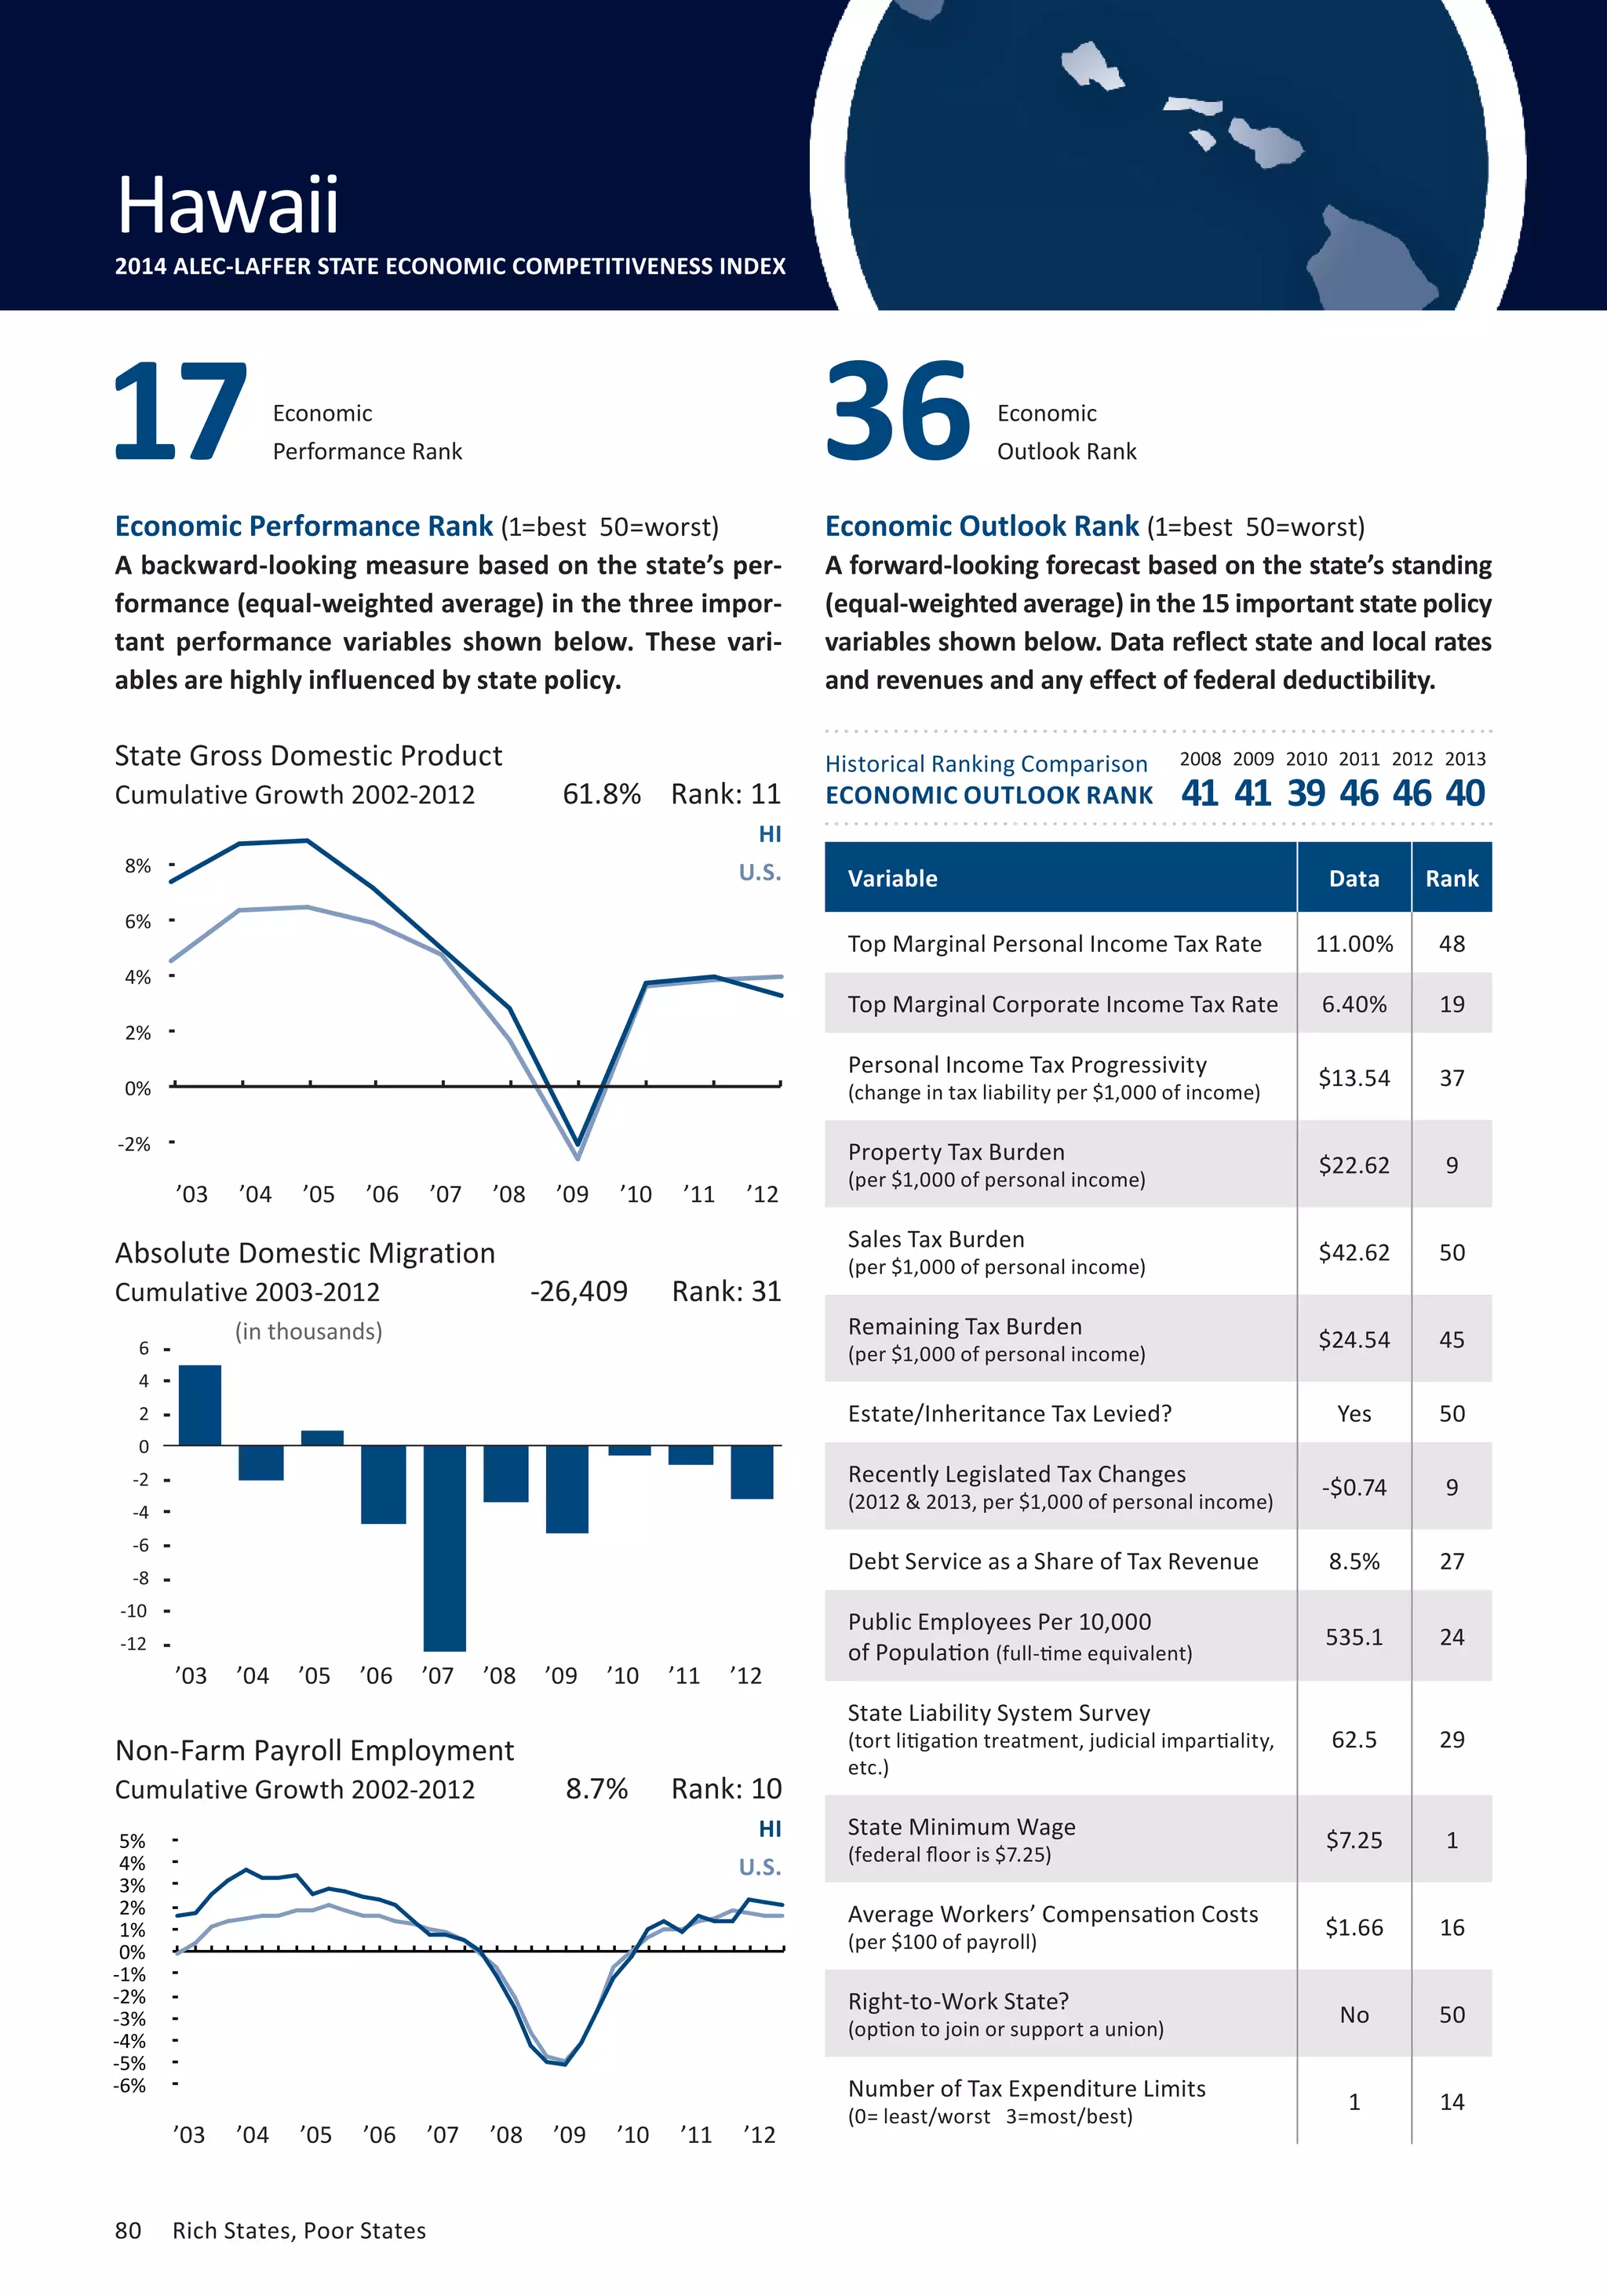

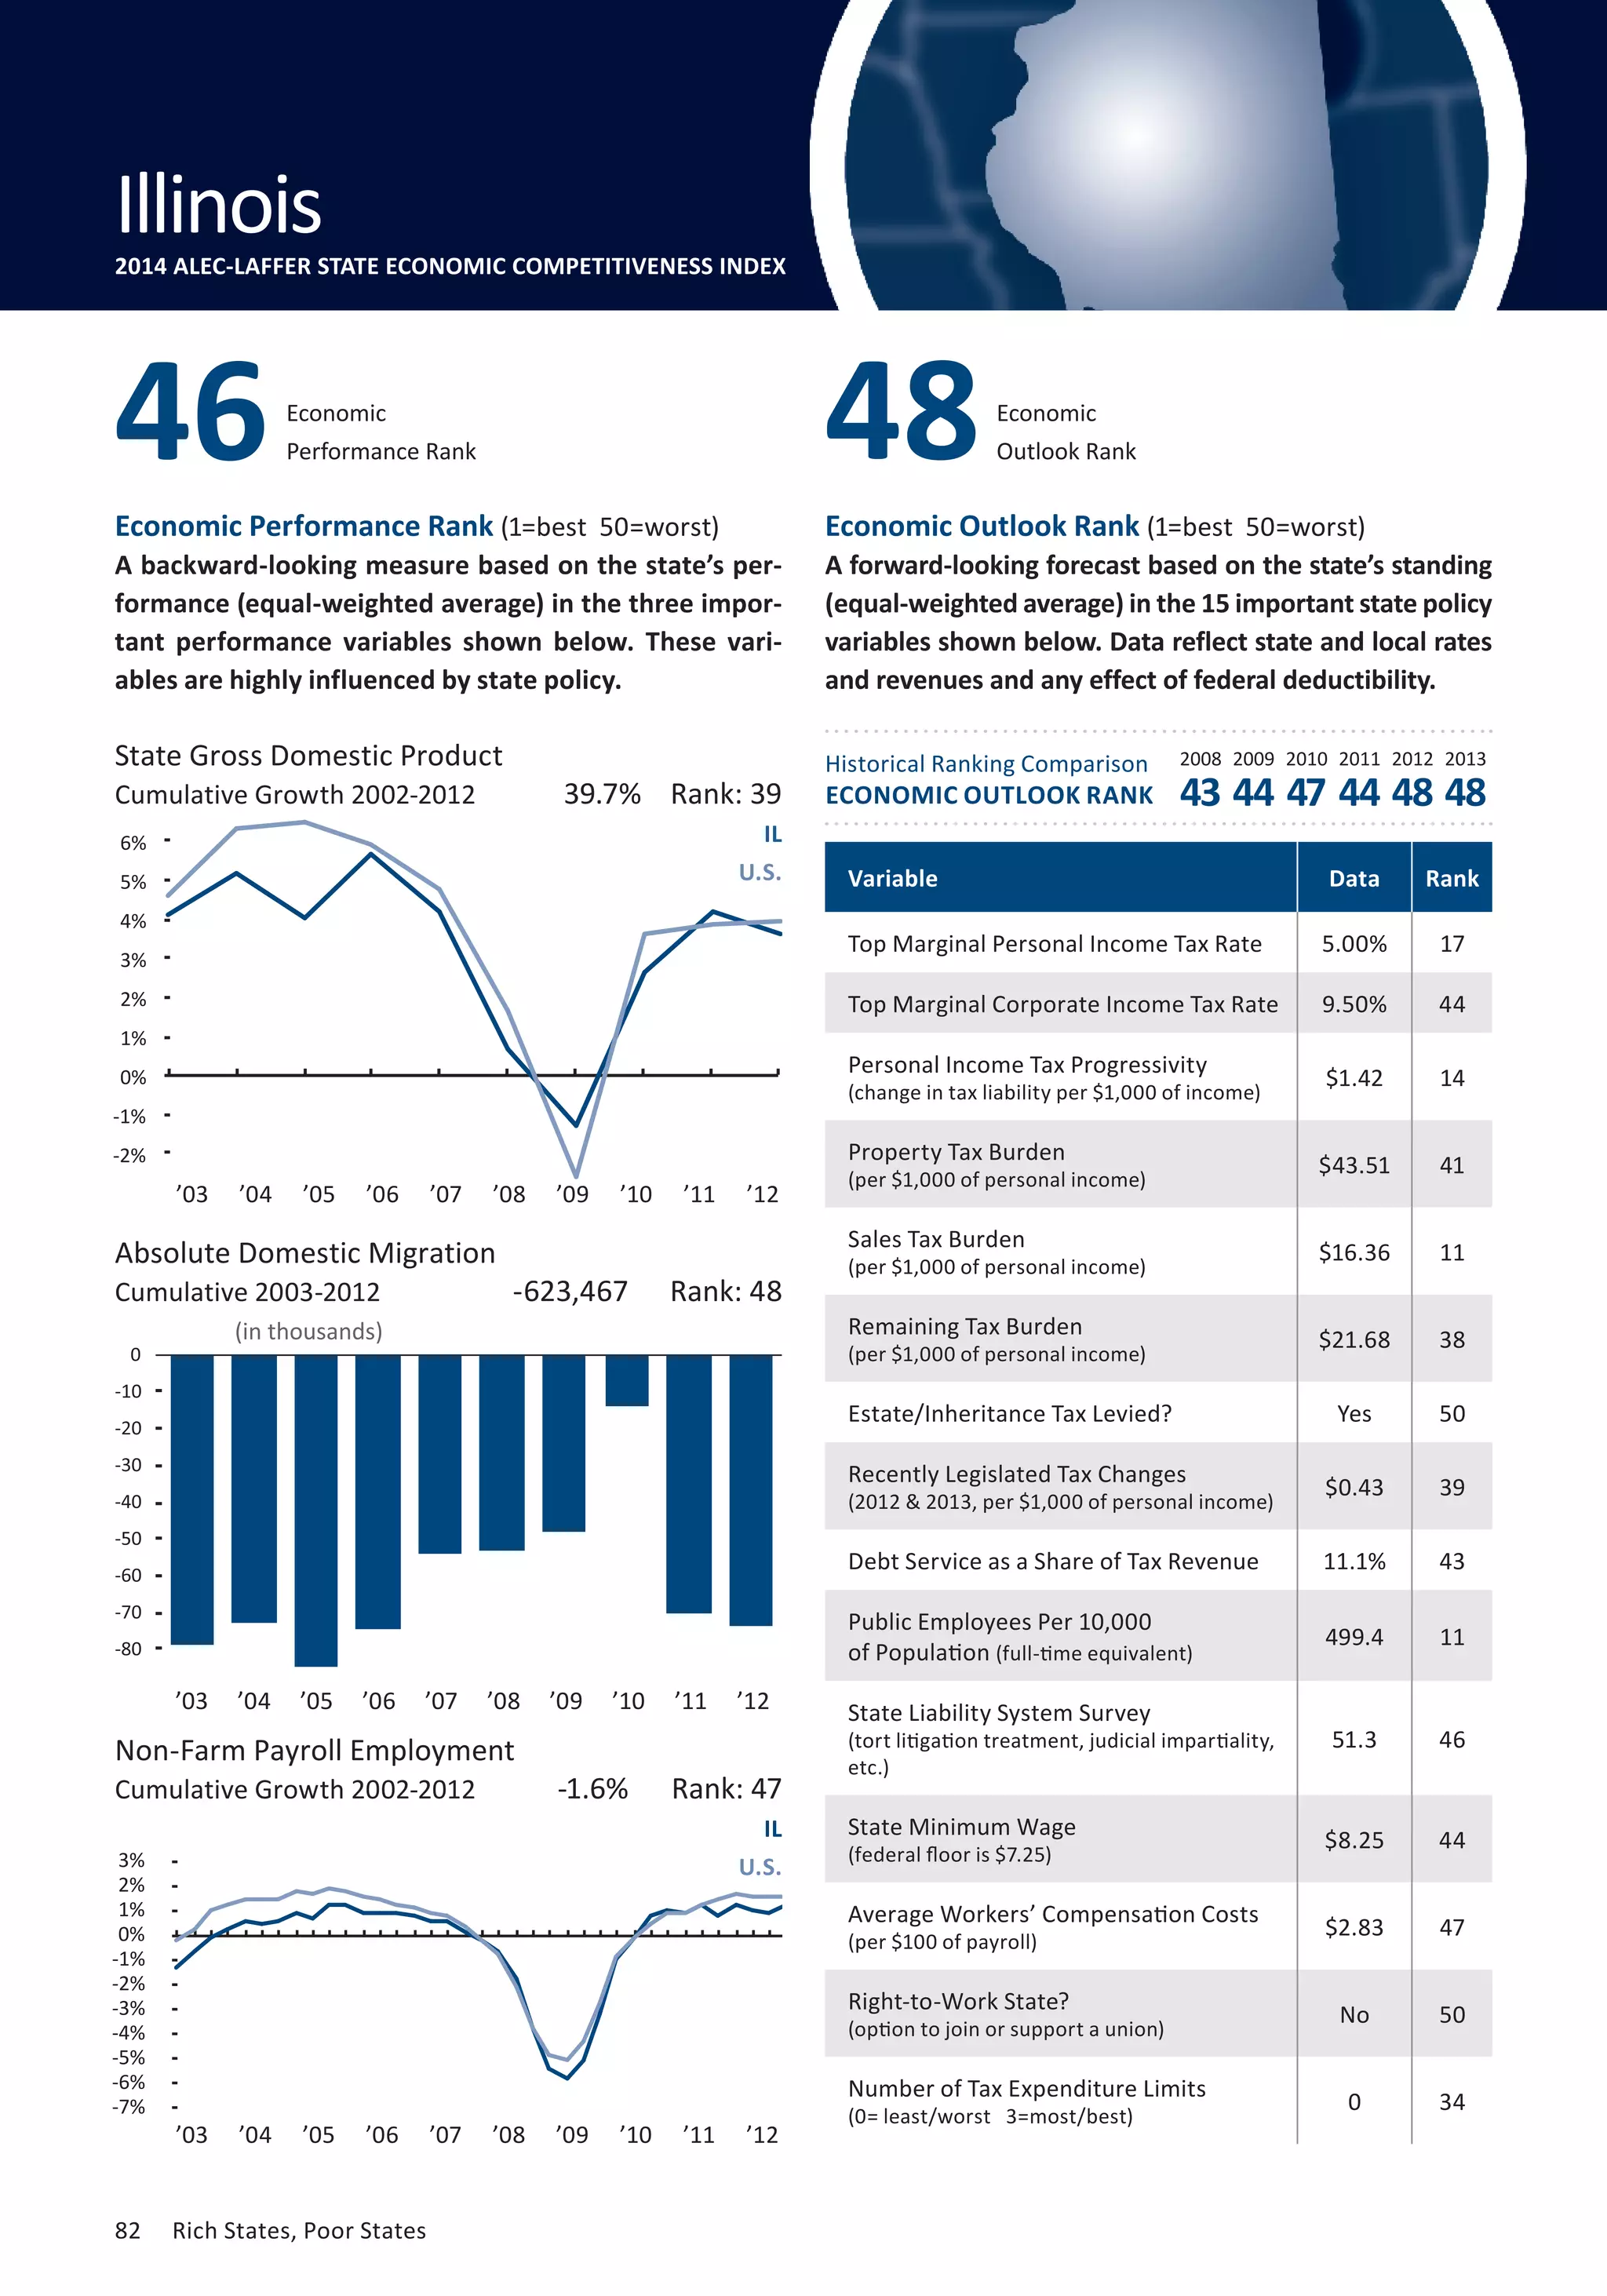
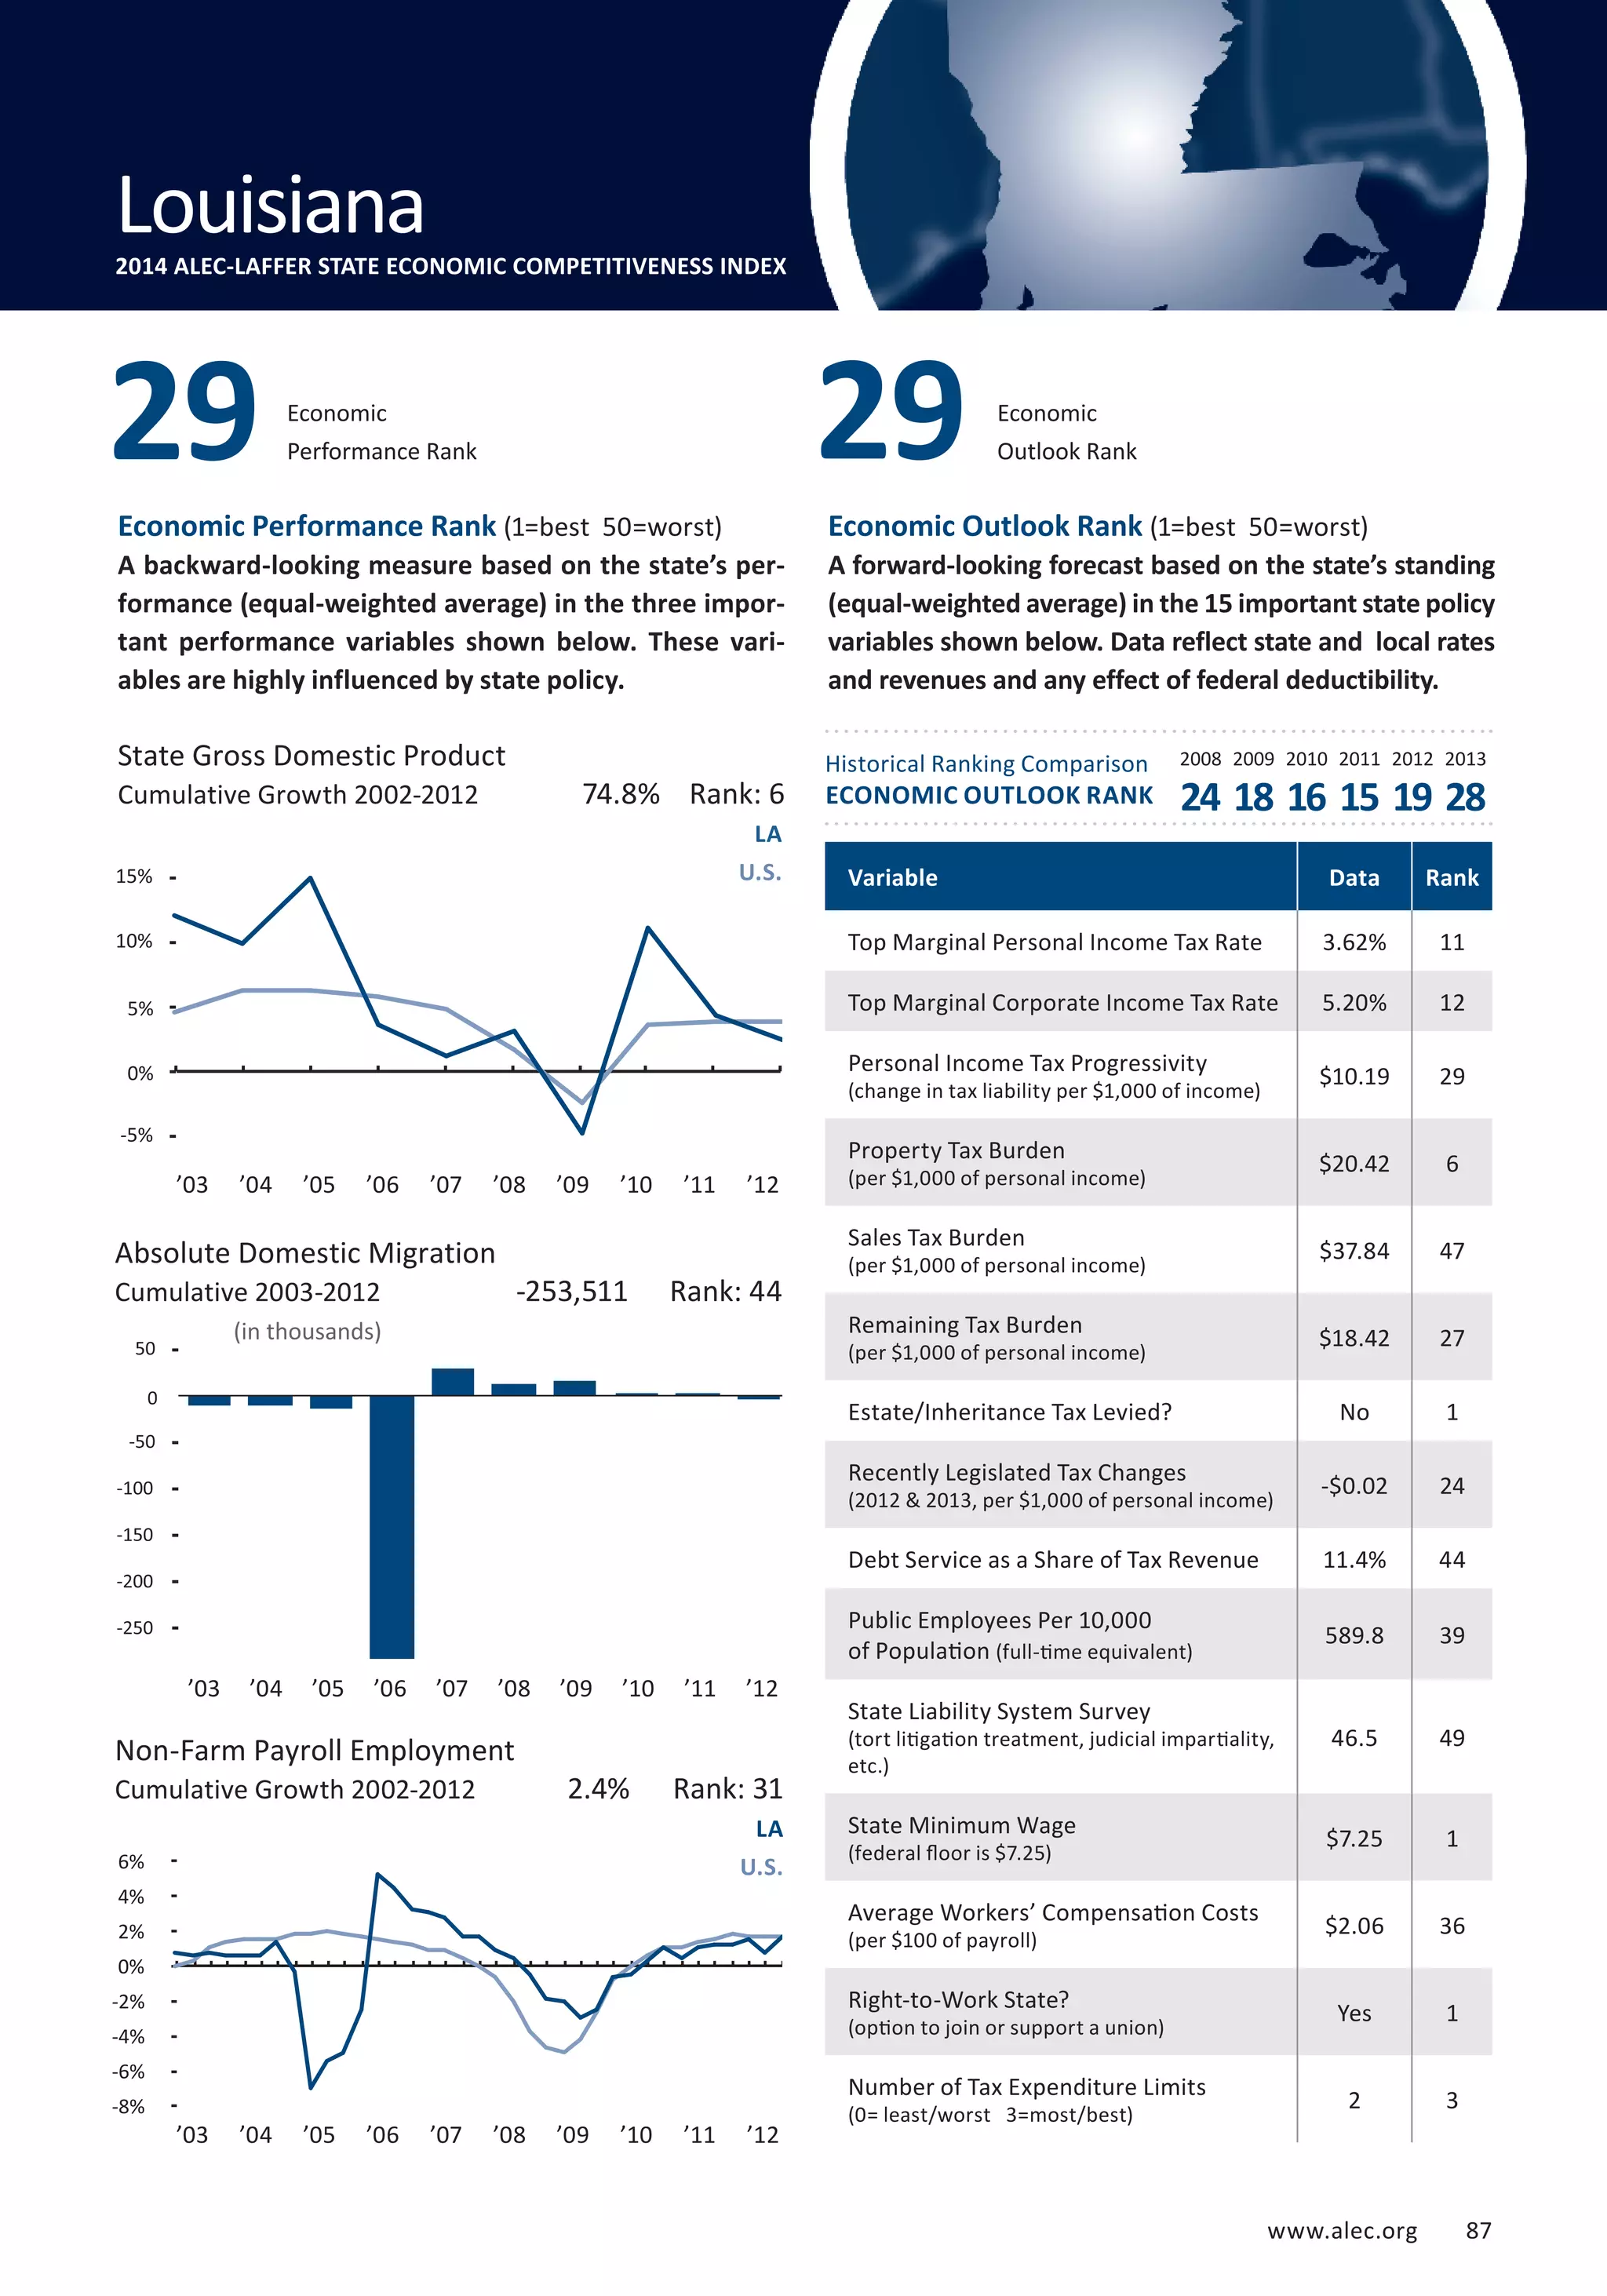
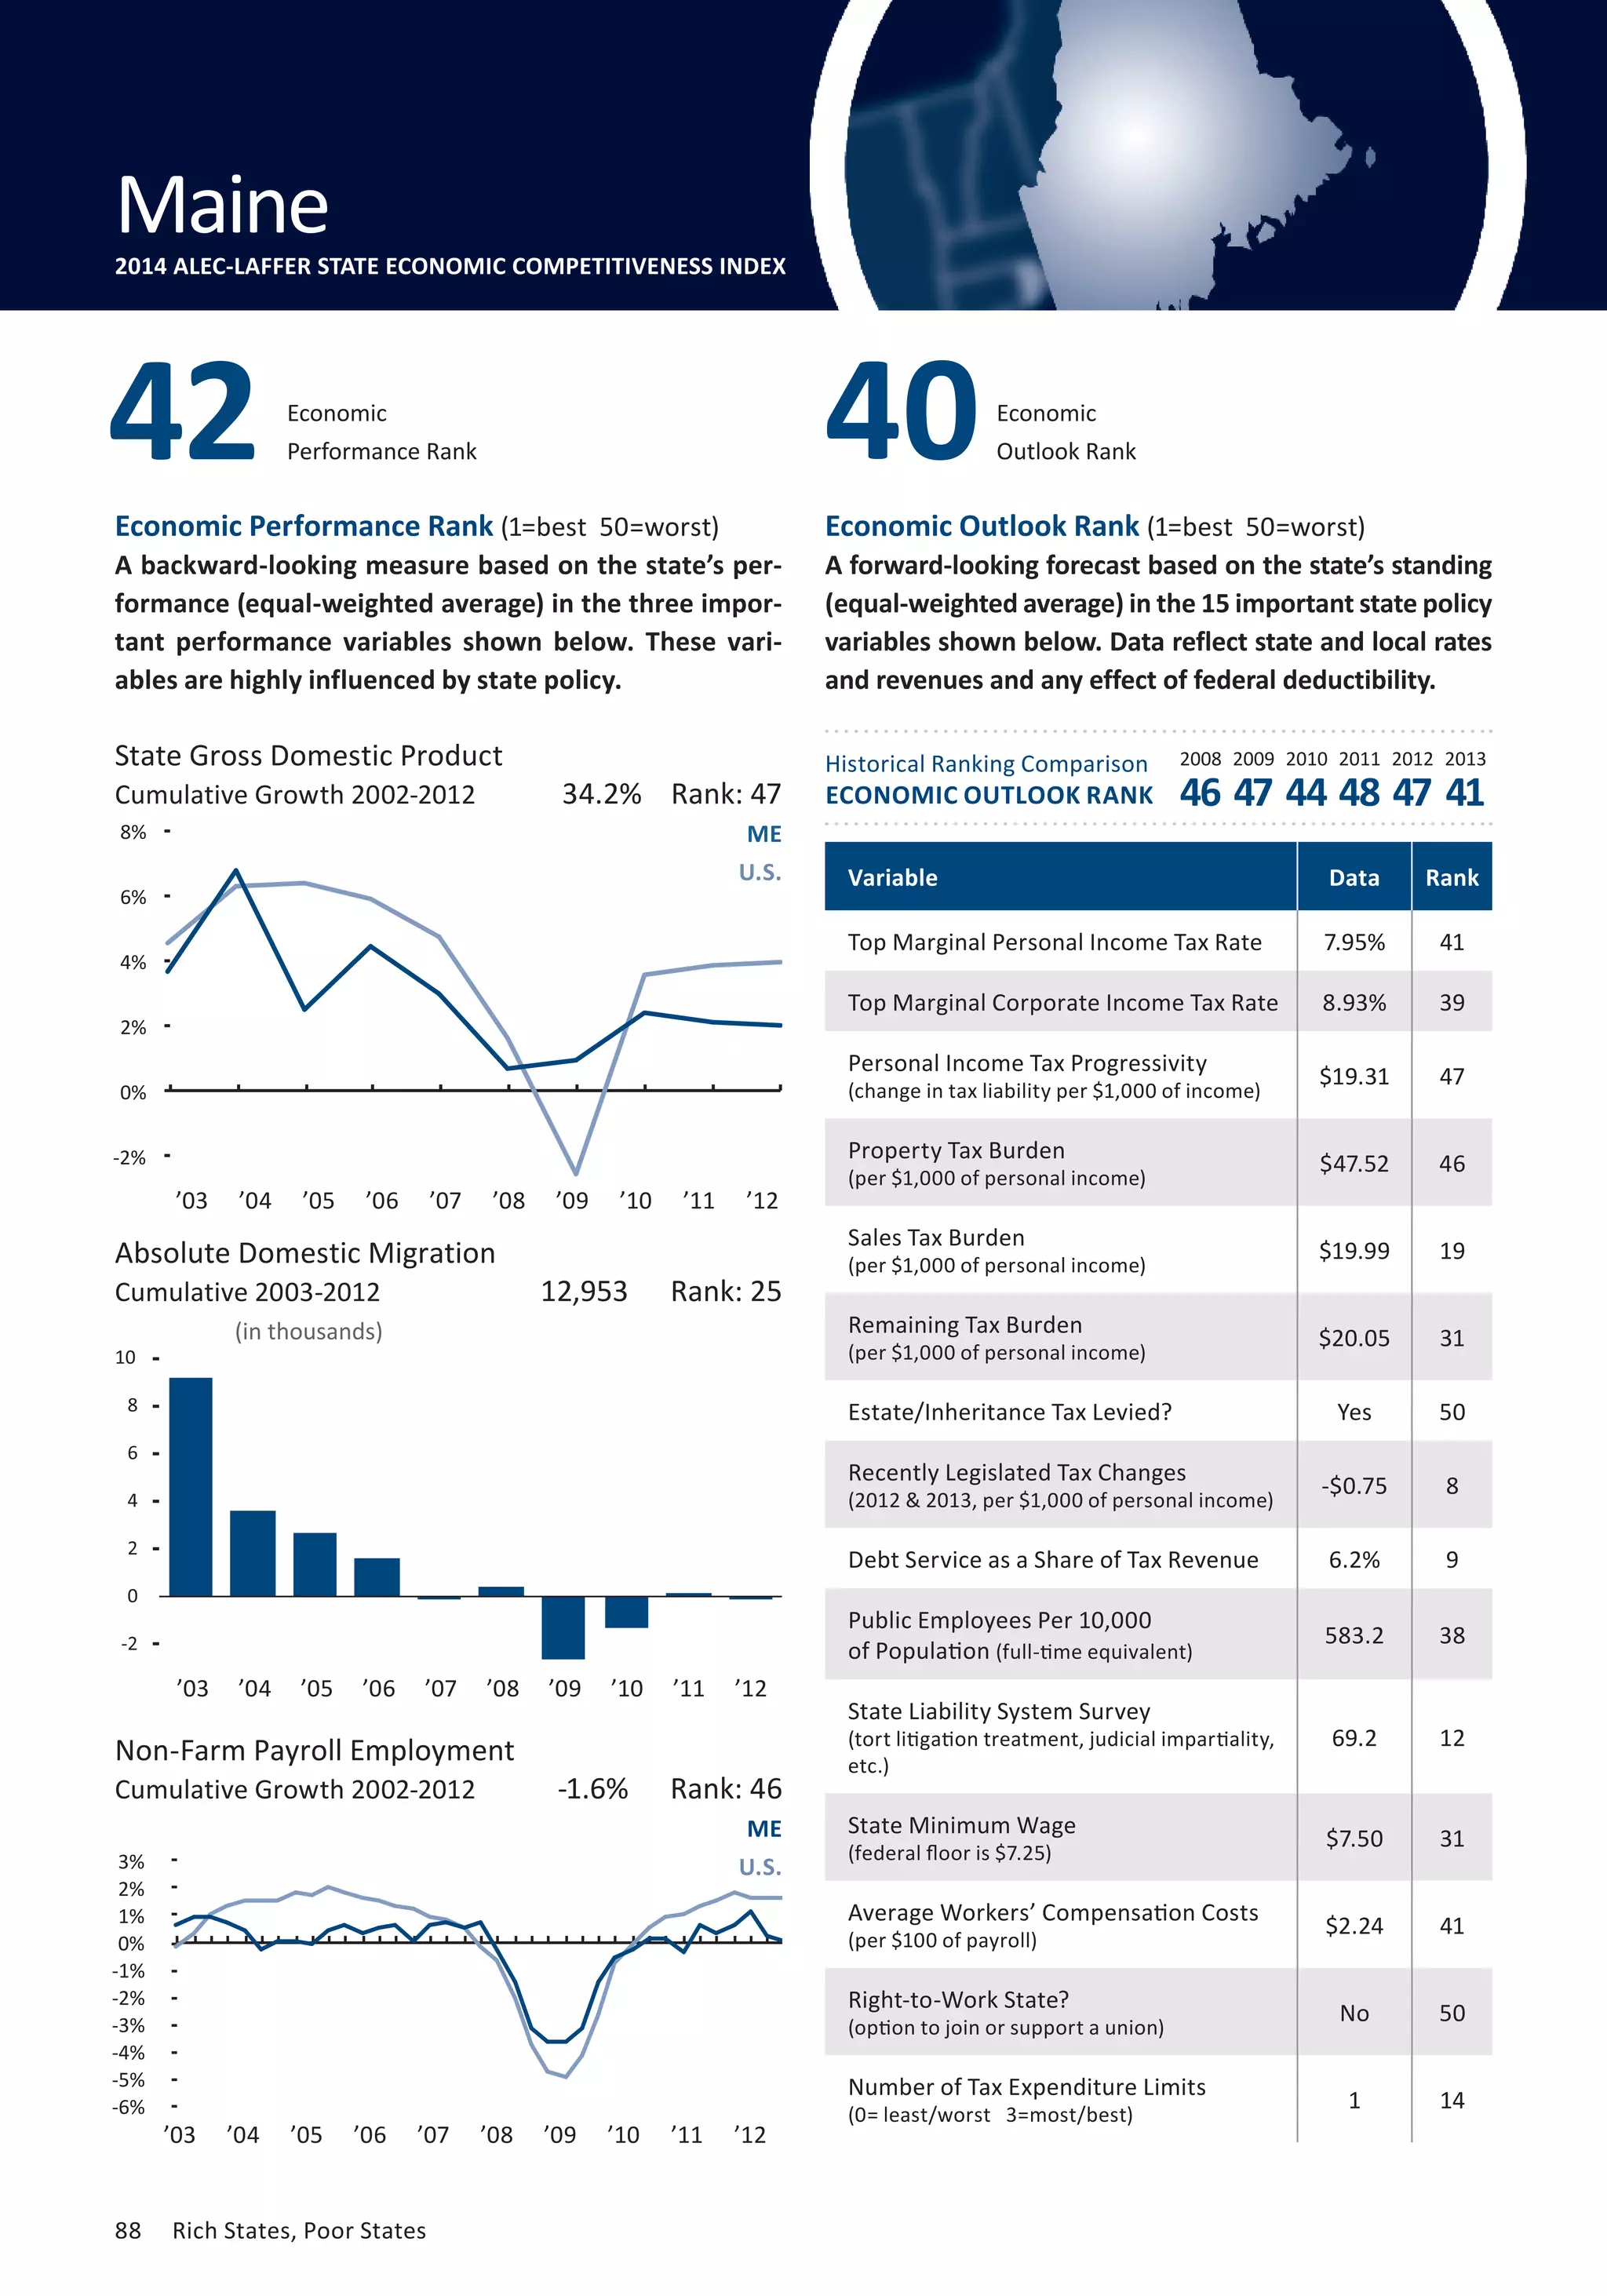
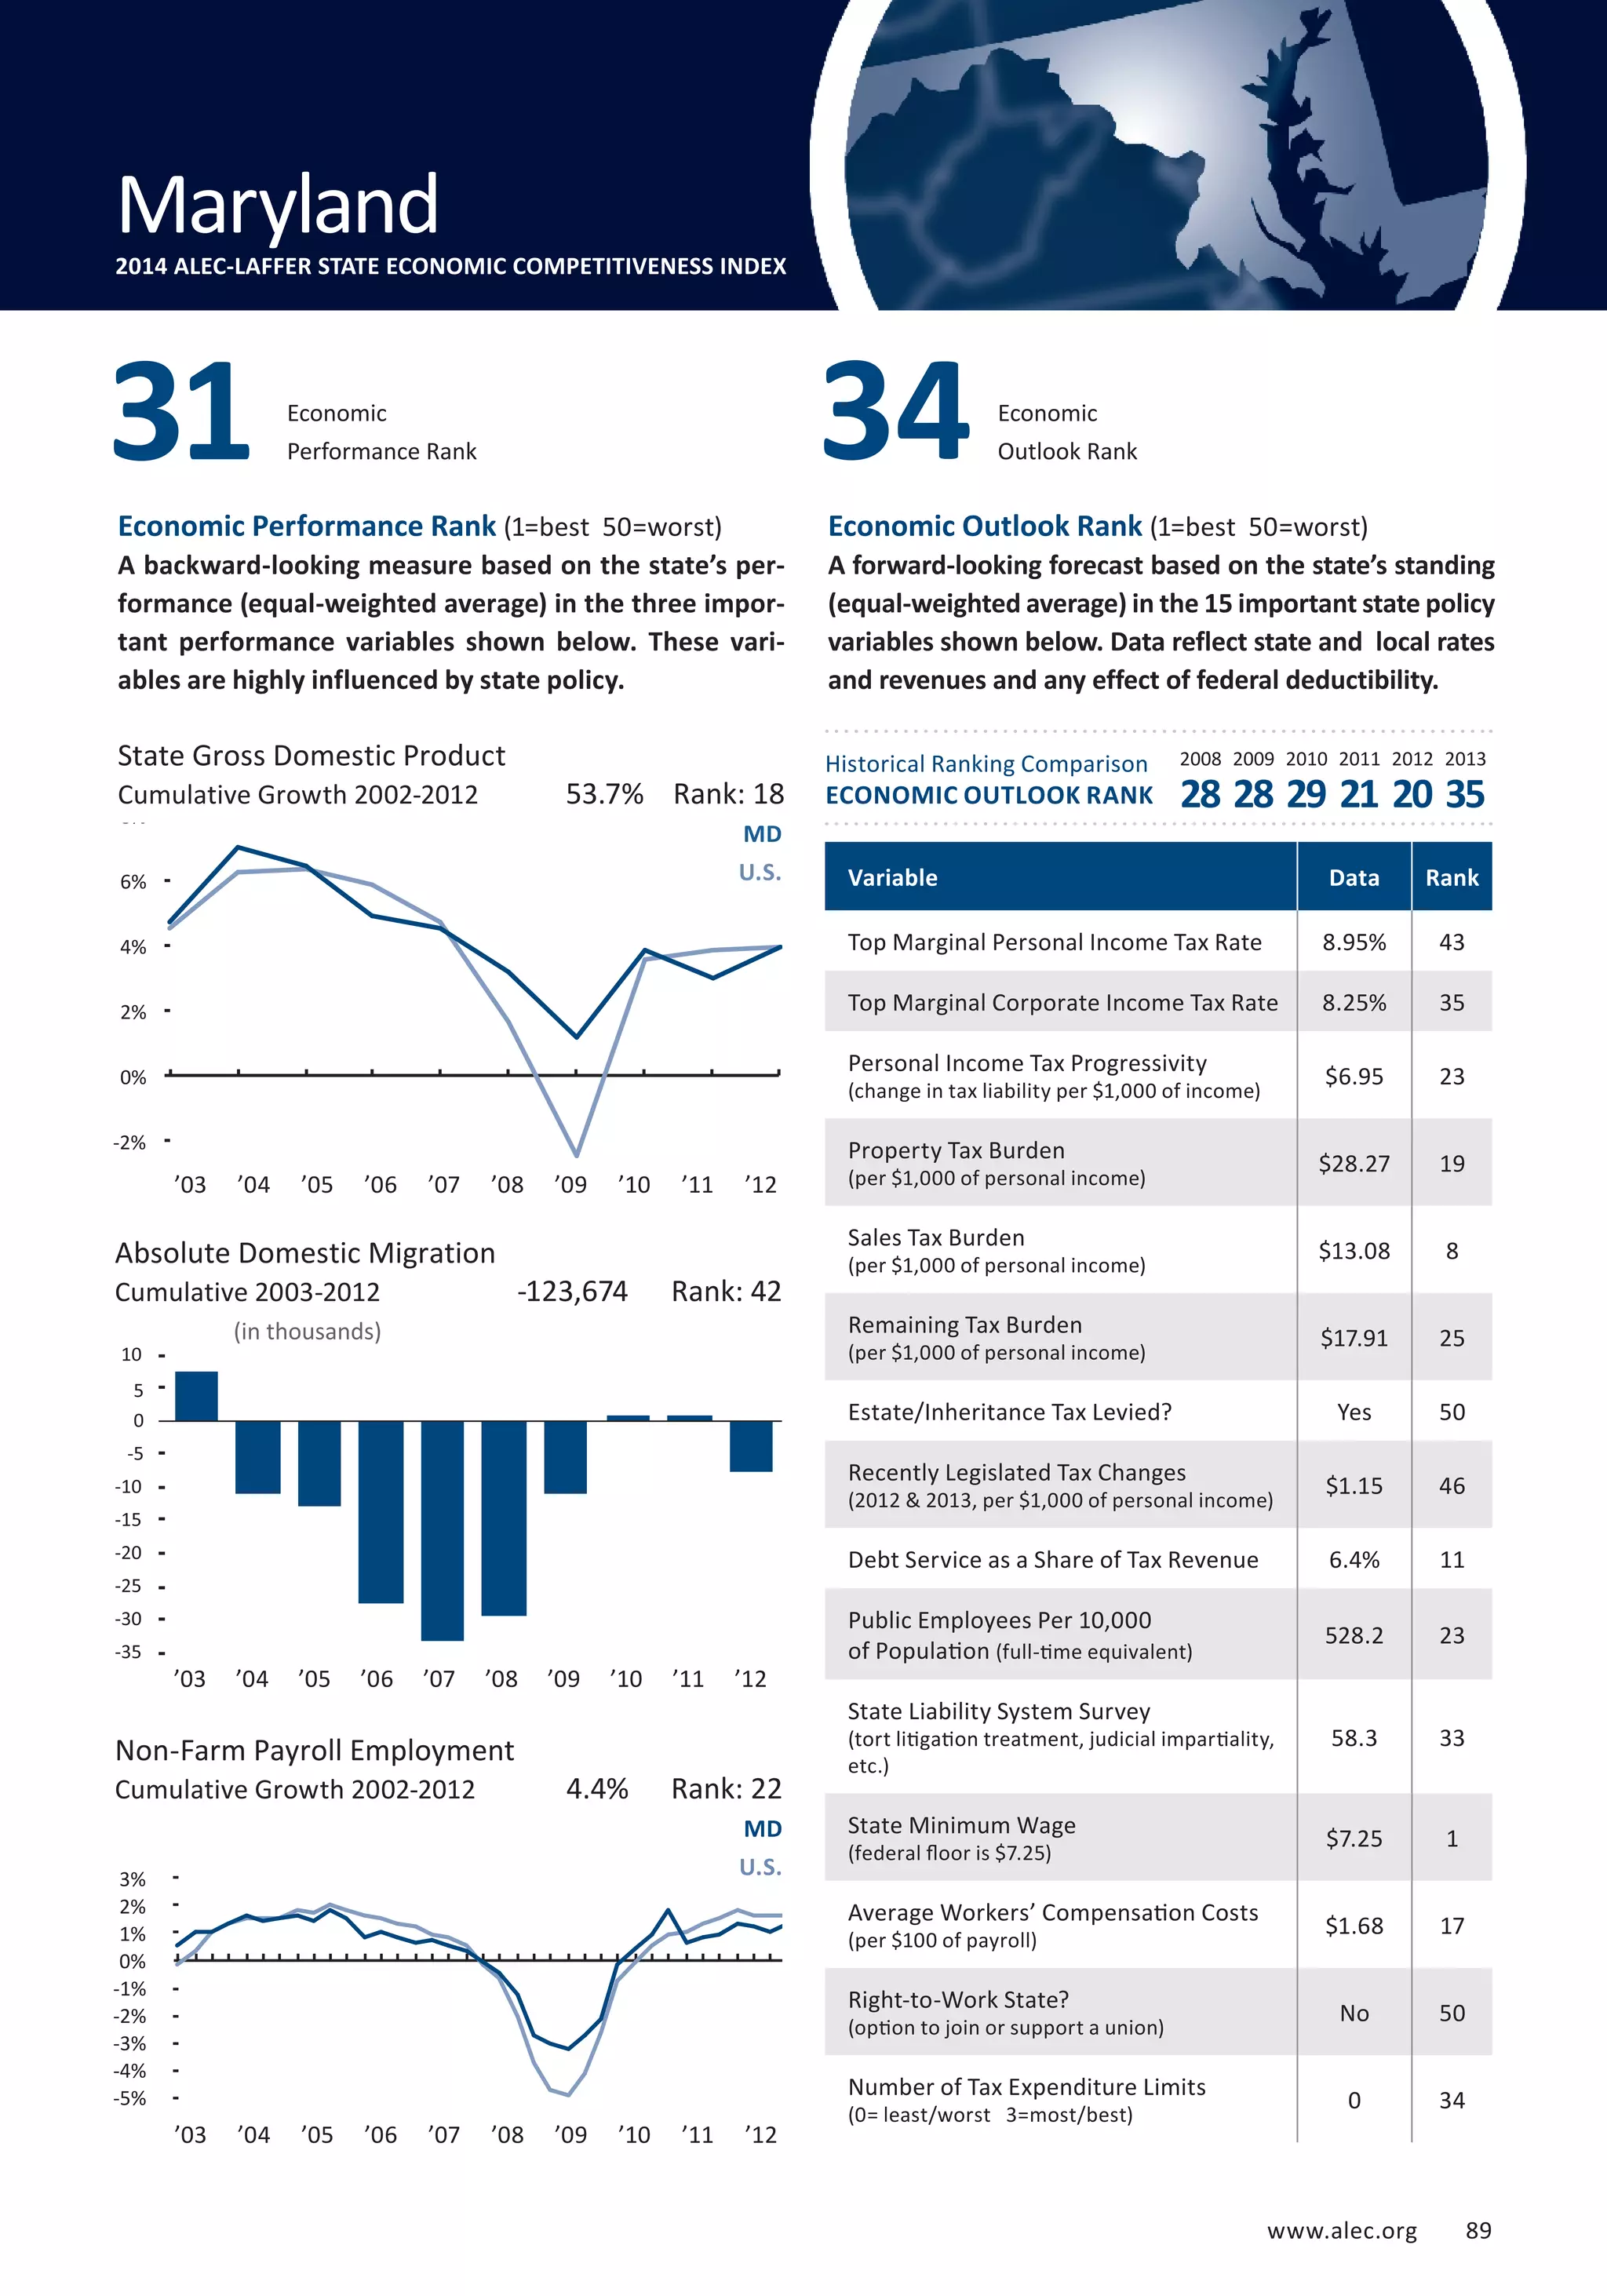
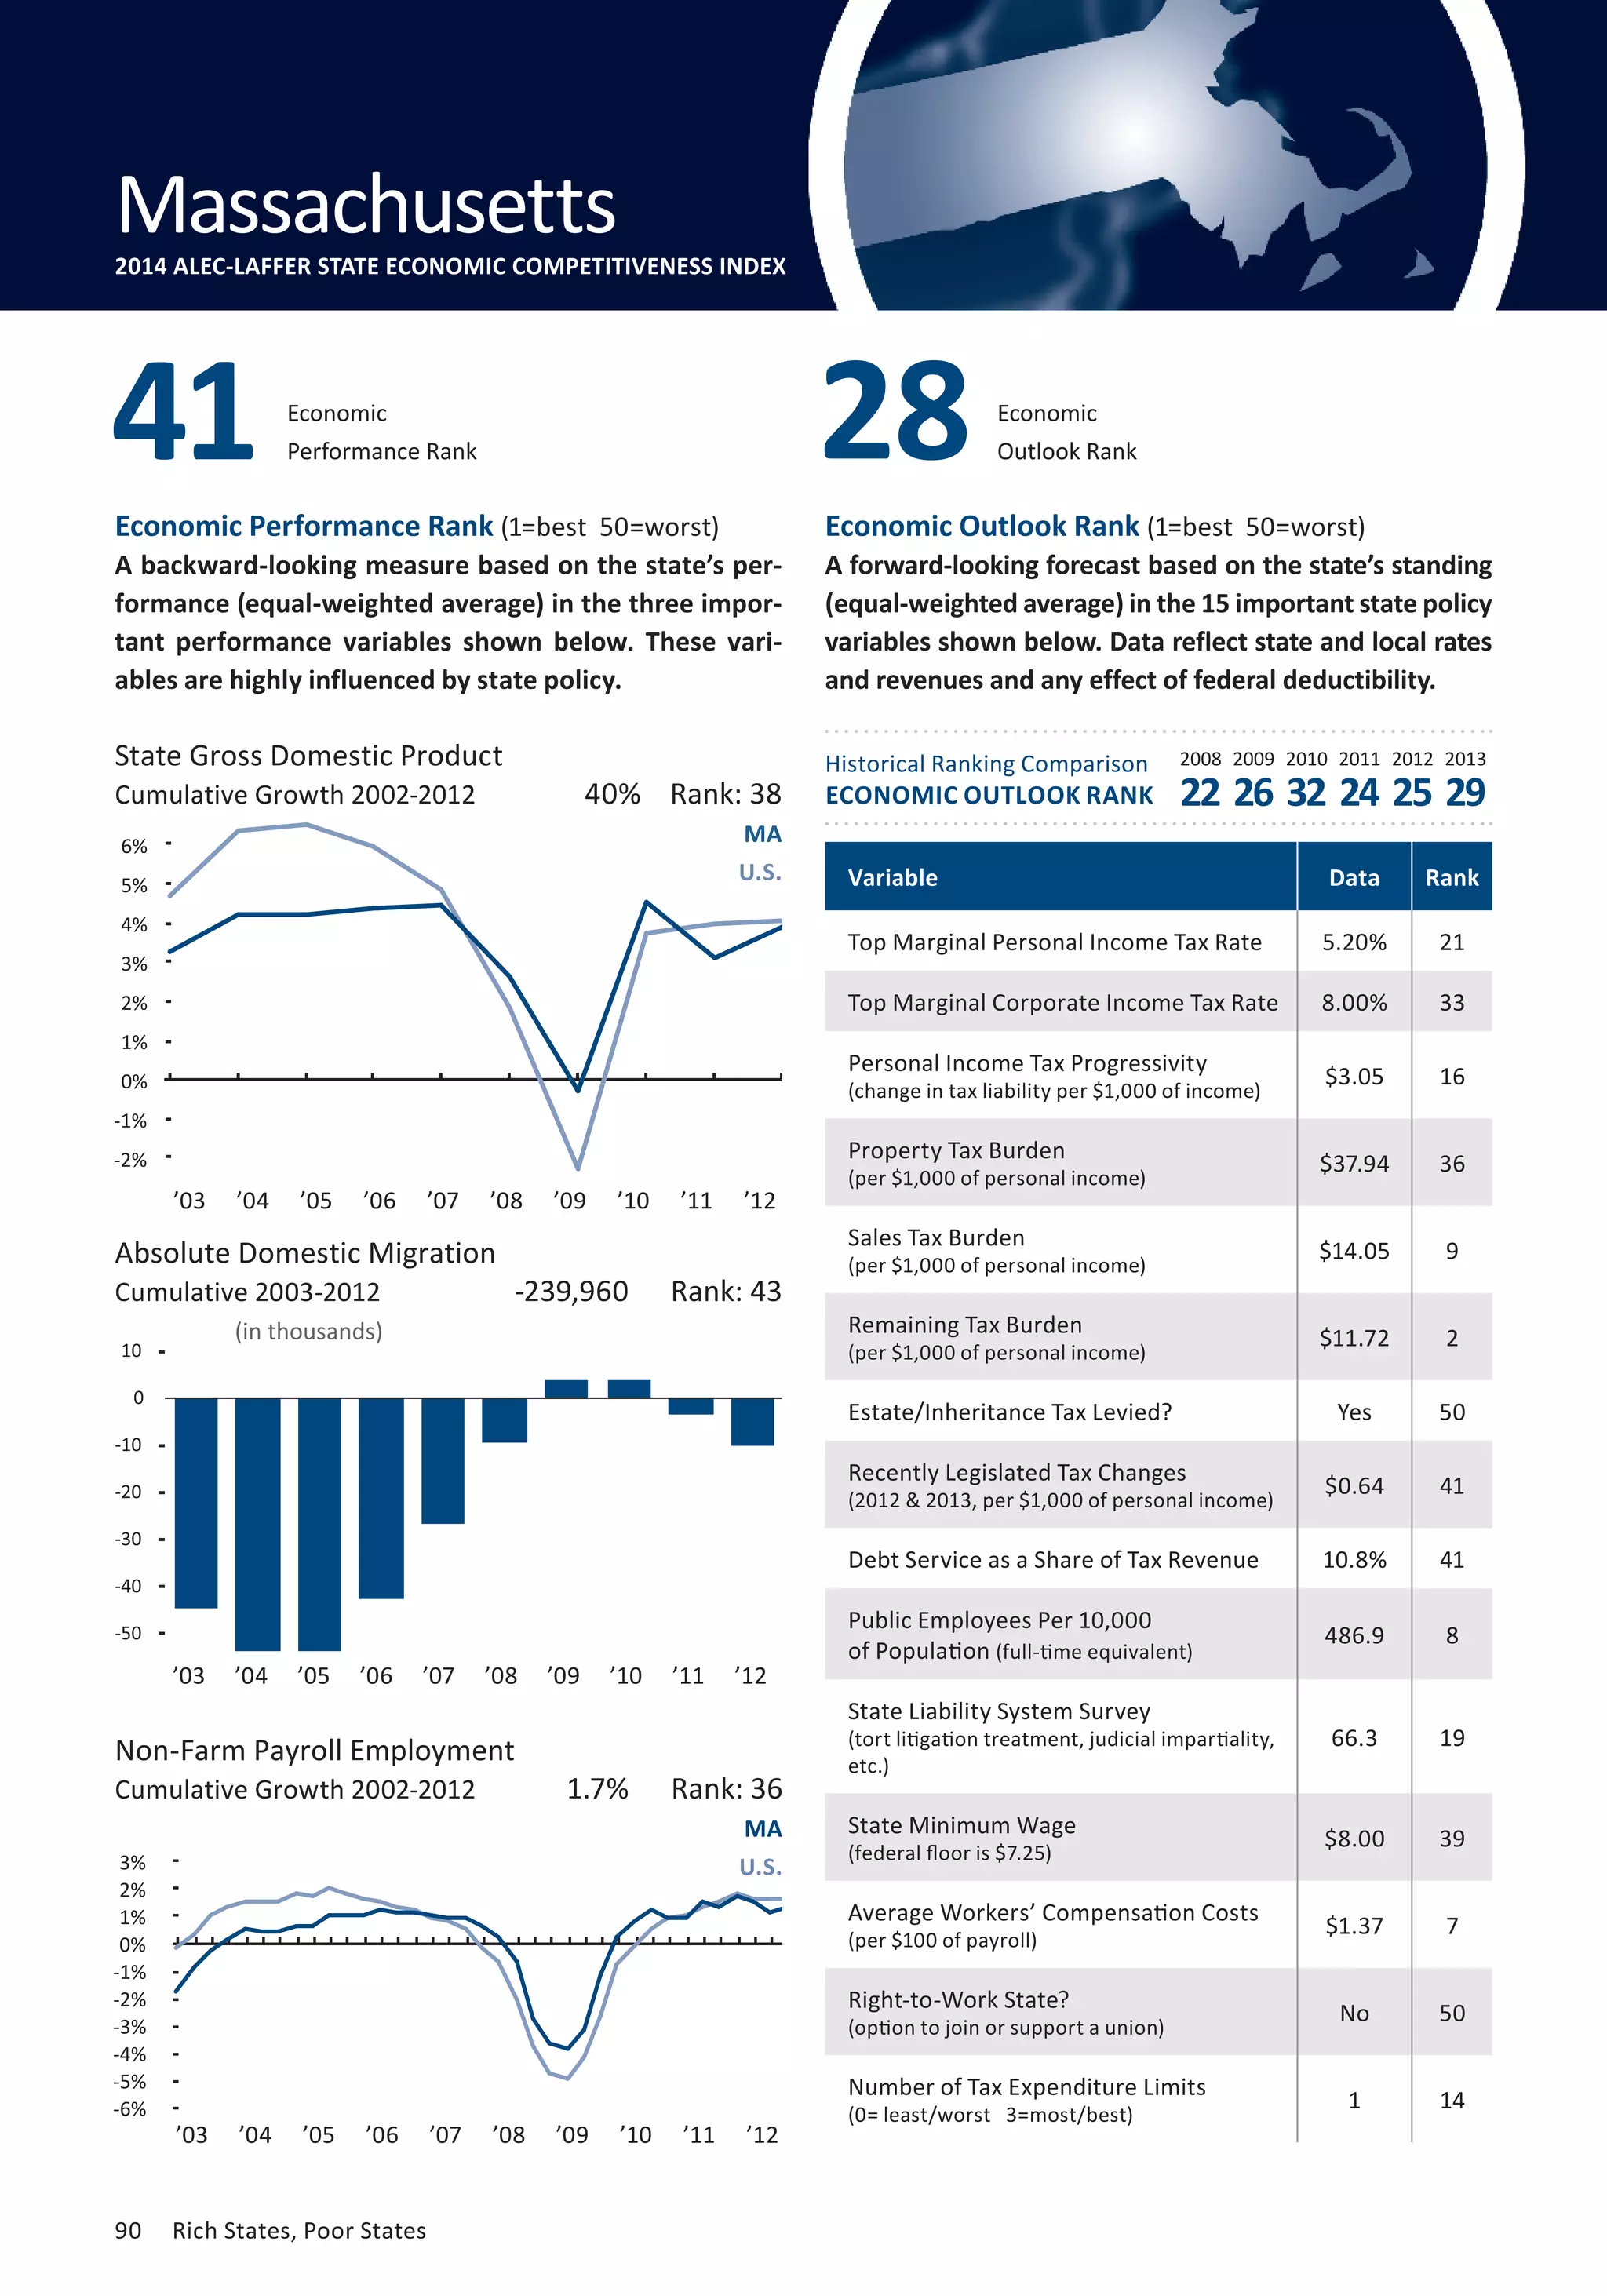
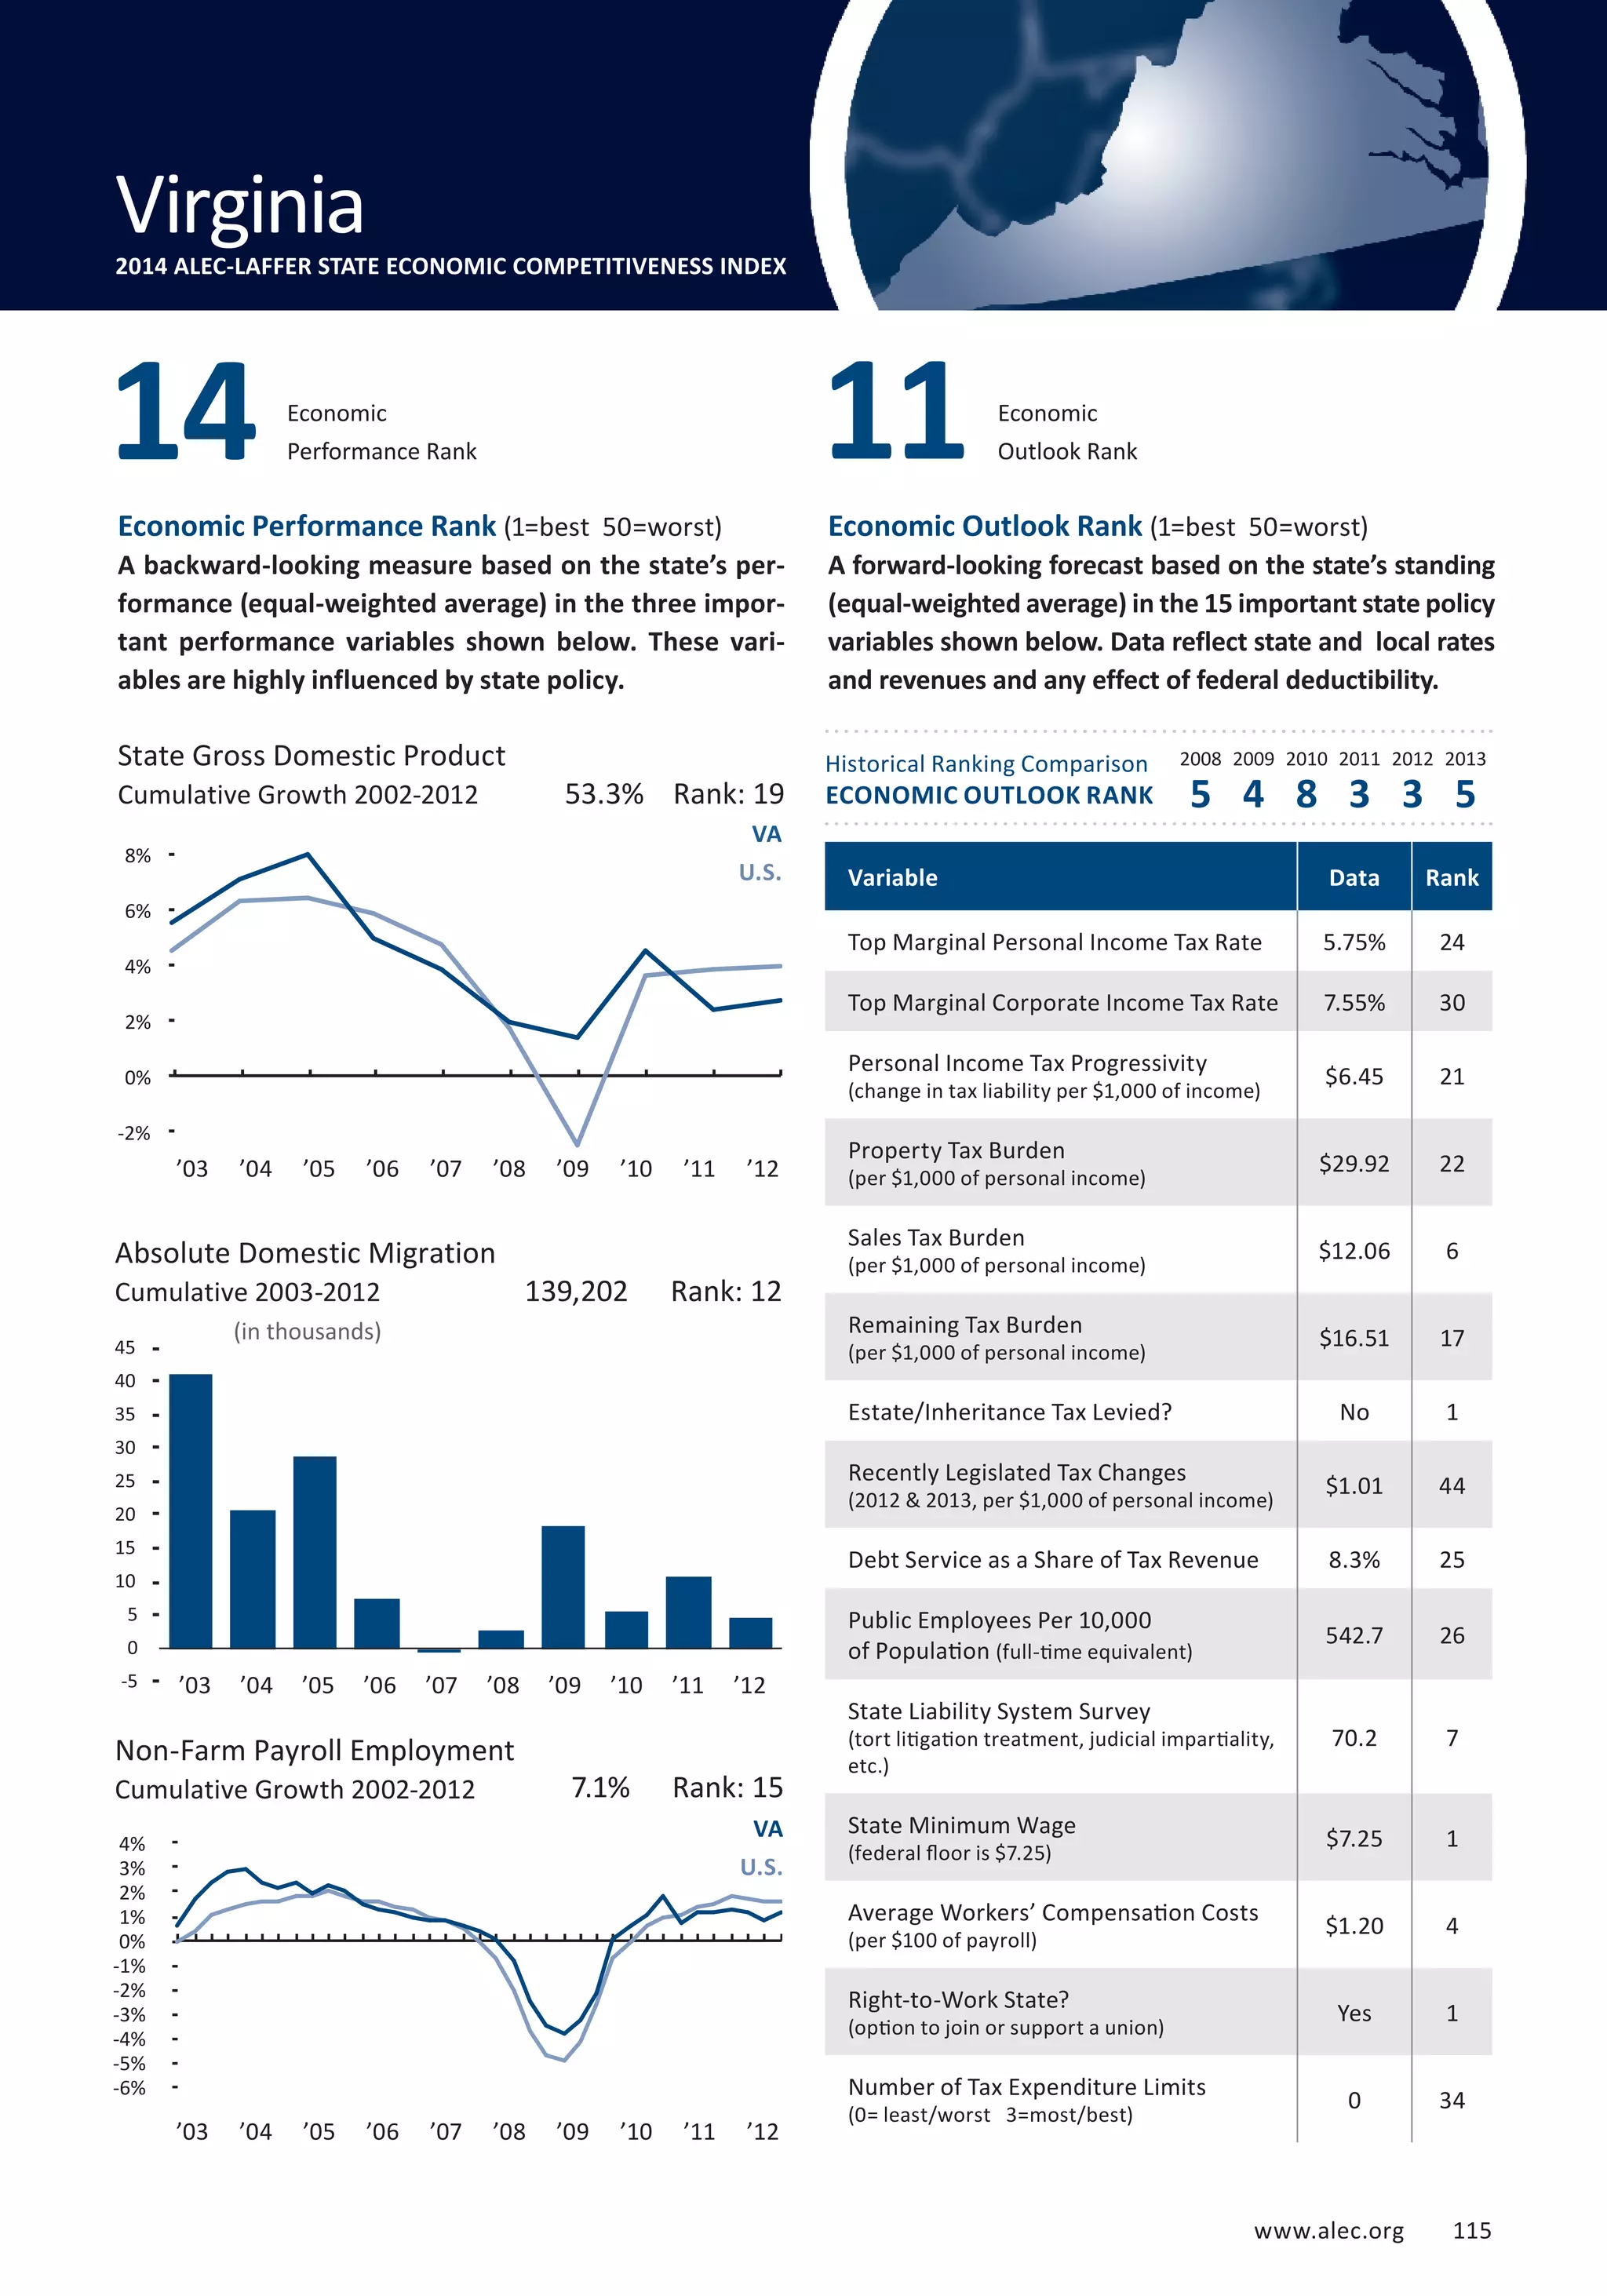
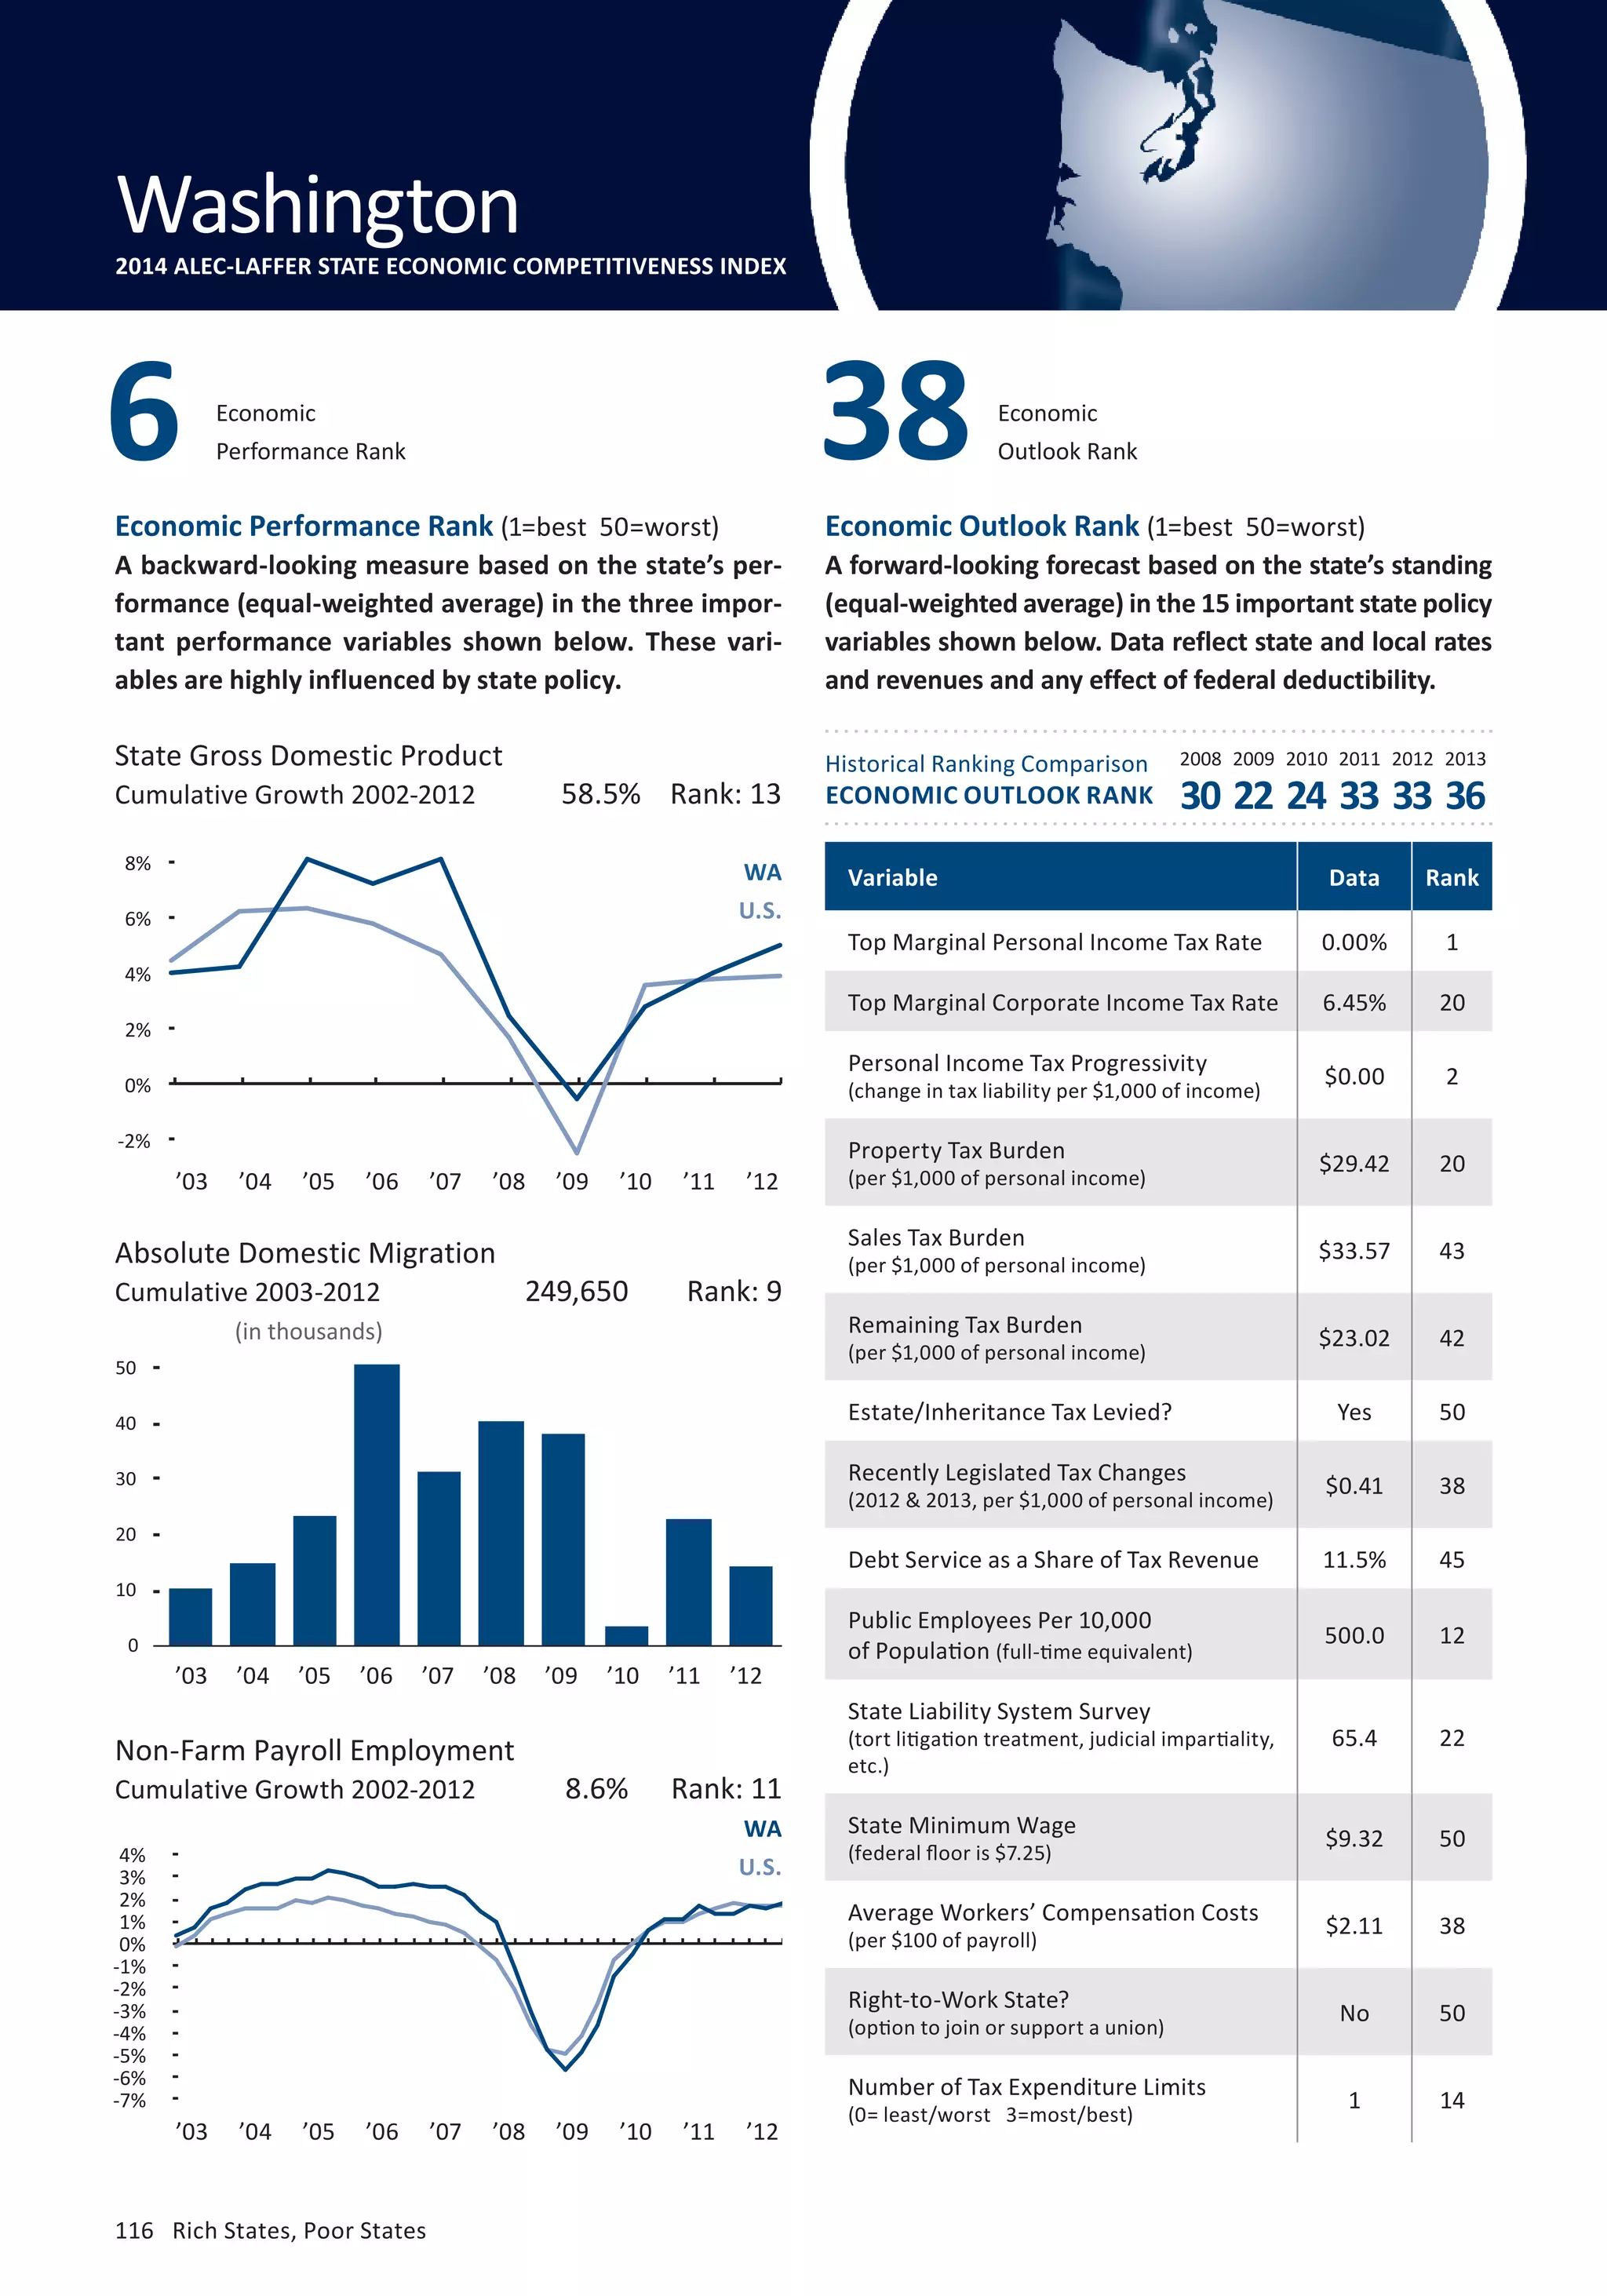
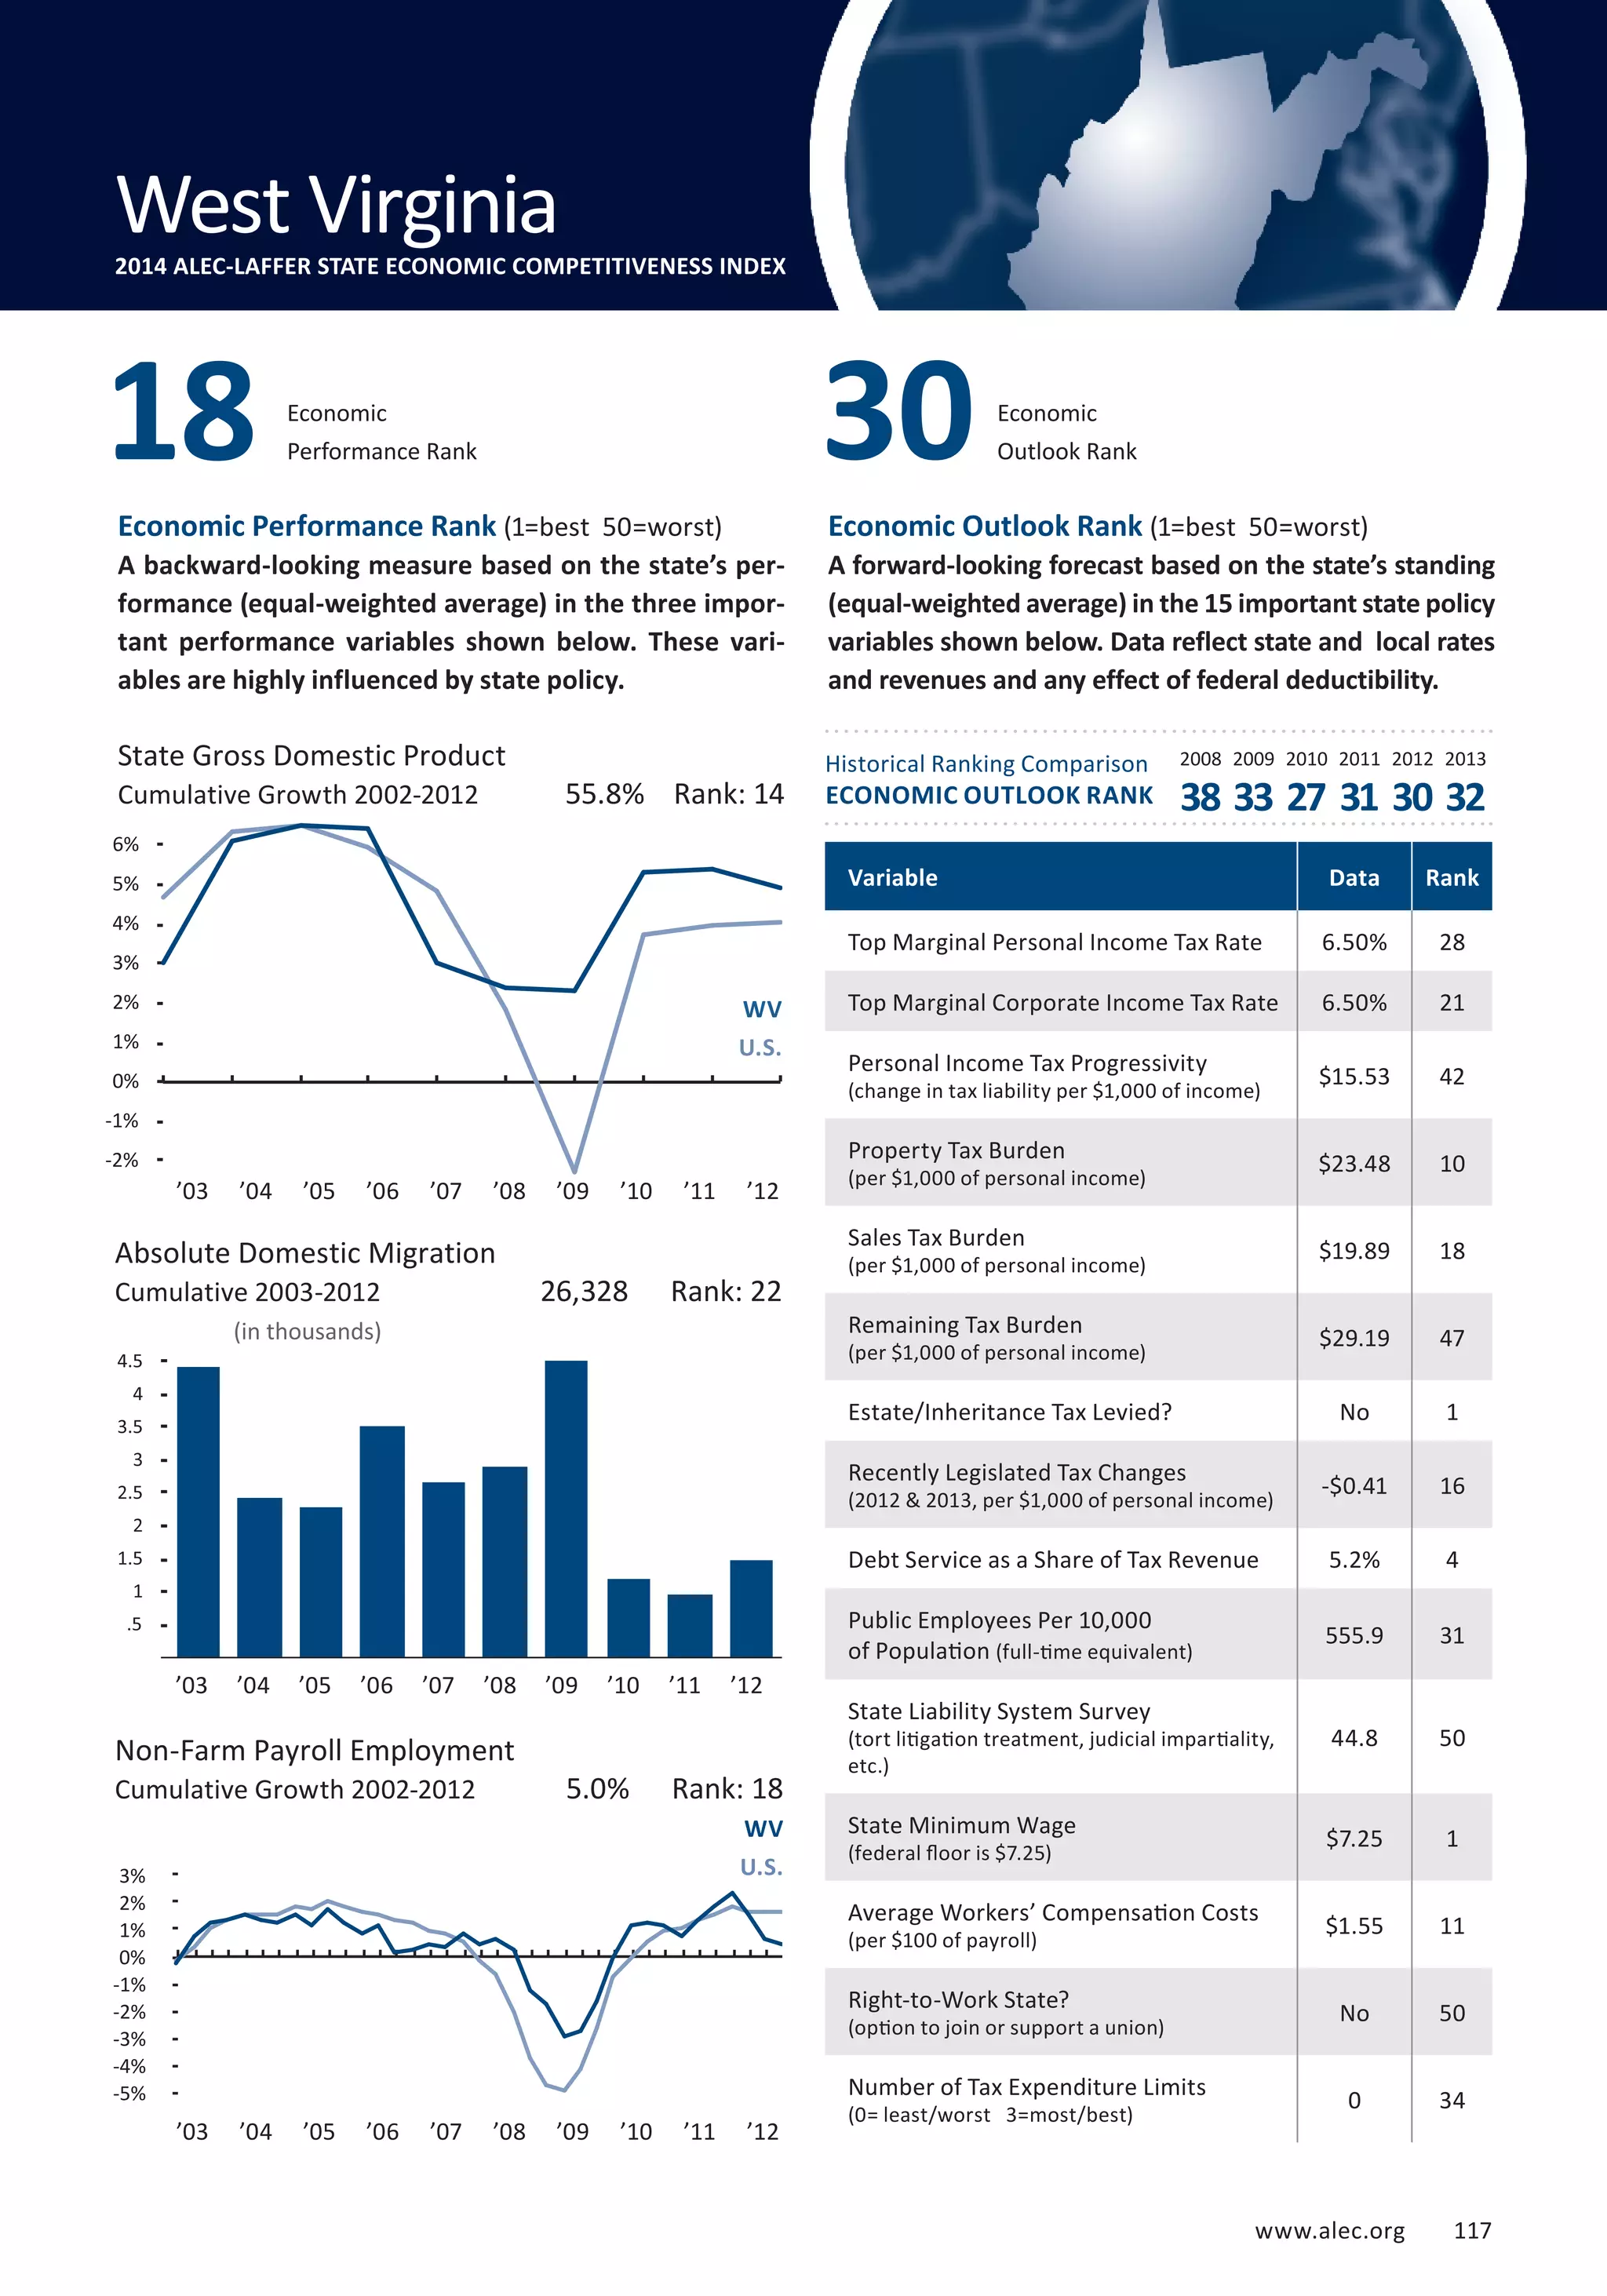
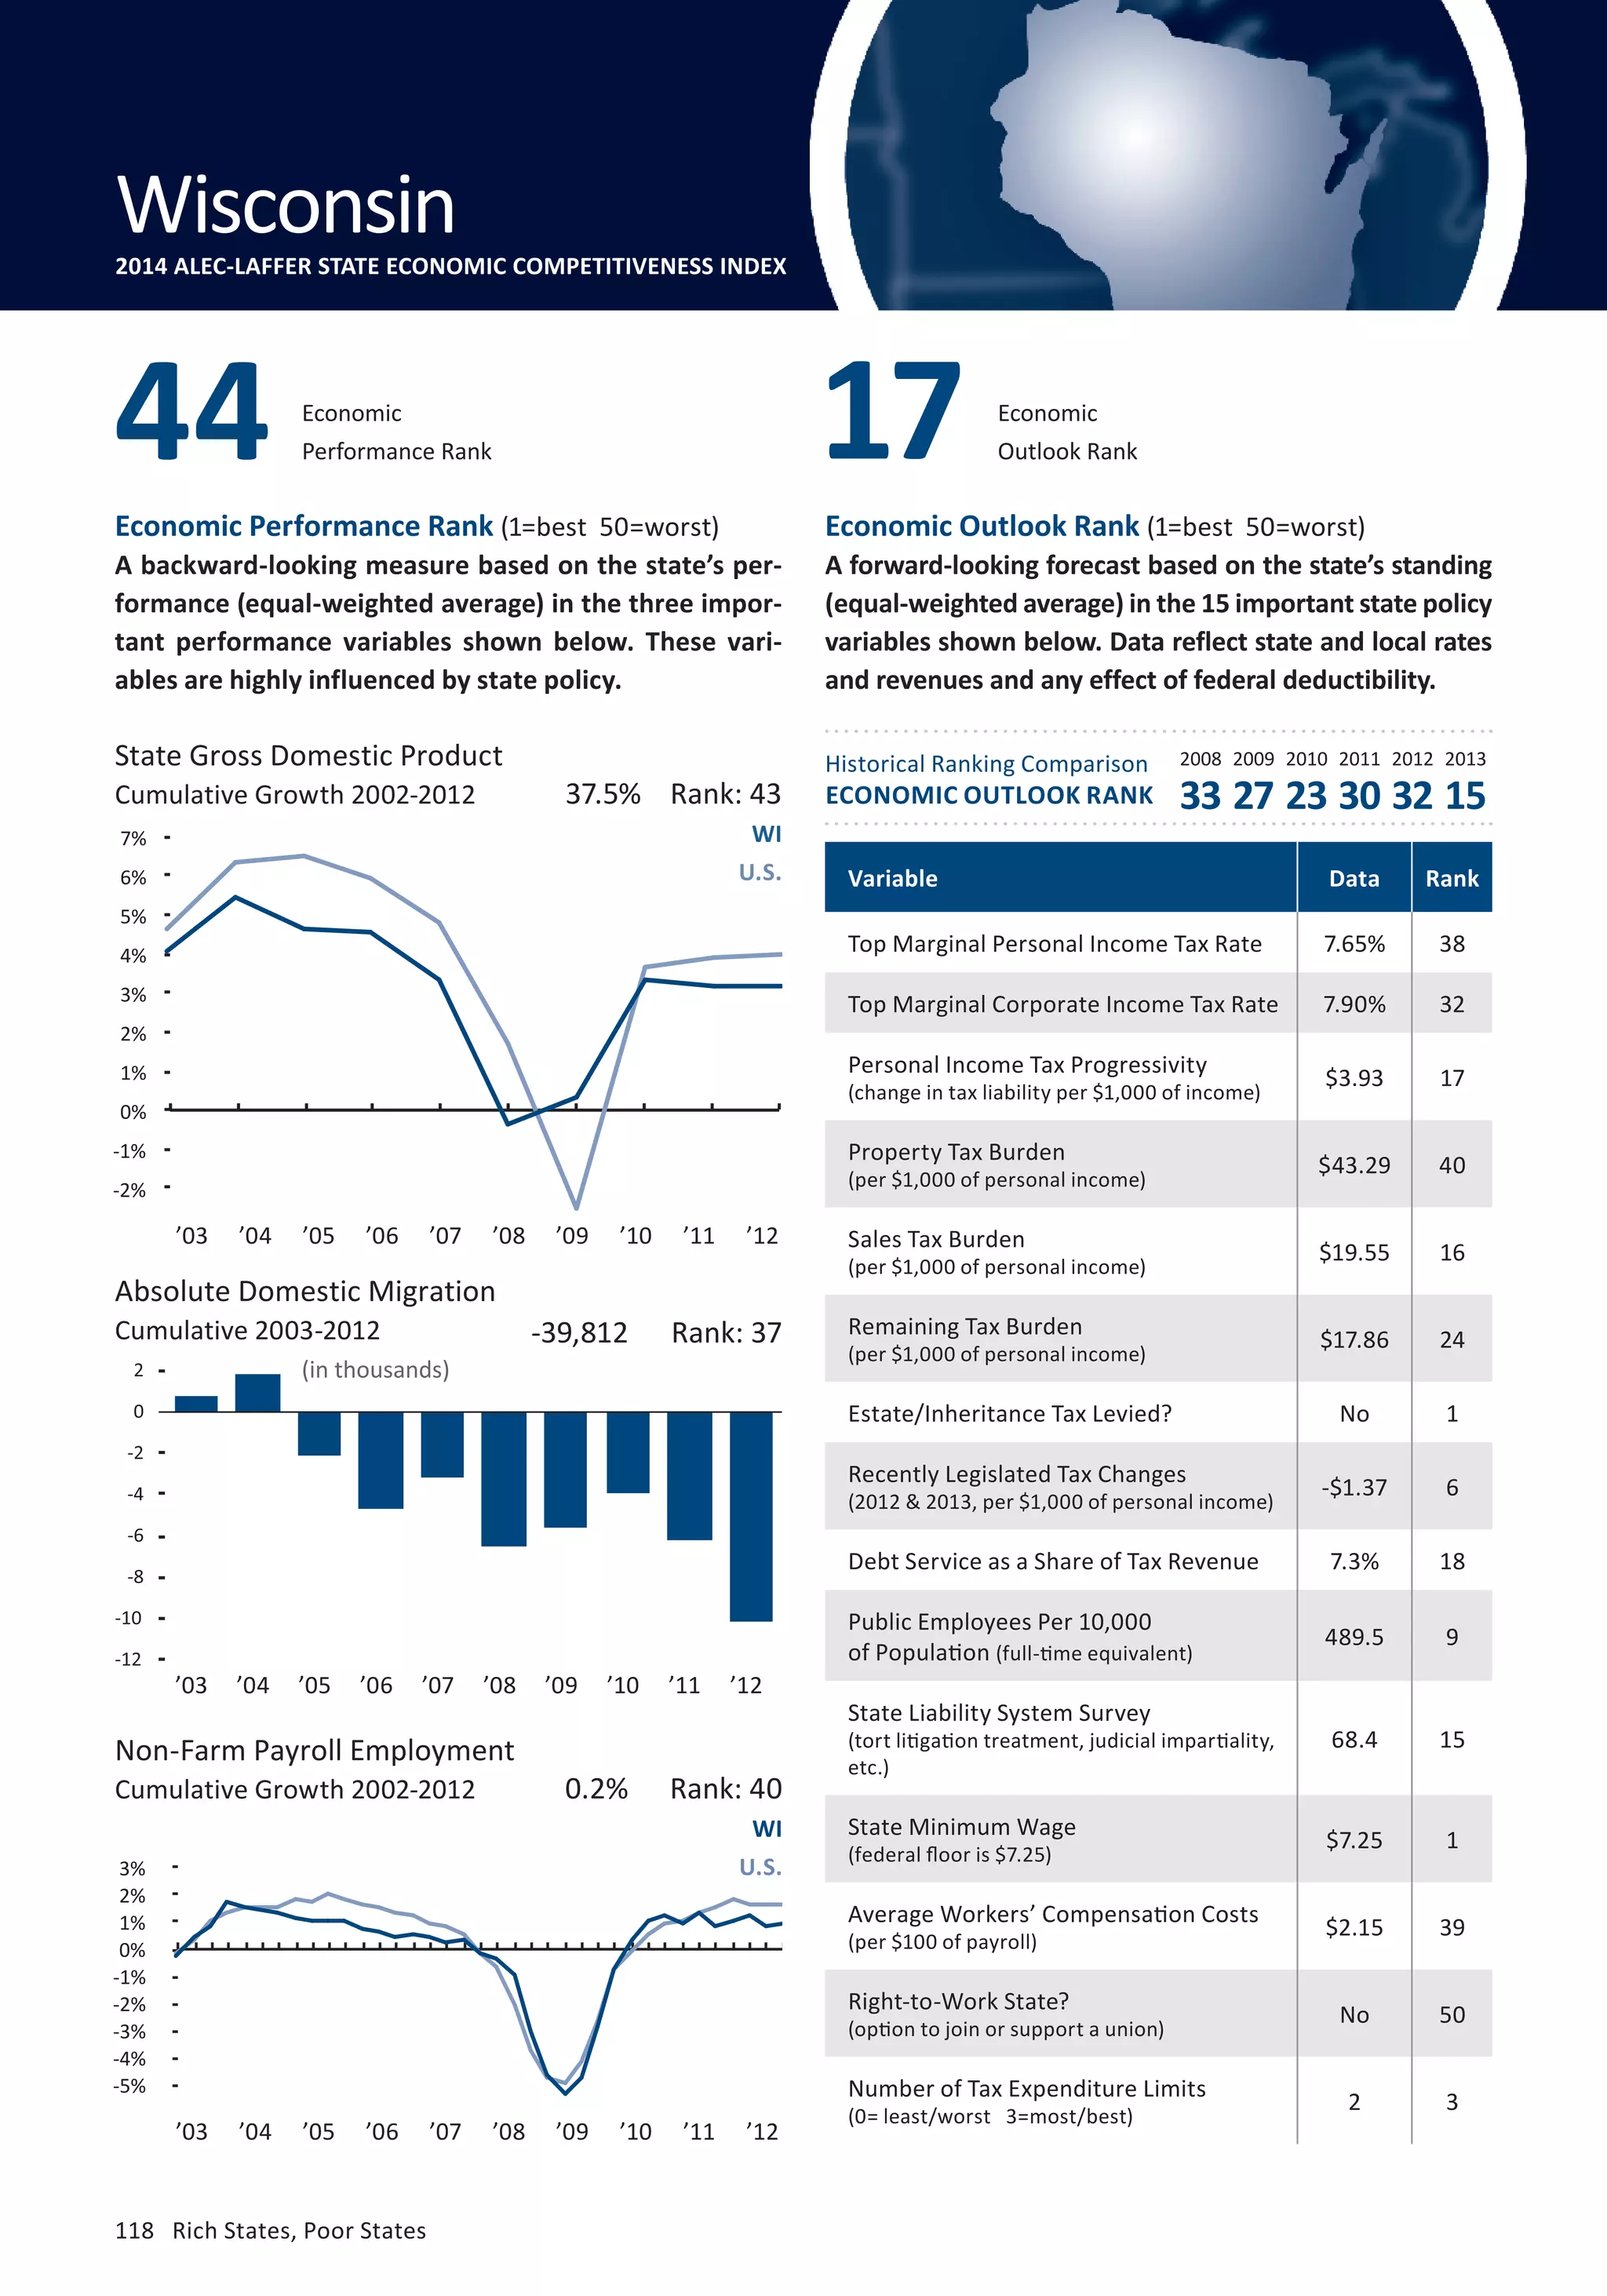


The 'Rich States, Poor States' report by the American Legislative Exchange Council presents the 2014 ALEC-Laffer State Economic Competitiveness Index, analyzing the impact of state tax and fiscal policies on economic growth across the U.S. It emphasizes that effective economic policies can significantly enhance prosperity, as demonstrated by data on migration, tax reforms, and performance metrics. The report aims to provide lawmakers insights into successful strategies while cautioning against the adverse effects of high taxation and inefficient spending.


