
Recommended
More Related Content
Similar to www.freetheworld.com • www.fraserinstitute.org • Fraser Instit.docx
Similar to www.freetheworld.com • www.fraserinstitute.org • Fraser Instit.docx (16)
More from ericbrooks84875
More from ericbrooks84875 (20)
Recently uploaded
Recently uploaded (20)
www.freetheworld.com • www.fraserinstitute.org • Fraser Instit.docx
- 1. www.freetheworld.com • www.fraserinstitute.org • Fraser Institute ©2013 Chapter 1 Economic Freedom of the World in 2011 It has now been a little more than a quarter of a century since Michael Walker and the Fraser Institute partnered with Milton and Rose Friedman on the Economic Freedom of the World (EFW) project. From the very beginning, the sole objective of this project was to clearly define and measure the consistency of institutions and policies with economic freedom for a large set of countries and territories. This single objective remains the focal point of this project. A lot has happened since the initial 1986 meeting. A comprehensive measure of economic freedom has been developed. The EFW index now covers 152 countries and territories1 and data are available for approximately 100 countries and territo- ries back to 1980. This data set makes it possible for scholars to analyze the impact of both cross-country differences in economic freedom and changes in that freedom across a three-decade time frame. Moreover, there is far greater awareness of the importance of institutions and policies today than was true when the project was initiated.
- 2. During the past two decades, there has been a virtual explosion of scholarly research examining the impact of economic, political, and legal institutions on the performance of econ- omies. Much of this research has used the Economic Freedom of the World mea- sure (see Hall and Lawson, 2013). From the beginning, the researchers involved in the EFW project recognized that more accurate measurement of the institu- tional and policy environment would enhance our understanding of economic growth and development. Thus, we are delighted to see the index so widely used in this manner. The concept of economic freedom The cornerstones of economic freedom are (1) personal choice, (2) voluntary ex- change co ordinated by markets, (3) freedom to enter and compete in markets, and (4) protection of persons and their property from aggression by others. Economic freedom is present when individuals are permitted to choose for themselves and engage in voluntary transactions as long as they do not harm the person or property of others. While individuals have a right to their own time, talents, and resources, they do not have a right to those of others. Thus, individuals do not have a right to take things from others or demand that others provide things for them. The use of 1 Historical data are provided for 153 nations in Chapter 2:
- 3. Country Data Tables. However, due to events in Syria, data for 2011 are questionable and, therefore, have not been shown in the tables. For the same reason, Syria is not included this year among the 152 countries ranked in the index. 2 • Economic Freedom of the World: 2013 Annual Report Fraser Institute ©2013 • www.fraserinstitute.org • www.freetheworld.com violence, theft, fraud, and physical invasions are not permissible in an economically free society, but otherwise, individuals are free to choose, trade, and cooperate with others, and compete as they see fit. To a large degree, the EFW measure is an effort to identify how closely the insti- tutions and policies of a country correspond with the ideal of a limited government, where the government protects property rights and arranges for the provision of a limited set of “public goods” such as national defense and access to money of sound value, but little beyond these core functions. In order to receive a high EFW rating, a country must provide secure protection of privately owned property, even-handed enforcement of contracts, and a stable monetary environment. It also must keep taxes low, refrain from creating barriers to both domestic and international trade, and rely more fully on markets rather than government spending
- 4. and regulation to allocate goods and resources. In many ways, a country’s EFW summary rating is a measure of how closely its institutions and policies compare with the idealized structure implied by standard textbook analysis of microeconomics. The EFW measure and scholarly research Robert Lucas, the 1995 Nobel laureate, has stated, “Once you start thinking about economic growth, it is hard to think about anything else”. Lucas is correct. Moreover, this is an exciting time to examine the underlying factors of the growth process. The opportunity for widespread constructive institutional change is perhaps greater than at any time in history. A comprehensive and accurate measure of the degree to which countries rely on market institutions is central to ongoing scholarly research to disentangle the importance of economic and political institutions, as well as cli- matic, locational, cultural, and historical factors that affect economic performance. Scholarly research has already provided strong evidence that freer economies have higher levels of private investment, grow more rapidly, and achieve both higher income levels and lower rates of poverty. But numerous unanswered questions remain. Does democracy reinforce economic freedom or, perhaps with the passage of time, lead to debt, dependency, and special-interest politics that undermine it? What political
- 5. institutions are most consistent with economic freedom, growth, and prosperity? Is economic freedom good or bad for the environment? How important are cultural and historical factors as sources of growth and development? These questions are impor- tant and complex. It is both our belief and expectation that the Economic Freedom of the World measure will help scholars examine them more thoroughly in the future. The Economic Freedom of the World index for 2011 The construction of the index published in Economic Freedom of the World is based on three important methodological principles. First, objective components are always preferred to those that involve surveys or value judgments. Given the multi-dimen- sional nature of economic freedom and the importance of legal and regulatory ele- ments, it is sometimes necessary to use data based on surveys, expert panels, and generic case studies. To the fullest extent possible, however, the index uses objective components. Second, the data used to construct the index ratings are from external sources such as the International Monetary Fund, World Bank, and World Economic Forum that provide data for a large number of countries. Data provided directly from a source within a country are rarely used, and only when the data are unavailable from
- 6. Chapter 1: Economic Freedom of the World in 2011 • 3 www.freetheworld.com • www.fraserinstitute.org • Fraser Institute ©2013 international sources. Importantly, the value judgments of the authors or others in the Economic Freedom Network are never used to alter the raw data or the rating of any country. Third, transparency is present throughout. The report provides informa- tion about the data sources, the methodology used to transform raw data into compo- nent ratings, and how the component ratings are used to construct both the area and summary ratings. Complete methodological details can be found in the Appendix: Explanatory Notes and Data Sources of this report. The entire data set used in the construction of the index is freely available to researchers at <www.freetheworld.com>. Structure of the EFW index Exhibit 1.1 indicates the structure of the EFW index. The index measures the degree of economic freedom present in five major areas: [1] Size of Government; [2] Legal System and Property Rights; [3] Sound Money; [4] Freedom to Trade Internationally; [5] Regulation. Within the five major areas, there are 24 components in this year’s index. Many of those components are themselves made up of several sub- components. In total, the index comprises 42 distinct variables. Each component and
- 7. sub-component is placed on a scale from 0 to 10 that reflects the distribution of the underlying data. When sub-components are present, the sub-component ratings are averaged to derive the component rating. The component ratings within each area are then averaged to derive ratings for each of the five areas. In turn, the five area ratings are averaged to derive the summary rating for each country. The following section pro- vides an overview of the five major areas. 1 Size of Government The four components of Area 1 indicate the extent to which countries rely on the political process to allocate resources and goods and services. When government spending increases relative to spending by individuals, households, and businesses, government decision-making is substituted for personal choice and economic free- dom is reduced. The first two components address this issue. Government con- sumption as a share of total consumption (1A) and transfers and subsidies as a share of GDP (1B) are indicators of the size of government. When government consump- tion is a larger share of the total, political choice is substituted for personal choice. Similarly, when governments tax some people in order to provide transfers to others, they reduce the freedom of individuals to keep what they earn. The third component (1C) in this area measures the extent to which countries
- 8. use private investment and enterprises rather than government investment and firms to direct resources. Governments and state-owned enterprises play by rules that are different from those to which private enterprises are subject. They are not dependent on consumers for their revenue or on investors for capital. They often operate in protected markets. Thus, economic freedom is reduced as government enterprises produce a larger share of total output. The fourth component (1D) is based on (1Di) the top marginal income tax rate and (1Dii) the top marginal income and payroll tax rate and the income threshold at which these rates begin to apply. These two sub-components are averaged to cal- culate the top marginal tax rate (1D). High marginal tax rates that apply at relatively low income levels are also indicative of reliance upon government. Such rates deny individuals the fruits of their labor. Thus, countries with high marginal tax rates and low income thresholds are rated lower. 4 • Economic Freedom of the World: 2013 Annual Report Fraser Institute ©2013 • www.fraserinstitute.org • www.freetheworld.com Exhibit 1.1: Areas, Components, and Sub-components of the EFW Index
- 9. 1. Size of Government A. Government consumption B. Transfers and subsidies C. Government enterprises and investment D. Top marginal tax rate (i) Top marginal income tax rate (ii) Top marginal income and payroll tax rate 2. Legal System and Property Rights A. Judicial independence B. Impartial courts C. Protection of property rights D. Military interference in rule of law and politics E. Integrity of the legal system F. Legal enforcement of contracts G. Regulatory restrictions on the sale of real property H. Reliability of police I. Business costs of crime 3. Sound Money
- 10. A. Money growth B. Standard deviation of inflation C. Inflation: most recent year D. Freedom to own foreign currency bank accounts 4. Freedom to Trade Internationally A. Tariffs (i) Revenue from trade taxes (% of trade sector) (ii) Mean tariff rate (iii) Standard deviation of tariff rates B. Regulatory trade barriers (i) Non-tariff trade barriers (ii) Compliance costs of importing and exporting C. Black-market exchange rates D. Controls of the movement of capital and people (i) Foreign ownership/investment restrictions (ii) Capital controls (iii) Freedom of foreigners to visit 5. Regulation
- 11. A. Credit market regulations (i) Ownership of banks (ii) Private sector credit (iii) Interest rate controls/negative real interest rates B. Labor market regulations (i) Hiring regulations and minimum wage (ii) Hiring and firing regulations (iii) Centralized collective bargaining (iv) Hours regulations (v) Mandated cost of worker dismissal (vi) Conscription C. Business regulations (i) Administrative requirements (ii) Bureaucracy costs (iii) Starting a business (iv) Extra payments/bribes/favoritism (v) Licensing restrictions (vi) Cost of tax compliance
- 12. Chapter 1: Economic Freedom of the World in 2011 • 5 www.freetheworld.com • www.fraserinstitute.org • Fraser Institute ©2013 Taken together, the four components of Area 1 measure the degree to which a country relies on personal choice and markets rather than government budgets and political decision-making. Therefore, countries with low levels of government spending as a share of the total, a smaller government enterprise sector, and lower marginal tax rates earn the highest ratings in this area. 2 Legal System and Property Rights Protection of persons and their rightfully acquired property is a central element of economic freedom and a civil society. Indeed, it is the most important function of government. Area 2 focuses on this issue. The key ingredients of a legal system consistent with economic freedom are rule of law, security of property rights, an independent and unbiased judiciary, and impartial and effective enforcement of the law. The nine components in this area are indicators of how effectively the pro- tective functions of government are performed. These components are from three primary sources: the International Country Risk Guide, the Global Competitiveness Report, and the World Bank’s Doing Business project.
- 13. Security of property rights, protected by the rule of law, provides the founda- tion for both economic freedom and the efficient operation of markets. Freedom to exchange, for example, is meaningless if individuals do not have secure rights to property, including the fruits of their labor. When individuals and businesses lack confidence that contracts will be enforced and the fruits of their productive efforts protected, their incentive to engage in productive activity is eroded. Perhaps more than any other area, this area is essential for the efficient allocation of resources. Countries with major deficiencies in this area are unlikely to prosper regardless of their policies in the other four areas. 3 Sound Money Money oils the wheels of exchange. An absence of sound money undermines gains from trade. As Milton Friedman informed us long ago, inflation is a monetary phe- nomenon, caused by too much money chasing too few goods. High rates of mone- tary growth invariably lead to inflation. Similarly, when the rate of inflation increases, it also tends to become more volatile. High and volatile rates of inflation distort rela- tive prices, alter the fundamental terms of long-term contracts, and make it virtu- ally impossible for individuals and businesses to plan sensibly for the future. Sound money is essential to protect property rights and, thus, economic freedom. Inflation erodes the value of property held in monetary instruments. W
- 14. hen governments finance their expenditures by creating money, in effect, they are expropriating the property and violating the economic freedom of their citizens. The important thing is that individuals have access to sound money: who pro- vides it makes little difference. Thus, in addition to data on a country’s inflation and its government’s monetary policy, it is important to consider how difficult it is to use alternative, more credible, currencies. If bankers can offer saving and checking accounts in other currencies or if citizens can open foreign bank accounts, then access to sound money is increased and economic freedom expanded. There are four components to the EFW index in Area 3. All of them are objec- tive and relatively easy to obtain and all have been included in the earlier editions of the index. The first three are designed to measure the consistency of monetary policy (or institutions) with long-term price stability. Component 3D is designed to measure the ease with which other currencies can be used via domestic and foreign 6 • Economic Freedom of the World: 2013 Annual Report Fraser Institute ©2013 • www.fraserinstitute.org • www.freetheworld.com
- 15. bank accounts. In order to earn a high rating in this area, a country must follow poli- cies and adopt institutions that lead to low (and stable) rates of inflation and avoid regulations that limit the ability to use alternative currencies. 4 Freedom to Trade Internationally In our modern world of high technology and low costs for communication and transportation, freedom of exchange across national boundaries is a key ingredient of economic freedom. Many goods and services are now either produced abroad or contain resources supplied from abroad. Voluntary exchange is a positive-sum activity: both trading partners gain and the pursuit of the gain provides the motiva- tion for the exchange. Thus, freedom to trade internationally also contributes sub- stantially to our modern living standards. At the urging of protectionist critics and special-interest groups, virtually all countries adopt trade restrictions of various types. Tariffs and quotas are obvious examples of roadblocks that limit international trade. Because they reduce the con- vertibility of currencies, controls on the exchange rate also hinder international trade. The volume of trade is also reduced if the passage of goods through customs is onerous and time consuming. Sometimes these delays are the result of administra- tive inefficiency while in other instances they reflect the actions of corrupt officials seeking to extract bribes. In both cases, economic freedom is
- 16. reduced. The components in this area are designed to measure a wide variety of restraints that affect international exchange: tariffs, quotas, hidden administrative restraints, and controls on exchange rates and capital. In order to get a high rating in this area, a country must have low tariffs, easy clearance and efficient administration of cus- toms, a freely convertible currency, and few controls on the movement of physical and human capital. 5 Regulation W hen regulations restrict entry into markets and interfere with the freedom to engage in voluntary exchange, they reduce economic freedom. The fifth area of the index focuses on regulatory restraints that limit the freedom of exchange in credit, labor, and product markets. The first component (5A) reflects conditions in the domestic credit market. One sub-component provides evidence on the extent to which the banking industry is privately owned. The final two sub-components indi- cate the extent to which credit is supplied to the private sector and whether controls on interest rates interfere with the market in credit. Countries that use a private banking system to allocate credit to private parties and refrain from controlling interest rates receive higher ratings for this regulatory component.
- 17. Many types of labor-market regulations infringe on the economic freedom of employees and employers. Among the more prominent are minimum wages, dis- missal regulations, centralized wage setting, extension of union contracts to non- participating parties, and conscription. The labor-market component (5B) is designed to measure the extent to which these restraints upon economic freedom are present. In order to earn high marks in the component rating regulation of the labor market, a country must allow market forces to determine wages and establish the conditions of hiring and firing, and refrain from the use of conscription. Like the regulation of credit and labor markets, the regulation of business activi- ties (component 5C) inhibits economic freedom. The sub- components of 5C are designed to identify the extent to which regulations and bureaucratic procedures Chapter 1: Economic Freedom of the World in 2011 • 7 www.freetheworld.com • www.fraserinstitute.org • Fraser Institute ©2013 restrain entry and reduce competition. In order to score high in this portion of the index, countries and territories must allow markets to determine prices and refrain from regulatory activities that retard entry into business and
- 18. increase the cost of producing products. They also must refrain from “playing favorites”, that is, from using their power to extract financial payments and reward some businesses at the expense of others. Construction of Area and Summary ratings Theory provides us with some direction regarding elements that should be included in the five areas and the summary index, but it does not indicate what weights should be attached to the components within the areas or among the areas in the construction of the summary index. It would be nice if these factors were inde- pendent of each other and a weight could be attached to each of them. In the past, we investigated several methods of weighting the various components, including principle component analysis and a survey of economists. We have also invited others to use their own weighting structure if they believe that it is preferable. Our experience indicates that the summary index is not very sensitive to alternative weighting methods. Furthermore, there is reason to question whether the areas (and components) are independent or work together like the wheels, motor, transmission, driveshaft, and frame of a car. Just as it is these interconnected parts that provide the mobility of an automobile, it may be the combination of interrelated factors that brings about
- 19. economic freedom. Which is more important for the mobility of an automobile: the motor, wheels, or transmission? The question cannot be easily answered because the parts work together. If any of these key parts break down, the car is immobile. Institutional quality may be much the same. If any of the key parts are absent, the overall effectiveness is undermined. As the result of these two considerations, we organize the elements of the index in a manner that seems sensible to us but we make no attempt to weight the com- ponents in any special way when deriving either area or summary ratings. Of course, the component and sub-component data are available to researchers who would like to consider alternative weighting schemes and we encourage them to do so. Summary Economic Freedom Ratings for 2011 Exhibit 1.2 presents summary economic freedom ratings, sorted from highest to lowest. These ratings are for the year 2011, the most recent year for which com- prehensive data are available. There are now 152 countries and territories rated, up from 144 in last year’s report. The new countries added to the index (with data for both 2010 and 2011) are Brunei Darussalam, Cape Verde, The Gambia, Lebanon, Suriname, Swaziland, Tajikistan, Timor-Leste, and Yemen. Because of the civil war and the unreliability of the data since 2010, the rating for Syria
- 20. has been tempo- rarily suspended. Hong Kong and Singapore, once again, occupy the top two positions. The other nations in the top 10 are New Zealand, Switzerland, United Arab Emirates, Mauritius, Finland, Bahrain, Canada, and Australia. The rankings of some other major coun- tries are the United Kingdom (12th), United States (17th), Germany (19th), Japan (33rd), Korea (33rd), France (40th), Italy (83rd), Mexico (94th), Russia (101st), Brazil 8 • Economic Freedom of the World: 2013 Annual Report Fraser Institute ©2013 • www.fraserinstitute.org • www.freetheworld.com Exhibit 1.2: Summary Economic Freedom Ratings for 2011 0 2 4 6 8 10 Gambia, The 76 Croatia 75 Cambodia 74 El Salvador 73 Macedonia 71 Brunei Darussalam 71 Turkey 68 Mongolia 68 Malaysia 68
- 21. Panama 67 Zambia 64 Uganda 64 Fiji 64 Costa Rica 63 Jamaica 62 Dominican Republic 61 Saudi Arabia 60 Poland 59 Philippines 56 Honduras 56 Guatemala 56 Kuwait 55 Nicaragua 54 Czech Republic 52 Botswana 52 Montenegro 49 Israel 49 Bulgaria 49 Albania 48 Oman 46 Latvia 46 Romania 45 Portugal 44 Uruguay 43 Belgium 42
- 22. Iceland 41 France 40 Bahamas 39 Lebanon 38 Slovak Republic 36 Rwanda 36 Luxembourg 35 Korea, South 33 Japan 33 Spain 32 Norway 31 Netherlands 30 Sweden 29 Hungary 27 Austria 27 Lithuania 25 Georgia 25 Qatar 23 Armenia 23 Peru 22 Malta 21 Ireland 20 Germany 19 Cyprus 18
- 23. United States 17 Estonia 16 Taiwan 15 Denmark 14 Jordan 13 United Kingdom 12 Chile 11 Australia 10 Canada 8 Bahrain 8 Finland 7 Mauritius 6 United Arab Emirates 5 Switzerland 4 New Zealand 3 Singapore 2 Hong Kong 1 0 2 4 6 8 10 Venezuela 152 Myanmar 151 Congo, Republic of 150 Zimbabwe 149 Chad 148 Angola 147
- 24. Central African Rep. 145 Burundi 145 Congo, Dem. Rep. of 144 Algeria 143 Ethiopia 142 Togo 141 Niger 140 Mozambique 139 Guinea-Bissau 138 Argentina 137 Gabon 136 Côte d’Ivoire 135 Ecuador 134 Cameroon 132 Burkina Faso 132 Mali 130 Benin 130 Senegal 129 Tajikistan 128 Iran 127 Ukraine 126 Nepal 125 Nigeria 124 China 123 Vietnam 122
- 25. Cape Verde 121 Suriname 120 Timor-Leste 117 Malawi 117 Azerbaijan 117 Yemen, Republic 116 Sierra Leone 115 Bangladesh 114 Pakistan 111 India 111 Guyana 111 Lesotho 110 Egypt 108 Bolivia 108 Madagascar 107 Namibia 106 Mauritania 105 Serbia 104 Kyrgyz Republic 102 Brazil 102 Russia 101 Swaziland 98 Morocco 98 Haiti 98
- 26. Slovenia 97 Colombia 96 Thailand 94 Mexico 94 Tanzania 93 Sri Lanka 92 Bosnia & Herzegovina 91 Ghana 90 Paraguay 89 South Africa 88 Kenya 87 Belize 86 Greece 85 Kazakhstan 84 Italy 83 Moldova 82 Tunisia 81 Indonesia 80 Trinidad & Tobago 79 Papua New Guinea 77 Barbados 778.97 8.73 8.49 8.30 8.07 8.01
- 31. 4.57 4.08 3.93 Chapter 1: Economic Freedom of the World in 2011 • 9 www.freetheworld.com • www.fraserinstitute.org • Fraser Institute ©2013 (102nd), India (111th), and China (123rd). The 10 lowest-rated countries are: Algeria, Democratic Republic of Congo, Burundi, Central African Republic, Angola, Chad, Zimbabwe, Republic of Congo, Myanmar, and—in last place— Venezuela. Eight of the countries in the bottom ten are located in Africa. The EFW index is calculated back to 1970 as the availability of data allows; see the Chapter 2: Country Data Tables or our website, <http://www.freetheworld.com>, for information from past years. Because some data for earlier years may have been updated or corrected, researchers are always encouraged to use the data from the most recent annual report to assure the best-quality data. Area Economic Freedom Ratings (and Rankings) for 2011 Exhibit 1.3 presents the ratings (and rankings) for each of the five areas of the index and for Components 5A, 5B, and 5C. A number of interesting patterns emerge from an analysis of these data. High-income industrial economies
- 32. generally rank quite high for Legal System and Property Rights (Area 2), Sound Money (Area 3), and Freedom to Trade Internationally (Area 4). Their ratings were lower, however, for Size of Government (Area 1) and Regulation (Area 5). This was particularly true for western European countries. On the other hand, a number of developing nations have a small fiscal size of government but rate low in other areas and, as a result, have a low overall rating. The lesson from this is clear: a small fiscal size of government is insufficient to ensure economic freedom. The institutions of economic freedom, such as the rule of law and property rights, as well as sound money, trade openness, and sensible regula- tion are also required. Weakness in the rule of law and property rights is particularly pronounced in sub-Saharan Africa, among Islamic nations, and for several nations that were for- merly part of the Soviet bloc, though several countries in the latter group have made impressive strides toward improvement. Many nations in Latin America and Southeast Asia also score poorly for rule of law and property rights. The nations that rank poorly in this category also tend to score poorly in the trade and regulation areas, even though several have reasonably sized governments and sound money.
- 33. The Chain-Linked Summary Index The data published in Economic Freedom of the World are available for many countries and territories back to 1970. Through time, the index has become more comprehen- sive and the available data more complete. As a result, the number and composition of the components for many countries will vary across time. This presents a problem similar to that confronted when calculating GDP or a price index over time when we know that the underlying bundle of goods and services is changing from one year to another. In order to correct for this problem and assure comparability across time, we have done the same thing that statisticians analyzing national income do: we have chain-linked the data. The base year for the chain-link index is 2000 and, as a result, the chain-link index is not available for any countries added since that year. Changes in a coun- try’s chain-linked index through time are based only on changes in components 10 • Economic Freedom of the World: 2013 Annual Report Fraser Institute ©2013 • www.fraserinstitute.org • www.freetheworld.com Exhibit 1.3: Area Economic Freedom Ratings (Rankings) for 2011
- 34. Areas Components of Area 5 1 Size of Government 2 Legal System and Property Rights 3 Sound Money 4 Freedom to Trade Internationally 5 Regulation 5A Credit Market regulations 5B Labor Market regulations
- 35. 5C Business regulations Rating (Rank) Rating (Rank) Rating (Rank) Rating (Rank) Rating (Rank) Rating (Rank) Rating (Rank) Rating (Rank) Albania 8.3 (11) 5.0 (92) 9.8 (2) 7.1 (78) 6.2 (122) 7.0 (131) 5.9 (100) 5.8 (99) Algeria 4.4 (144) 4.0 (130) 7.2 (106) 5.7 (140) 5.3 (145) 6.3 (139) 4.9 (128) 4.7 (141) Angola 5.4 (119) 3.7 (139) 5.7 (146) 6.1 (130) 5.0 (148) 7.6 (112) 3.1 (150) 4.3 (144) Argentina 6.0 (99) 4.2 (120) 6.8 (122) 5.8 (138) 5.6 (141) 6.8 (134) 5.3 (118) 4.7 (142) Armenia 8.3 (9) 5.8 (65) 9.1 (46) 7.4 (62) 7.4 (55) 9.2 (43) 6.7 (72) 6.3 (61) Australia 6.2 (89) 8.0 (13) 9.4 (28) 7.7 (47) 8.1 (17) 9.4 (26) 7.3 (55) 7.7 (24) Austria 5.0 (136) 8.0 (14) 9.6 (14) 7.9 (33) 7.5 (47) 9.0 (52) 6.3 (87) 7.2 (35) Azerbaijan 5.4 (118) 6.1 (55) 6.5 (129) 6.5 (110) 6.9 (87) 8.0 (100) 6.6 (73) 6.1 (72) Bahamas 8.2 (14) 6.6 (40) 7.1 (111) 6.3 (119) 8.8 (5) 8.8 (71) 8.9 (7) 8.7 (2) Bahrain 6.9 (55) 6.8 (33) 9.3 (33) 7.9 (31) 8.7 (6) 9.0 (59) 8.9
- 36. (6) 8.3 (8) Bangladesh 8.8 (4) 3.6 (140) 6.5 (133) 6.1 (132) 6.7 (103) 8.2 (90) 6.6 (75) 5.3 (124) Barbados 6.7 (66) 6.7 (38) 6.3 (137) 7.6 (55) 7.5 (49) 7.9 (103) 7.7 (37) 6.9 (44) Belgium 3.9 (149) 7.1 (27) 9.7 (6) 8.1 (19) 8.0 (23) 9.5 (24) 7.4 (50) 7.0 (40) Belize 6.9 (54) 4.4 (116) 8.4 (73) 6.5 (112) 8.0 (21) 10.0 (1) 8.2 (19) 5.8 (97) Benin 6.1 (96) 4.5 (111) 6.9 (116) 5.7 (139) 6.6 (105) 9.1 (49) 5.9 (99) 4.9 (134) Bolivia 6.3 (80) 4.3 (117) 8.5 (71) 7.0 (88) 5.7 (139) 8.7 (75) 4.5 (139) 4.0 (147) Bosnia & Herzegovina 5.3 (122) 5.2 (86) 8.1 (85) 7.5 (58) 7.1 (73) 9.7 (16) 6.3 (86) 5.4 (120) Botswana 6.2 (84) 6.7 (37) 8.5 (68) 7.0 (86) 7.8 (34) 9.1 (50) 7.3 (56) 6.9 (42) Brazil 7.0 (48) 5.3 (85) 8.2 (77) 7.1 (77) 4.9 (149) 6.5 (137) 4.6 (137) 3.7 (149) Brunei Darussalam 5.0 (134) 6.5 (41) 8.2 (78) 7.7 (42) 7.8 (32) 7.1 (130) 9.0 (4) 7.3 (32) Bulgaria 6.6 (69) 5.0 (91) 9.3 (35) 7.6 (52) 7.7 (35) 9.7 (15) 7.7 (34) 5.8 (100) Burkina Faso 5.2 (127) 4.3 (119) 6.9 (118) 6.0 (134) 7.3 (60)
- 37. 8.3 (86) 7.8 (31) 5.9 (86) Burundi 4.3 (146) 3.1 (143) 7.1 (113) 5.0 (148) 6.9 (90) 7.9 (104) 7.7 (36) 5.1 (131) Cambodia 7.9 (21) 4.8 (100) 9.2 (42) 7.0 (83) 6.2 (125) 6.0 (144) 7.4 (52) 5.2 (126) Cameroon 6.2 (90) 3.9 (136) 6.8 (123) 6.1 (128) 6.7 (100) 7.6 (115) 7.9 (28) 4.7 (140) Canada 6.2 (87) 8.1 (11) 9.1 (48) 7.6 (49) 8.6 (8) 9.5 (25) 8.5 (10) 7.7 (22) Cape Verde 5.4 (120) 6.0 (56) 6.2 (140) 6.6 (104) 7.0 (85) 9.2 (40) 4.7 (134) 7.0 (41) Central African Rep. 7.0 (50) 2.3 (151) 6.8 (124) 4.7 (149) 5.5 (142) 7.3 (124) 3.4 (149) 5.9 (88) Chad 5.9 (100) 2.8 (146) 5.9 (144) 5.0 (147) 5.2 (146) 6.3 (140) 6.2 (90) 3.1 (151) Chile 7.5 (33) 7.2 (26) 8.9 (60) 8.2 (17) 7.6 (40) 9.3 (30) 6.3 (89) 7.3 (31) China 4.5 (143) 6.0 (57) 7.9 (91) 6.6 (105) 6.1 (130) 6.8 (136) 5.6 (111) 6.0 (80) Chapter 1: Economic Freedom of the World in 2011 • 11 www.freetheworld.com • www.fraserinstitute.org • Fraser Institute ©2013
- 38. Exhibit 1.3 (continued): Area Economic Freedom Ratings (Rankings) for 2011 Areas Components of Area 5 1 Size of Government 2 Legal System and Property Rights 3 Sound Money 4 Freedom to Trade Internationally 5 Regulation 5A Credit Market regulations 5B Labor Market
- 39. regulations 5C Business regulations Rating (Rank) Rating (Rank) Rating (Rank) Rating (Rank) Rating (Rank) Rating (Rank) Rating (Rank) Rating (Rank) Colombia 6.2 (88) 4.2 (121) 8.2 (80) 7.3 (67) 7.1 (70) 9.3 (30) 5.8 (103) 6.3 (62) Congo, Dem. Rep. of 5.7 (109) 2.4 (150) 7.4 (103) 5.2 (143) 5.7 (140) 5.5 (148) 5.7 (108) 5.8 (91) Congo, Republic of 4.5 (141) 2.8 (147) 4.6 (150) 5.1 (146) 5.9 (136) 6.3 (141) 6.5 (77) 4.9 (136) Costa Rica 7.8 (23) 6.1 (54) 6.9 (119) 8.2 (15) 6.6 (107) 7.2 (126) 6.3 (88) 6.3 (66) Côte d’Ivoire 6.5 (74) 3.1 (142) 6.5 (130) 6.1 (126) 6.5 (108) 9.0 (59) 5.7 (104) 4.9 (137) Croatia 5.3 (123) 5.7 (73) 9.5 (21) 7.6 (56) 7.0 (79) 9.2 (41) 6.4 (83) 5.4 (119) Cyprus 7.2 (41) 6.8 (36) 9.5 (23) 8.1 (20) 7.0 (82) 8.1 (96) 6.1 (92) 6.7 (48) Czech Republic 5.3 (124) 6.2 (52) 9.5 (24) 7.7 (41) 7.6 (43) 9.3 (36) 7.6 (44) 5.8 (90) Denmark 4.3 (145) 8.2 (10) 9.7 (5) 8.3 (12) 8.4 (9) 9.7 (14) 7.4 (53) 8.2 (11)
- 40. Dominican Republic 8.2 (12) 4.2 (124) 9.3 (36) 7.6 (54) 6.3 (119) 7.0 (132) 6.4 (78) 5.6 (114) Ecuador 5.6 (115) 4.0 (133) 6.5 (131) 7.0 (87) 6.2 (128) 9.3 (37) 4.3 (142) 5.0 (133) Egypt 6.8 (65) 4.5 (109) 9.1 (52) 6.3 (123) 5.2 (147) 5.0 (151) 4.9 (127) 5.7 (108) El Salvador 8.4 (7) 3.9 (135) 9.1 (47) 7.3 (65) 6.4 (117) 8.5 (80) 4.8 (130) 5.9 (87) Estonia 6.3 (81) 7.3 (23) 8.9 (57) 8.3 (11) 8.0 (22) 10.0 (1) 6.2 (91) 7.8 (20) Ethiopia 6.2 (86) 5.4 (80) 4.4 (151) 5.1 (145) 6.2 (124) 5.5 (147) 7.5 (47) 5.7 (103) Fiji 7.9 (20) 5.8 (68) 6.5 (134) 6.6 (108) 8.9 (4) 9.4 (27) 9.0 (3) 8.2 (10) Finland 5.0 (133) 8.9 (1) 9.5 (25) 8.5 (9) 8.0 (20) 9.9 (11) 5.6 (112) 8.6 (4) France 4.7 (139) 7.3 (24) 9.6 (9) 8.0 (28) 7.3 (61) 9.0 (54) 5.9 (97) 7.1 (36) Gabon 5.7 (104) 4.6 (107) 5.4 (147) 6.1 (127) 6.8 (96) 7.1 (128) 7.4 (48) 5.8 (95) Gambia, The 6.0 (98) 5.8 (64) 8.1 (84) 7.7 (45) 7.3 (64) 7.3 (125) 8.1 (21) 6.4 (57) Georgia 6.9 (52) 5.7 (71) 9.0 (53) 8.5 (8) 7.9 (27) 9.0 (53) 7.0 (64) 7.6 (26)
- 41. Germany 5.6 (114) 8.0 (15) 9.6 (16) 7.9 (32) 7.4 (56) 8.3 (89) 6.3 (84) 7.6 (27) Ghana 7.3 (37) 5.5 (77) 7.1 (110) 6.8 (97) 6.8 (98) 7.8 (105) 6.6 (74) 5.9 (89) Greece 6.2 (85) 5.3 (83) 9.6 (12) 7.6 (57) 5.4 (144) 6.0 (145) 4.3 (143) 6.0 (78) Guatemala 8.0 (16) 4.1 (127) 9.3 (38) 8.2 (18) 6.5 (113) 8.8 (70) 4.7 (131) 5.8 (92) Guinea-Bissau 6.3 (82) 2.9 (145) 6.1 (142) 6.2 (125) 7.0 (80) 10.0 (10) 3.5 (148) 7.6 (28) Guyana 5.0 (134) 4.4 (114) 7.7 (99) 7.0 (85) 7.6 (44) 8.5 (82) 8.2 (18) 5.9 (83) Haiti 8.7 (5) 2.2 (152) 8.0 (89) 6.9 (94) 7.1 (75) 9.0 (63) 8.3 (16) 4.0 (148) Honduras 8.3 (10) 4.1 (128) 9.3 (39) 7.6 (51) 6.8 (97) 9.2 (44) 5.0 (122) 6.2 (68) Hong Kong 8.9 (3) 8.1 (12) 9.2 (45) 9.4 (1) 9.3 (1) 10.0 (1) 9.3 (1) 8.5 (6) Hungary 6.7 (67) 6.2 (53) 9.6 (10) 7.7 (40) 7.7 (36) 10.0 (1) 6.8 (68) 6.3 (63) 12 • Economic Freedom of the World: 2013 Annual Report Fraser Institute ©2013 • www.fraserinstitute.org •
- 42. www.freetheworld.com Exhibit 1.3 (continued): Area Economic Freedom Ratings (Rankings) for 2011 Areas Components of Area 5 1 Size of Government 2 Legal System and Property Rights 3 Sound Money 4 Freedom to Trade Internationally 5 Regulation 5A Credit Market regulations 5B
- 43. Labor Market regulations 5C Business regulations Rating (Rank) Rating (Rank) Rating (Rank) Rating (Rank) Rating (Rank) Rating (Rank) Rating (Rank) Rating (Rank) Iceland 5.0 (137) 8.2 (8) 9.3 (41) 6.6 (106) 7.8 (31) 7.6 (114) 7.6 (41) 8.2 (9) India 6.4 (78) 5.7 (70) 6.7 (125) 6.3 (122) 6.8 (99) 7.0 (133) 8.0 (24) 5.3 (123) Indonesia 7.8 (26) 4.6 (108) 9.1 (51) 6.8 (98) 6.3 (120) 8.2 (93) 4.7 (132) 6.0 (82) Iran 6.1 (95) 5.8 (63) 7.7 (98) 5.1 (144) 5.5 (143) 6.2 (142) 4.7 (135) 5.6 (111) Ireland 4.8 (138) 7.9 (17) 9.6 (11) 8.8 (3) 7.3 (62) 6.1 (143) 8.1 (20) 7.7 (25) Israel 6.2 (83) 6.2 (50) 8.8 (64) 8.0 (29) 7.0 (78) 9.0 (58) 5.2 (121) 6.9 (43) Italy 3.7 (151) 5.9 (60) 9.7 (7) 7.8 (39) 7.2 (68) 9.0 (65) 7.0 (67) 5.7 (105) Jamaica 7.7 (28) 5.0 (94) 8.6 (66) 7.3 (68) 7.1 (72) 7.6 (110) 7.9 (29) 5.9 (85)
- 44. Japan 5.3 (125) 7.4 (22) 9.9 (1) 7.1 (76) 7.8 (30) 8.1 (97) 8.3 (14) 7.1 (37) Jordan 7.6 (30) 6.5 (43) 9.1 (49) 7.9 (30) 7.9 (24) 8.3 (87) 8.4 (12) 7.0 (39) Kazakhstan 7.1 (46) 6.0 (59) 8.2 (79) 5.4 (141) 7.6 (42) 9.3 (30) 7.1 (60) 6.3 (64) Kenya 7.0 (49) 4.7 (104) 8.4 (74) 6.7 (100) 7.2 (65) 8.5 (78) 7.6 (45) 5.6 (110) Korea, South 6.8 (58) 6.6 (39) 9.5 (26) 7.6 (53) 6.9 (86) 9.3 (30) 4.7 (133) 6.8 (46) Kuwait 6.4 (76) 7.0 (29) 7.9 (90) 7.5 (61) 7.3 (63) 8.3 (84) 7.1 (62) 6.5 (55) Kyrgyz Republic 7.7 (29) 4.4 (112) 7.6 (100) 6.4 (115) 6.4 (116) 7.1 (129) 6.4 (80) 5.7 (102) Latvia 5.7 (108) 6.5 (44) 9.0 (55) 8.1 (24) 7.4 (59) 9.0 (64) 6.7 (70) 6.4 (59) Lebanon 9.0 (2) 4.7 (103) 9.4 (30) 7.1 (81) 7.0 (83) 7.4 (118) 8.0 (25) 5.5 (116) Lesotho 5.7 (110) 4.5 (110) 8.0 (88) 6.1 (129) 7.4 (58) 10.0 (1) 7.1 (63) 5.1 (130) Lithuania 7.0 (51) 6.5 (42) 9.2 (43) 7.7 (46) 7.7 (38) 9.0 (56) 7.4 (49) 6.6 (53) Luxembourg 3.9 (148) 8.3 (7) 9.4 (31) 8.2 (13) 7.7 (39) 9.3 (38) 5.7 (107) 8.0 (15)
- 45. Macedonia 6.1 (92) 5.4 (81) 8.1 (82) 7.5 (59) 8.1 (18) 9.8 (12) 7.7 (40) 6.8 (45) Madagascar 9.0 (1) 3.0 (144) 7.9 (92) 5.9 (135) 6.0 (133) 7.6 (113) 4.9 (129) 5.5 (117) Malawi 5.8 (103) 5.2 (88) 7.4 (105) 6.4 (116) 6.8 (94) 7.8 (107) 7.1 (61) 5.6 (112) Malaysia 6.0 (97) 6.9 (31) 6.5 (132) 7.6 (50) 8.2 (15) 9.2 (42) 8.0 (26) 7.5 (30) Mali 6.1 (94) 4.4 (113) 6.6 (127) 6.4 (113) 6.1 (129) 7.7 (109) 5.5 (114) 5.3 (125) Malta 5.8 (102) 7.2 (25) 9.5 (22) 8.2 (16) 7.5 (45) 9.0 (55) 7.2 (58) 6.3 (65) Mauritania 7.3 (40) 4.8 (99) 6.8 (121) 6.4 (114) 6.8 (92) 8.8 (72) 7.4 (51) 4.3 (143) Mauritius 7.9 (18) 6.4 (47) 9.2 (44) 8.4 (10) 8.2 (16) 9.7 (13) 7.7 (38) 7.1 (38) Mexico 6.8 (64) 4.6 (106) 8.1 (83) 7.0 (82) 6.7 (104) 8.3 (83) 5.5 (115) 6.2 (70) Moldova 7.5 (35) 5.5 (78) 7.6 (102) 6.8 (96) 6.9 (88) 9.5 (20) 5.5 (113) 5.7 (107) Mongolia 7.3 (39) 5.8 (67) 7.8 (95) 6.9 (92) 7.5 (48) 9.5 (23) 7.2 (57) 5.8 (96) Chapter 1: Economic Freedom of the World in 2011 • 13
- 46. www.freetheworld.com • www.fraserinstitute.org • Fraser Institute ©2013 Exhibit 1.3 (continued): Area Economic Freedom Ratings (Rankings) for 2011 Areas Components of Area 5 1 Size of Government 2 Legal System and Property Rights 3 Sound Money 4 Freedom to Trade Internationally 5 Regulation 5A Credit Market regulations
- 47. 5B Labor Market regulations 5C Business regulations Rating (Rank) Rating (Rank) Rating (Rank) Rating (Rank) Rating (Rank) Rating (Rank) Rating (Rank) Rating (Rank) Montenegro 5.7 (107) 6.3 (49) 8.9 (58) 7.8 (38) 7.6 (41) 9.6 (18) 7.1 (59) 6.1 (74) Morocco 6.6 (70) 6.0 (58) 7.2 (109) 7.0 (89) 6.1 (131) 7.2 (127) 4.5 (138) 6.6 (52) Mozambique 5.6 (112) 4.2 (125) 6.1 (141) 6.4 (117) 5.9 (135) 8.9 (66) 3.1 (151) 5.7 (106) Myanmar 5.7 (111) 3.2 (141) 5.3 (148) 1.8 (152) 4.5 (150) 5.3 (150) Namibia 5.2 (129) 6.4 (48) 6.3 (138) 6.2 (124) 7.9 (26) 10.0 (1) 7.6 (42) 6.1 (73) Nepal 7.6 (31) 4.2 (126) 6.3 (136) 6.4 (118) 6.5 (109) 8.2 (91) 5.8 (102) 5.5 (115) Netherlands 3.6 (152) 8.3 (6) 9.5 (19) 8.6 (7) 7.8 (29) 8.8 (69) 6.8 (69) 7.9 (18) New Zealand 6.5 (72) 8.8 (2) 9.6 (13) 8.7 (5) 8.9 (3) 9.5 (21)
- 48. 8.7 (9) 8.5 (7) Nicaragua 7.9 (19) 4.8 (98) 8.5 (70) 7.8 (36) 7.2 (69) 9.7 (17) 6.3 (85) 5.6 (113) Niger 6.8 (62) 3.9 (134) 6.7 (126) 4.4 (150) 6.3 (121) 9.6 (19) 3.8 (146) 5.3 (121) Nigeria 6.3 (79) 4.0 (132) 7.2 (108) 6.5 (109) 7.0 (84) 8.3 (88) 7.8 (30) 4.8 (138) Norway 5.1 (130) 8.6 (3) 9.4 (29) 7.3 (66) 7.4 (50) 10.0 (1) 4.3 (141) 8.0 (16) Oman 5.1 (131) 7.5 (21) 7.6 (101) 8.1 (23) 8.3 (11) 9.0 (59) 8.0 (23) 7.9 (19) Pakistan 8.7 (6) 4.2 (123) 6.2 (139) 6.3 (120) 6.3 (118) 7.9 (102) 5.9 (98) 5.1 (127) Panama 6.5 (71) 5.2 (87) 8.5 (69) 8.2 (14) 6.9 (91) 9.1 (45) 5.2 (120) 6.3 (67) Papua New Guinea 7.5 (34) 4.7 (102) 7.2 (107) 7.0 (84) 8.3 (10) 8.6 (76) 8.7 (8) 7.7 (23) Paraguay 7.9 (17) 3.7 (138) 8.9 (62) 7.2 (72) 6.2 (126) 8.3 (84) 4.6 (136) 5.6 (109) Peru 7.8 (24) 4.9 (96) 9.4 (27) 8.6 (6) 7.4 (52) 9.3 (30) 7.0 (65) 6.0 (81) Philippines 8.3 (8) 4.6 (105) 9.3 (40) 6.7 (99) 7.1 (76) 9.1 (47) 6.1 (94) 6.0 (77) Poland 5.5 (116) 6.4 (46) 9.5 (20) 7.4 (64) 7.2 (67) 8.0 (99) 7.7
- 49. (39) 6.0 (79) Portugal 5.6 (113) 6.8 (35) 9.7 (3) 8.0 (25) 6.6 (106) 8.2 (94) 4.9 (126) 6.7 (49) Qatar 6.9 (56) 7.9 (18) 8.1 (86) 7.8 (37) 7.5 (46) 5.9 (146) 7.9 (27) 8.6 (5) Romania 6.5 (73) 5.6 (74) 9.3 (32) 7.8 (35) 7.4 (57) 9.3 (29) 7.0 (66) 5.8 (94) Russia 6.8 (63) 5.4 (82) 8.5 (67) 5.9 (136) 6.2 (127) 7.3 (122) 6.0 (95) 5.3 (122) Rwanda 6.4 (77) 6.8 (34) 8.9 (61) 6.9 (91) 8.3 (12) 8.6 (77) 8.3 (15) 8.0 (14) Saudi Arabia 5.1 (132) 7.5 (19) 7.8 (96) 7.3 (69) 8.1 (19) 8.1 (95) 8.1 (22) 7.9 (17) Senegal 5.7 (106) 4.4 (115) 7.0 (115) 6.7 (102) 6.0 (132) 8.9 (68) 4.4 (140) 4.9 (135) Serbia 5.9 (101) 5.0 (95) 7.9 (93) 7.2 (74) 6.4 (114) 8.5 (81) 5.7 (105) 5.1 (129) Sierra Leone 8.1 (15) 4.2 (122) 6.9 (117) 6.6 (103) 5.7 (138) 5.4 (149) 5.9 (101) 5.9 (84) Singapore 8.2 (13) 8.4 (5) 8.9 (59) 9.3 (2) 8.9 (2) 10.0 (1) 7.7 (35) 9.0 (1) Slovak Republic 6.4 (75) 5.8 (66) 9.6 (15) 8.0 (26) 7.4 (51) 9.0 (57) 7.6 (43) 5.7 (104)
- 50. 14 • Economic Freedom of the World: 2013 Annual Report Fraser Institute ©2013 • www.fraserinstitute.org • www.freetheworld.com Areas Components of Area 5 1 Size of Government 2 Legal System and Property Rights 3 Sound Money 4 Freedom to Trade Internationally 5 Regulation 5A Credit Market regulations
- 51. 5B Labor Market regulations 5C Business regulations Rating (Rank) Rating (Rank) Rating (Rank) Rating (Rank) Rating (Rank) Rating (Rank) Rating (Rank) Rating (Rank) Slovenia 4.5 (142) 6.2 (51) 8.3 (75) 7.5 (60) 6.5 (111) 7.4 (119) 5.6 (110) 6.5 (54) South Africa 5.5 (117) 5.9 (62) 8.3 (76) 7.2 (73) 7.2 (66) 9.1 (46) 6.0 (96) 6.6 (51) Spain 6.2 (91) 6.8 (32) 9.7 (4) 7.8 (34) 7.1 (71) 9.4 (28) 5.4 (116) 6.6 (50) Sri Lanka 7.8 (22) 5.3 (84) 6.5 (135) 6.9 (90) 6.7 (101) 7.4 (120) 6.4 (81) 6.4 (56) Suriname 5.4 (121) 4.3 (118) 8.5 (72) 6.5 (111) 6.8 (93) 7.7 (108) 7.8 (33) 5.0 (132) Swaziland 5.7 (105) 4.8 (97) 7.8 (94) 6.7 (101) 7.7 (37) 8.9 (67) 7.8 (32) 6.4 (60) Sweden 3.7 (150) 8.2 (9) 9.6 (8) 8.0 (27) 8.3 (14) 10.0 (1) 6.7 (71) 8.1 (13) Switzerland 7.7 (27) 8.6 (4) 9.3 (34) 7.2 (71) 8.6 (7) 9.3 (30) 8.4 (13) 8.1 (12)
- 52. Taiwan 7.5 (32) 7.0 (28) 9.5 (18) 7.7 (44) 7.1 (77) 8.7 (74) 5.0 (124) 7.6 (29) Tajikistan 5.2 (126) 5.4 (79) 7.1 (112) 5.9 (137) 6.4 (115) 8.0 (100) 5.2 (119) 6.0 (75) Tanzania 7.1 (43) 5.7 (69) 7.4 (104) 6.0 (133) 7.0 (81) 8.7 (73) 6.4 (79) 5.8 (93) Thailand 7.3 (38) 5.1 (89) 7.0 (114) 6.9 (93) 6.8 (95) 9.3 (39) 5.0 (125) 6.2 (69) Timor-Leste 4.1 (147) 3.8 (137) 8.8 (63) 7.4 (63) 7.4 (54) 9.5 (22) 7.3 (54) 5.4 (118) Togo 6.7 (68) 2.6 (148) 6.6 (128) 6.1 (131) 5.9 (134) 7.5 (117) 4.2 (145) 6.1 (71) Trinidad & Tobago 6.8 (61) 4.7 (101) 8.1 (81) 7.6 (48) 7.4 (53) 9.0 (59) 7.5 (46) 5.8 (98) Tunisia 6.9 (53) 6.4 (45) 6.8 (120) 7.1 (79) 7.1 (74) 7.6 (116) 6.5 (76) 7.2 (34) Turkey 7.1 (45) 5.5 (76) 9.0 (54) 7.2 (70) 6.5 (112) 8.0 (98) 5.0 (123) 6.4 (58) Uganda 7.4 (36) 5.0 (93) 8.1 (87) 7.1 (75) 7.9 (25) 9.0 (51) 8.9 (5) 5.8 (101) Ukraine 6.8 (60) 5.1 (90) 6.0 (143) 6.6 (107) 6.2 (123) 8.5 (79) 6.1 (93) 4.1 (146) United Arab Emirates 7.8 (25) 7.5 (20) 8.6 (65) 8.1 (21) 8.3 (13) 7.6 (111) 8.5 (11) 8.7 (3)
- 53. United Kingdom 5.2 (128) 8.0 (16) 9.6 (17) 8.7 (4) 7.8 (33) 7.3 (123) 8.3 (17) 7.7 (21) United States 6.8 (59) 7.0 (30) 9.3 (37) 7.7 (43) 7.9 (28) 7.3 (121) 9.0 (2) 7.3 (33) Uruguay 7.1 (44) 5.6 (75) 9.1 (50) 8.1 (22) 6.9 (89) 8.2 (92) 5.7 (106) 6.7 (47) Venezuela 4.6 (140) 2.5 (149) 4.7 (149) 3.4 (151) 4.4 (151) 6.5 (138) 3.5 (147) 3.3 (150) Vietnam 7.0 (47) 5.7 (72) 5.7 (145) 6.3 (121) 6.5 (110) 9.1 (48) 5.6 (109) 4.7 (139) Yemen, Republic 7.1 (42) 4.0 (129) 7.7 (97) 6.9 (95) 5.8 (137) 6.8 (135) 5.4 (117) 5.1 (128) Zambia 6.9 (57) 5.9 (61) 8.9 (56) 7.1 (80) 6.7 (102) 7.8 (106) 6.4 (82) 6.0 (76) Zimbabwe 6.1 (93) 4.0 (131) 3.2 (152) 5.2 (142) 4.3 (152) 4.5 (152) 4.3 (144) 4.3 (145) Exhibit 1.3 (continued): Area Economic Freedom Ratings (Rankings) for 2011 Chapter 1: Economic Freedom of the World in 2011 • 15 www.freetheworld.com • www.fraserinstitute.org • Fraser Institute ©2013 that were present in adjoining years. For example, the 2010
- 54. chain-linked rating is based on the 2009 rating but is adjusted based on the changes in the underlying data between 2009 and 2010 for those components that were present in both years. If the common components for a country in 2010 were the same as in 2009, then no adjustment was made to the country’s 2010 summary rating. However, if the 2010 components were lower than those for 2009 for the components present in both years, then the country’s 2010 summary rating was adjusted downward pro- portionally to reflect this fact. Correspondingly, in cases where the ratings for the common components were higher in 2010 than for 2009, the country’s 2010 sum- mary rating was adjusted upward proportionally. The chain- linked ratings were constructed by repeating this procedure backward in time to 1970 and forward in time to 2011. The chain-linked methodology means that a country’s rating will change across time periods only when there is a change in ratings for components present during adjacent years. This is precisely what one would want when making comparisons across time periods. Average chain-linked economic freedom rating Exhibit 1.4 shows the average chain-linked economic freedom rating for the 101 countries with ratings since 1980. The average level of economic freedom, as mea-
- 55. sured by this chain-linked EFW index, has increased from 5.34 in 1980 to 5.82 in 1990 to 6.74 in 2000 and finally to 6.87 in 2011. After seeing the global average drop between 2007 and 2009, the average summary rating increased modestly in both 2010 and 2011. We have also derived the average summary rating for the 101 countries and ter- ritories weighted by country population. The pattern of the population weighted summary ratings is the same as that of Exhibit 1.4. This indicates that, on average, the world is more economically free to day than it was three decades ago. The major contributing factors to this long-term increase in economic freedom were reduc- tions in marginal income-tax rates, more stable monetary policy, a decline in the use of military conscription, and liberalization of trade policies. The chain-linked summary ratings for all years are found in Exhibit 1.5. The chain-link methodology was also used to derive ratings for Area 1 to Area 5. These are shown at the top of the country tables above the unadjusted ratings. Please note that there can be significant differences between the unadjusted and the chain-linked ratings; this is especially true for countries with less complete data in earlier years. Researchers conducting long-term studies should use the chain- linked data.
- 56. The declining economic freedom of the United States Throughout most of period from 1980 to 2000, the United States ranked as the world’s third-freest economy, behind Hong Kong and Singapore. As Exhibit 1.5 indicates, the chain-linked summary rating of the United States in 2000 was 8.65, second only to Hong Kong. By 2005, the US rating had slipped to 8.21 and its rank- ing fallen to 8th. The slide has continued. The United States placed 16th in 2010 and 19th in 2011. The 7.74 chain-linked rating of the United States in 2011 was nearly a full point less than the 2000 rating. W hat accounts for the decline of economic freedom in the United States? W hile the US ratings and rankings have fallen in all five areas of the EFW index, 16 • Economic Freedom of the World: 2013 Annual Report Fraser Institute ©2013 • www.fraserinstitute.org • www.freetheworld.com the reductions have been largest in Legal System and Property Rights (Area 2), Freedom to Trade Internationally (Area 4), and Regulation (Area 5). The plunge in Area 2 has been huge. In 20 0 0, the 9.23 rating of the United States was the ninth highest in the world. But by 2011, the area rating had slid to 6.93, placing the United States 38th worldwide. The 2.30-point reduction in
- 57. the Area 2 rating of the United States was tied with Venezuela as the largest reduction among the countries rated. While it is difficult to pinpoint the precise reason for this decline, the increased use of eminent domain to transfer property to powerful political interests, the rami- fications of the wars on terrorism and drugs, and the violation of the property rights of bondholders in the auto-bailout case have all weakened the tradition of strong adherence to the rule of law in the United States and we believe have contributed to the sharp decline in the rating for Area 2. Expanded use of regulation has been an important contributing factor to the declining ratings of the United States. During the past decade, non-tariff trade bar- riers, restrictions on foreign investment, and business regulation have all grown extensively. Michael Walker, who along with Milton and Rose Friedman, was the central figure in the development of this project, often stated: “Regulation is the raw material of corruption”. Thus, he would not be surprised that the expanded use of regulation in the United States was accompanied with sharp reductions in ratings for components such as independence of the judiciary, impartiality of the courts, and regulatory favoritism. To a large degree, the United States has expe- rienced a significant move away from rule of law and toward a
- 58. highly regulated, politicized state. The approximate one-unit decline in the summary rating between 2000 and 2010 on the 10-point scale of the index may not sound like much, but scholarly work on this topic indicates that a one-point decline is associated with a reduction in the long-term growth of GDP of between 1.0 and 1.5 percentage points annu- ally (Gwartney, Holcombe, and Lawson, 2006). This implies that, unless policies undermining economic freedom are reversed, the future annual growth of the US economy will be half its historic average of 3%. Exhibit 1.4: Average Chain-linked EFW Rating for the 101 countries with ratings since 1980 0 1 2 3 4 5 6 7
- 59. 8 9 10 201120102009200820072006200520001995199019851980 A ve ra g e C h ai n -l in ke d E FW R at in
- 60. g 5.34 5.43 5.82 6.38 6.74 6.87 6.91 6.92 6.83 6.82 6.876.86 Chapter 1: Economic Freedom of the World in 2011 • 17 www.freetheworld.com • www.fraserinstitute.org • Fraser Institute ©2013 Exhibit 1.5: Chain-linked summary ratings from 1970 to 2011 1970 1975 1980 1985 1990 1995 2000 2001 2002 2003 2004 2005 2006 2007 2008 2009 2010 2011 Albania 4.37 5.07 6.23 6.28 6.64 7.13 6.92 7.12 7.31 7.45 7.44 7.47 7.49 7.42 Algeria 3.82 3.60 3.43 4.06 4.66 4.68 4.60 4.63 4.76 5.25 5.17 5.14 4.95 4.97 5.01 4.71 Argentina 4.36 2.76 3.96 3.30 4.42 7.04 7.40 6.73 6.23 6.09 6.23 5.97 6.09 6.30 6.07 5.95 5.70 5.67 Australia 6.96 6.07 6.86 7.17 7.57 7.98 8.07 7.93 7.97 8.11 8.02 8.24 8.28 8.32 8.21 8.10 8.07 8.05 Austria 6.08 5.93 6.33 6.34 6.98 7.16 7.55 7.38 7.40 7.96 7.86 7.84 7.81 7.79 7.68 7.62 7.60 7.58 Bahamas 6.38 6.26 6.33 6.43 6.41 6.69 6.78 6.75 6.79 6.89 6.85
- 61. 6.72 6.81 6.85 6.73 6.65 6.63 Bahrain 7.42 6.92 6.91 7.21 7.74 7.64 7.62 7.56 7.34 7.39 7.65 7.81 7.72 7.61 7.75 7.88 Bangladesh 3.03 3.38 3.68 4.57 5.49 6.02 5.81 5.99 5.89 5.69 6.17 6.34 6.29 6.30 6.52 6.43 6.42 Barbados 5.53 5.66 6.10 6.15 6.14 6.20 6.21 6.11 6.12 6.20 6.39 6.18 6.14 6.08 6.27 6.56 6.53 Belgium 7.44 6.80 7.06 7.03 7.35 7.43 7.89 7.53 7.48 7.67 7.54 7.53 7.50 7.54 7.46 7.42 7.52 7.48 Belize 5.69 5.42 6.10 6.86 6.54 6.48 6.93 6.96 6.88 6.93 6.81 6.83 6.82 6.82 6.72 6.69 Benin 5.23 4.98 5.25 4.92 5.49 5.51 5.64 5.59 5.44 5.59 5.91 5.79 5.67 5.74 5.73 5.60 Bolivia 4.18 3.44 5.42 6.60 6.97 6.70 6.55 6.49 6.38 6.38 6.40 6.17 6.12 6.34 6.36 6.33 Botswana 5.25 5.57 5.92 6.40 7.42 7.39 7.42 7.21 7.24 7.31 7.20 7.35 7.07 7.00 7.20 7.46 Brazil 5.10 4.06 3.83 3.28 4.46 4.72 5.93 5.86 6.16 6.01 6.03 6.27 6.21 6.16 6.42 6.33 6.52 6.56 Bulgaria 5.02 3.90 4.60 5.37 5.88 6.45 6.69 6.63 6.85 7.00 7.03 7.10 7.24 7.20 7.16 Burundi 3.83 3.94 4.37 4.58 3.89 4.73 4.95 4.73 4.50 4.61 4.84 5.31 5.23 4.81 5.22 5.04 5.20 Cameroon 5.62 5.73 5.81 5.68 5.92 6.04 6.07 6.10 6.18 6.19
- 62. 6.16 6.04 5.97 6.11 6.33 6.23 Canada 7.91 7.12 7.68 7.78 8.09 8.11 8.36 8.25 8.22 8.33 8.29 8.34 8.31 8.29 8.25 8.14 8.17 8.05 Central African Rep. 4.35 4.80 4.39 5.27 5.35 5.21 5.75 5.82 5.26 5.47 5.74 5.68 5.76 5.70 5.75 Chad 4.97 4.97 4.93 5.47 5.91 5.90 5.81 5.62 5.30 5.38 5.37 5.36 5.52 5.60 5.54 Chile 3.96 3.62 5.38 5.83 6.78 7.53 7.41 7.57 7.70 7.89 7.75 7.92 7.93 8.05 7.98 7.92 7.98 7.90 China 3.74 4.74 4.43 5.17 5.75 5.81 5.79 5.87 5.54 5.88 5.98 6.09 6.07 6.12 6.08 6.03 Colombia 5.28 4.84 4.74 5.22 5.07 5.59 5.51 5.58 5.57 5.82 5.82 5.84 5.97 6.18 6.12 6.32 6.35 6.41 Congo, Dem. Rep. 4.05 3.49 2.60 3.61 3.03 3.28 3.85 3.73 4.58 4.53 4.55 4.52 5.04 5.11 5.08 4.98 5.07 5.07 Congo, Republic of 4.50 4.31 4.97 5.02 4.28 4.62 4.48 4.72 4.81 4.71 4.81 4.73 4.94 5.19 4.99 4.72 Costa Rica 5.92 5.07 5.03 6.64 6.97 7.51 7.32 7.21 7.44 7.20 7.66 7.85 7.67 7.46 7.49 7.42 7.21 Côte d’Ivoire 5.39 6.08 5.57 5.20 5.99 5.96 5.82 5.90 5.90 6.01 6.13 6.10 5.86 6.10 5.91 5.94 Croatia 5.06 6.35 6.28 6.43 6.54 6.68 6.75 6.82 6.92 7.04 7.08 7.05 7.29 Cyprus 5.80 5.53 5.53 6.04 6.41 6.51 6.52 6.98 6.87 7.63 7.55
- 63. 7.53 7.77 7.73 7.66 7.65 7.63 Czech Republic 5.84 6.53 6.56 6.67 6.84 6.89 6.92 6.91 7.14 7.17 7.09 7.13 7.17 Denmark 6.84 6.24 6.39 6.53 7.26 7.73 7.92 7.69 7.78 8.06 8.00 7.94 7.96 7.97 7.87 7.74 7.94 7.83 18 • Economic Freedom of the World: 2013 Annual Report Fraser Institute ©2013 • www.fraserinstitute.org • www.freetheworld.com Exhibit 1.5 (continued): Chain-linked summary ratings from 1970 to 2011 1970 1975 1980 1985 1990 1995 2000 2001 2002 2003 2004 2005 2006 2007 2008 2009 2010 2011 Dominican Republic 5.16 4.91 4.34 5.99 6.76 6.73 6.69 6.19 5.59 6.42 6.33 6.42 6.30 6.82 7.01 7.02 Ecuador 3.87 4.89 5.29 4.38 5.35 6.15 5.82 5.61 6.22 6.21 5.47 5.85 5.93 5.78 5.81 5.80 5.72 5.76 Egypt 3.59 4.40 4.86 4.60 5.99 6.81 6.60 6.22 6.10 6.08 6.59 6.72 6.97 6.79 6.69 6.79 6.65 El Salvador 4.57 4.29 4.80 7.65 7.57 7.52 7.45 7.49 7.50 7.54 7.66 7.73 7.63 7.40 7.29 7.22 Estonia 6.08 7.61 7.67 7.75 7.86 7.81 7.97 7.95 7.94 7.74 7.72 7.80 7.77
- 64. Fiji 5.28 5.58 5.98 5.73 6.12 6.24 6.12 6.17 6.14 6.13 6.54 6.49 6.49 6.54 6.42 6.39 6.37 Finland 6.82 6.16 6.65 6.92 7.24 7.50 7.73 7.61 7.63 7.95 7.87 7.97 7.87 7.91 7.81 7.79 7.91 7.99 France 6.63 5.93 6.09 5.99 7.07 7.02 7.31 6.97 7.14 7.38 7.39 7.38 7.38 7.58 7.49 7.47 7.49 7.45 Gabon 4.50 5.08 5.47 5.38 5.81 5.64 5.58 5.65 5.68 5.60 5.78 5.69 5.73 5.69 5.63 5.52 Germany 7.44 6.85 7.16 7.25 7.65 7.63 7.67 7.45 7.54 7.83 7.73 7.76 7.70 7.61 7.53 7.57 7.58 7.69 Ghana 3.64 3.05 3.20 5.06 5.53 5.66 5.78 6.14 6.40 6.36 6.49 6.99 7.00 6.80 7.02 6.89 6.83 Greece 6.33 5.86 5.76 5.14 5.99 6.44 6.91 6.79 6.99 7.32 7.26 7.31 7.27 7.33 6.92 6.79 6.88 6.77 Guatemala 5.98 6.46 5.87 4.68 5.62 6.96 6.57 6.62 6.80 6.91 6.84 7.15 7.26 7.28 7.17 7.16 7.13 7.14 Guinea-Bissau 3.24 3.45 4.43 4.84 4.89 5.10 4.97 5.20 5.50 5.19 5.24 5.66 5.68 5.75 Guyana 5.20 6.72 6.65 6.41 6.28 6.01 6.36 6.53 6.74 6.96 6.89 6.75 6.85 Haiti 6.51 5.76 5.61 5.59 6.89 6.60 6.56 6.67 6.75 6.77 6.75 6.72 6.88 6.99 6.70 6.82 Honduras 5.97 5.38 5.45 6.26 6.68 6.47 6.72 6.78 6.75 6.86 7.19 7.22 7.14 6.96 7.03 7.00
- 65. Hong Kong 8.69 8.71 9.02 8.63 8.59 9.14 8.86 8.81 8.77 8.82 8.76 8.95 8.96 9.03 9.07 9.00 8.92 8.87 Hungary 3.94 4.67 5.04 6.19 6.56 6.90 6.68 7.21 7.35 7.23 7.13 7.14 7.18 7.19 7.32 7.61 Iceland 6.13 4.40 5.25 5.53 6.95 7.69 8.04 7.93 7.91 8.05 8.01 8.09 7.96 7.84 7.15 7.02 7.05 7.33 India 5.36 4.50 5.35 5.02 5.05 5.80 6.32 6.16 6.39 6.50 6.40 6.89 6.68 6.55 6.55 6.47 6.40 6.50 Indonesia 4.54 5.21 5.06 6.14 6.52 6.62 6.07 5.70 6.03 6.38 6.20 6.63 6.69 6.77 6.75 6.78 7.05 7.06 Iran 5.80 5.64 3.36 3.83 4.39 4.31 5.90 6.27 6.11 6.21 6.36 6.47 6.34 6.28 6.32 6.43 6.56 6.28 Ireland 6.79 5.97 6.47 6.54 7.13 8.29 8.20 8.01 8.06 8.05 8.11 8.41 8.26 8.20 7.82 7.67 7.78 7.82 Israel 4.58 3.87 3.48 4.03 4.66 6.04 6.77 6.70 7.20 7.20 7.14 7.37 7.25 7.26 7.22 7.13 7.31 7.27 Italy 5.98 5.17 5.37 5.57 6.60 6.66 7.36 7.20 7.29 7.15 7.18 7.33 7.23 6.85 6.76 6.72 6.79 6.81 Jamaica 3.92 4.85 5.48 6.65 7.57 7.34 7.38 7.36 7.48 7.63 7.61 7.45 7.26 7.26 7.10 7.23 Japan 6.78 6.38 6.88 7.05 7.58 7.50 7.90 7.51 7.46 7.88 7.77 7.79 7.75 7.74 7.65 7.50 7.58 7.48 Jordan 5.28 5.32 5.71 5.81 6.45 7.40 7.09 7.41 7.39 7.17 7.61 7.51 7.69 7.51 7.43 7.72 7.79
- 66. Kenya 4.80 4.63 4.80 5.29 5.43 5.89 6.72 6.80 6.81 6.96 6.59 7.24 7.11 7.05 6.67 6.90 6.90 6.84 Korea, South 5.39 5.26 5.49 5.54 6.31 6.67 6.79 7.10 7.15 7.27 7.31 7.26 7.44 7.47 7.26 7.18 7.28 7.30 Kuwait 4.99 6.85 5.46 6.93 7.07 7.49 7.58 7.59 7.48 7.46 7.57 7.73 7.47 7.48 7.50 7.30 Chapter 1: Economic Freedom of the World in 2011 • 19 www.freetheworld.com • www.fraserinstitute.org • Fraser Institute ©2013 Exhibit 1.5 (continued): Chain-linked summary ratings from 1970 to 2011 1970 1975 1980 1985 1990 1995 2000 2001 2002 2003 2004 2005 2006 2007 2008 2009 2010 2011 Latvia 5.28 6.96 6.97 7.34 7.18 7.15 7.30 7.43 7.36 7.26 7.11 7.02 7.19 Lithuania 5.31 6.60 6.55 6.96 6.97 6.90 6.96 7.05 7.13 7.00 7.02 7.14 7.18 Luxembourg 7.47 7.62 7.51 7.82 7.79 7.93 8.02 8.02 7.89 7.93 7.98 7.72 7.70 7.76 7.77 7.66 7.65 7.61 Madagascar 4.01 4.59 4.49 4.61 5.96 6.27 5.83 6.03 5.78 5.79 5.88 6.18 6.12 6.21 6.36 6.34 Malawi 5.17 4.62 4.96 5.40 4.57 4.95 5.17 5.23 5.64 5.33 5.16 5.34 5.63 5.91 5.99 6.05 6.09
- 67. Malaysia 6.51 6.29 6.94 7.00 7.40 7.62 6.79 6.39 6.58 6.66 6.69 6.99 6.91 6.98 6.71 6.76 7.03 7.05 Mali 5.41 5.73 4.81 5.11 5.22 6.19 5.94 5.59 6.06 5.87 6.03 6.34 6.37 6.04 6.14 6.07 6.03 Malta 5.50 5.28 5.48 6.92 6.76 6.73 6.84 6.53 7.45 7.68 7.51 7.81 7.60 7.58 7.62 7.59 Mauritius 4.80 4.73 6.12 6.06 7.55 7.60 7.38 7.20 7.11 6.97 7.57 7.41 7.95 8.04 7.93 7.95 8.01 Mexico 6.45 5.76 5.13 4.61 6.13 6.43 6.44 6.31 6.64 6.62 6.62 6.82 6.86 6.78 6.71 6.60 6.69 6.63 Morocco 5.65 5.07 4.45 5.20 5.18 6.28 6.14 6.14 6.13 6.32 6.15 6.37 6.21 6.33 6.34 6.35 6.44 6.51 Myanmar 4.50 4.15 3.13 3.80 3.67 3.44 3.09 3.19 3.67 3.63 3.93 3.40 3.52 3.69 3.79 3.70 Namibia 5.11 6.14 6.38 6.35 6.39 6.51 6.20 6.46 6.36 6.57 6.54 6.55 6.41 6.20 Nepal 5.49 5.01 5.11 5.15 5.87 5.88 5.83 5.51 5.51 6.18 6.40 6.02 5.88 5.69 5.80 5.92 Netherlands 7.04 6.55 7.23 7.28 7.60 7.95 8.21 7.91 7.94 7.88 7.83 7.92 7.84 7.84 7.78 7.63 7.64 7.76 New Zealand 6.32 5.69 6.35 6.21 7.82 8.84 8.52 8.39 8.52 8.56 8.56 8.56 8.26 8.50 8.41 8.36 8.37 8.51 Nicaragua 3.69 1.78 2.75 5.47 6.69 6.38 6.75 6.80 6.61 6.86 7.00 7.01 6.81 6.77 6.77 6.87
- 68. Niger 4.63 5.07 5.16 4.33 5.44 5.07 5.03 5.24 5.63 5.62 5.70 5.64 5.59 5.67 5.68 5.70 Nigeria 3.55 3.36 3.25 3.68 3.31 3.76 5.30 5.03 5.53 5.57 5.56 6.03 6.42 6.28 5.98 5.84 5.92 6.15 Norway 5.93 5.58 5.79 6.46 7.13 7.56 7.27 7.12 7.03 7.60 7.53 7.69 7.54 7.69 7.59 7.46 7.49 7.52 Oman 6.78 6.34 6.99 7.53 7.57 7.53 7.58 7.45 7.39 7.44 7.73 7.64 7.69 7.65 7.59 Pakistan 4.20 3.54 4.30 4.91 4.87 5.67 5.41 5.42 5.62 5.40 5.41 5.86 5.93 5.89 5.72 5.94 5.94 6.01 Panama 6.67 5.55 6.12 6.45 7.44 7.56 7.53 7.52 7.59 7.51 7.60 7.55 7.63 7.32 7.33 7.24 7.12 Papua New Guinea 5.89 6.06 6.37 5.83 5.80 5.74 5.69 5.75 6.16 6.14 6.37 6.44 6.53 6.60 6.62 Paraguay 5.68 4.82 5.60 6.53 6.44 6.47 6.32 6.27 6.14 6.36 6.33 6.30 6.44 6.50 6.59 6.65 Peru 4.42 3.54 3.90 2.61 3.97 6.50 7.30 7.29 7.29 7.30 7.23 7.30 7.33 7.33 7.44 7.44 7.51 7.55 Philippines 5.29 5.22 5.33 5.07 5.79 7.30 6.97 6.81 6.92 6.94 6.64 7.00 7.05 6.93 6.83 6.78 7.06 7.14 Poland 3.46 3.55 5.37 6.34 6.13 6.45 6.50 6.89 6.89 6.99 6.94 6.99 7.13 7.11 7.18 Portugal 5.89 3.73 5.53 5.37 6.25 7.46 7.55 7.41 7.64 7.63 7.65 7.43 7.49 7.46 7.36 7.18 7.16 7.43
- 69. Romania 4.39 4.31 3.81 5.27 5.24 5.83 6.19 6.17 7.08 6.82 7.33 7.00 7.17 7.14 7.18 Russia 4.43 5.15 5.14 5.62 5.73 5.91 6.08 6.09 6.25 6.32 6.25 6.33 6.35 Rwanda 5.02 3.78 5.40 5.51 5.85 5.64 5.62 5.93 6.25 6.52 6.86 6.89 7.38 7.38 20 • Economic Freedom of the World: 2013 Annual Report Fraser Institute ©2013 • www.fraserinstitute.org • www.freetheworld.com Exhibit 1.5 (continued): Chain-linked summary ratings from 1970 to 2011 1970 1975 1980 1985 1990 1995 2000 2001 2002 2003 2004 2005 2006 2007 2008 2009 2010 2011 Senegal 4.43 5.17 5.31 4.56 5.88 5.65 5.73 5.63 5.67 5.72 5.63 5.73 5.64 5.79 5.75 5.72 Sierra Leone 4.97 4.97 3.67 3.86 4.33 5.23 4.99 5.50 5.93 5.77 5.99 6.07 6.39 6.29 6.66 6.69 6.73 Singapore 7.61 7.41 7.76 8.00 8.59 8.90 8.61 8.51 8.74 8.68 8.58 8.73 8.64 8.65 8.62 8.60 8.60 8.60 Slovak Rep 5.55 6.20 6.53 6.55 6.92 7.47 7.64 7.54 7.55 7.59 7.49 7.43 7.47 Slovenia 5.15 6.72 6.91 6.87 6.97 6.93 6.95 7.02 7.02 7.08 7.04
- 70. 6.58 6.58 South Africa 6.30 5.71 5.85 5.49 5.50 6.57 7.08 7.05 7.04 7.20 7.02 7.00 6.94 6.95 6.67 6.61 6.87 6.93 Spain 6.41 5.85 6.10 6.08 6.57 7.25 7.54 7.26 7.31 7.72 7.65 7.60 7.55 7.52 7.44 7.22 7.32 7.50 Sri Lanka 4.77 4.95 4.81 6.07 6.16 6.12 6.08 6.26 6.05 6.21 6.39 6.20 6.02 6.12 6.27 6.42 Sweden 5.51 5.35 5.68 6.47 7.11 7.28 7.62 7.31 7.56 7.70 7.51 7.58 7.53 7.52 7.49 7.53 7.73 7.67 Switzerland 7.45 7.46 7.99 8.15 8.15 8.19 8.63 8.37 8.53 8.42 8.32 8.19 8.17 8.20 8.02 8.05 8.13 8.12 Syria 3.96 4.19 3.31 3.07 3.53 4.23 4.92 5.20 4.83 4.76 5.23 5.46 5.20 5.46 5.27 5.46 5.52 Taiwan 6.65 5.83 6.58 6.84 7.30 7.41 7.45 7.34 7.53 7.54 7.62 7.68 7.72 7.69 7.64 7.55 7.86 7.86 Tanzania 4.41 3.19 3.65 3.47 3.87 5.43 6.07 6.14 5.94 5.98 6.03 6.44 6.56 6.47 6.36 6.22 6.44 6.49 Thailand 6.05 6.01 6.09 6.17 6.83 7.18 6.51 6.16 6.63 6.68 6.56 6.68 6.80 6.80 6.78 6.70 6.66 6.60 Togo 4.07 5.15 5.73 5.46 5.81 5.99 6.16 5.93 5.76 6.00 6.09 5.70 5.71 5.75 5.85 5.90 Trinidad & Tobago 4.57 4.83 4.80 5.52 7.29 7.55 7.49 7.33 7.21 7.08 7.14 7.25 7.26 7.16 7.08 6.95 6.97 Tunisia 4.54 4.57 4.82 4.60 5.32 5.73 6.08 6.08 5.94 5.94 5.96
- 71. 6.02 6.36 6.35 6.29 6.27 6.22 6.26 Turkey 3.49 3.87 3.77 4.85 5.06 5.89 5.81 5.20 5.48 5.93 6.07 6.09 6.20 6.33 6.61 6.52 6.54 6.69 Uganda 3.14 2.82 2.86 5.15 7.00 6.94 7.08 7.18 7.10 7.31 7.48 7.61 7.57 7.51 7.57 7.38 Ukraine 3.39 4.56 4.69 5.32 5.22 5.43 5.74 5.87 5.84 5.80 5.83 5.83 6.09 United Arab Emirates 6.03 6.83 7.20 6.95 7.28 7.30 7.52 7.43 7.26 7.50 7.65 7.74 7.70 7.52 7.74 7.85 United Kingdom 5.98 5.92 6.57 7.53 8.08 8.20 8.50 8.38 8.41 8.52 8.38 8.38 8.25 8.15 8.08 7.95 7.94 7.97 United States 7.60 7.73 7.92 8.11 8.35 8.50 8.65 8.44 8.40 8.36 8.37 8.21 8.13 8.21 7.99 7.71 7.75 7.74 Uruguay 6.07 5.97 6.34 6.47 7.08 6.85 7.09 6.92 7.00 7.02 6.98 7.08 7.12 7.06 7.29 7.30 Venezuela 7.31 6.17 6.69 6.08 5.69 4.40 5.83 5.71 4.57 4.18 4.57 4.52 4.54 4.25 4.10 4.16 3.79 3.74 Zambia 4.00 4.60 3.54 3.09 4.76 6.90 6.75 6.78 7.02 7.08 7.37 7.55 7.71 7.69 7.71 7.72 7.62 Zimbabwe 4.57 4.51 4.83 5.77 4.60 3.64 3.63 3.71 3.24 2.88 2.94 3.19 4.50 4.56 4.40 4.50 Chapter 1: Economic Freedom of the World in 2011 • 21
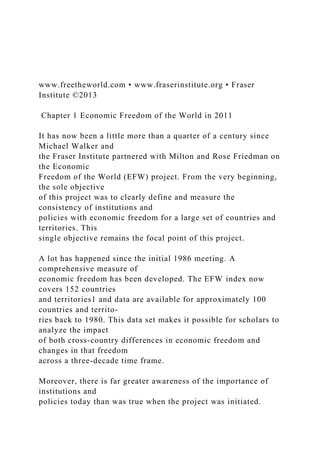
- 72. www.freetheworld.com • www.fraserinstitute.org • Fraser Institute ©2013 Economic freedom and human progress As is customary, this chapter concludes with some graphs illustrating simple rela- tionships between economic freedom and various other indicators of human and political progress. The graphs use the average of the chain- linked EFW index for the period from 2000 to 2011, breaking the data into four quartiles ordered from low to high. Because persistence is important and the impact of economic freedom will be felt over a lengthy time period, it is better to use the average rating over a fairly long time span rather than the current rating to observe the impact of economic freedom on performance. The graphs begin with the data on the relationship between economic freedom and the level of per-capita GDP and economic growth. In recent years, numerous scholarly studies have analyzed these relationships in detail and, almost without exception, have found that countries with higher and improving economic freedom grow more rapidly and achieve higher levels of per-capita GDP. Many of the relationships illustrated in the graphs below reflect the impact of economic freedom as it works through increasing economic growth. In other cases, the observed relationships may reflect the fact that some of the
- 73. variables that influ- ence economic freedom may also influence political factors like trust, honesty in government, and protection of civil liberties. Thus, we are not necessarily arguing that there is a direct causal relation between economic freedom and the variables considered below. In other words, these graphics are no substitute for real, scholarly investigation that controls for other factors. Nonetheless, we believe that the graphs provide some insights about the contrast between the nature and characteristics of market-oriented economies and those dominated by government regulation and planning. At the very least, these figures suggest what might be fruitful areas for future research. Exhibit 1.6: Economic Freedom and Income per Capita, 2011 0 5000 10000 15000 20000 25000 30000 35000
- 74. 40000 Most FreeSecondThirdLeast Free Countries with more economic freedom have substantially higher per-capita incomes. Sources: Fraser Institute, Economic Freedom of the World: 2013 Annual Report; World Bank, World Development Indicators 2013. $4,382 $8,523 $17,869 G D P p er c ap it
- 75. a, P PP (U S$ 20 11 ), 20 11 Economic Freedom Quartile $36,466 22 • Economic Freedom of the World: 2013 Annual Report Fraser Institute ©2013 • www.fraserinstitute.org • www.freetheworld.com Exhibit 1.9: Economic Freedom and the Income Earned by the Poorest 10%, 2011 0 2000 4000
- 76. 6000 8000 10000 12000 Most FreeSecondThirdLeast Free The amount of income, as opposed to the share, earned by the poorest 10% of the population is much higher in countries with higher economic freedom. Sources: Fraser Institute, Economic Freedom of the World: 2013 Annual Report; World Bank, World Development Indicators 2013. $932 $1,779 $3,792 A n n
- 78. 11 ), 20 11 Economic Freedom Quartile $10,556 Exhibit 1.8: Economic Freedom and the Income Share of the Poorest 10%, 2000–2011 0.0 0.5 1.0 1.5 2.0 2.5 3.0 Most FreeSecondThirdLeast Free The share of income earned by the poorest 10% of the population is unrelated to economic freedom.
- 79. Sources: Fraser Institute, Economic Freedom of the World: 2013 Annual Report; World Bank, World Development Indicators 2013. 2.57% 2.34% 2.28% In co m e Sh ar e (% ) Economic Freedom Quartile 2.76% Exhibit 1.7: Economic Freedom and Economic Growth, 1991– 2011 0.0 0.5
- 80. 1.0 1.5 2.0 2.5 3.0 3.5 4.0 Most FreeSecondThirdLeast Free Countries with more economic freedom tend to grow more rapidly. Sources: Fraser Institute, Economic Freedom of the World: 2013 Annual Report; World Bank, World Development Indicators 2013. Note: The growth data were adjusted to control for the initial level of income. 1.09% 2.81%
- 82. n u al % ), 19 91 –2 01 1 Economic Freedom Quartile 3.69% Chapter 1: Economic Freedom of the World in 2011 • 23 www.freetheworld.com • www.fraserinstitute.org • Fraser Institute ©2013 Exhibit 1.10: Economic Freedom and Life Expectancy, 2011 0 10 20 30
- 83. 40 50 60 70 80 90 Most FreeSecondThirdLeast Free Life expectancy is about 20 years longer in countries with the most economic freedom than in countries with the least. Sources: Fraser Institute, Economic Freedom of the World: 2013 Annual Report; World Bank, World Development Indicators 2013. 60.2 70.7 72.8 Li fe
- 84. e xp ec ta n cy a t b ir th , to ta l ( ye ar s) , 2 01 1 Economic Freedom Quartile 79.2
- 85. Exhibit 1.11: Economic Freedom and Political Rights and Civil Liberties 1 2 3 4 5 6 7 Most FreeSecondThirdLeast Free Greater economic freedom is associated with more political rights and civil liberties. Sources: Fraser Institute, Economic Freedom of the World: 2013 Annual Report; Freedom House, Freedom in the World 2012. Note: Political rights and civil liberties are measured on a scale from 1 to 7: 1 = the highest degree of political rights
- 86. and civil liberties; 7 = the lowest. 4.9 Po lit ic al R ig h ts a n d C iv il Li b er ti es Economic Freedom Quartile
- 87. 4 5 3 2 1 6 7 4.6 3.0 3.2 2.0 2.1 2.0 2.0 Pol Civ Pol Civ Pol Civ Pol Civ 24 • Economic Freedom of the World: 2013 Annual Report Fraser Institute ©2013 • www.fraserinstitute.org • www.freetheworld.com References Freedom House (2012). Freedom in the World 2012: The Arab Uprisings and Their Global Repercussions. <http://www.freedomhouse.org/report/freedom- world/freedom-world-2012>.
- 88. Gwartney, James, Randall Holcombe, and Robert Lawson (2006). Institutions and the Impact of Investment on Economic Growth. Kyklos 59, 2: 255–273. <http://onlinelibrary.wiley.com/doi/10.1111/j.1467- 6435.2006.00327.x/abstract>. Hall, Joshua, and Robert Lawson (2013). Economic Freedom of the World: An Accounting of the Literature. Contemporary Economic Policy. <http://onlinelibrary. wiley.com/doi/10.1111/coep.12010/abstract>. World Bank (2013). World Development Indicators 2013. < http://data.worldbank.org/ data-catalog/world-development-indicators>. Data available to researchers The full data set, including all of the data published in this report as well as data omit- ted due to limited space, can be downloaded for free at <http://www.freetheworld.com>. The data file available there contains the most up-to-date and accurate data for the Economic Freedom of the World index. Some variable names and data sources have evolved over the years since the first publication in 1996; users should consult earlier editions of Economic Freedom of the World for details regarding sources and descrip- tions for those years. All editions of the report are available in PDF and can be down- loaded for free at <http://www.freetheworld.com>. However, users are always strongly
- 89. encouraged to use the data from this most recent data file as updates and corrections, even to earlier years’ data, do occur. Users doing long-term or longitudinal studies are encouraged to use the chain-linked index as it is the most consistent through time. If you have difficulty downloading the data, please contact Fred McMahon via e-mail to <[email protected]>. If you have technical questions about the data itself, please contact Joshua Hall <[email protected]> or Robert Lawson <[email protected]>. Please cite the data in your bibliography as: Authors James Gwartney, Robert Lawson, and Joshua Hall Title 2013 Economic Freedom Dataset, published in Economic Freedom of the World: 2013 Annual Report Publisher Fraser Institute Year 2013 URL <http://www.freetheworld.com/datasets_efw.html>. Published work using ratings from Economic Freedom of the World A list of published papers that have used the economic freedom ratings from Economic Freedom of the World is available on line at <http://www.freetheworld.com/ papers.html>. In most cases, a brief abstract of the article is provided. If you know of other papers current or forthcoming that should be included on this page, or have further information about any of these papers or authors,
- 90. please write to <[email protected]>. http://data.worldbank.org/data-catalog/world-development- indicators http://data.worldbank.org/data-catalog/world-development- indicators paper must be typed, standard one inch margins, double- spaced using 12 point type, and be up to two pages in length. Pick a developing country you want to study. The first paper will evaluate the level of economic freedom in the country. In order to get an A or B on the paper, it must include economic analysis (use economic theory) to explain the issue and be well written. Papers that do not contain any economic analysis will receive a grade of C, at best. Poorly written papers without economic analysis will receive a grade of F. I do not accept late or electronic versions. Answer three questions in the paper. 1. First, what is economic freedom? 2. Second, why does it matter? 3. Third, what is the change in overall economic freedom over the last ten years for your country? List two strong and two weak components of economic freedom for the country you are examining.