Download as PDF, PPTX

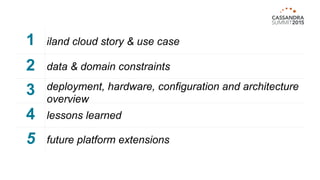
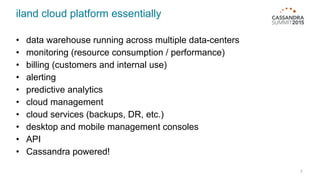
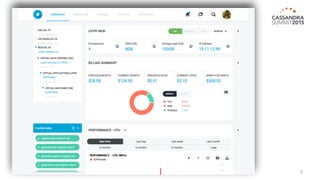
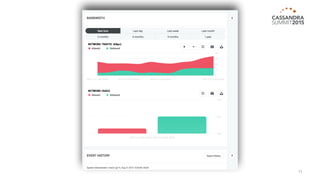
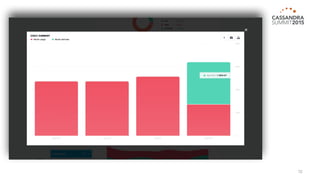
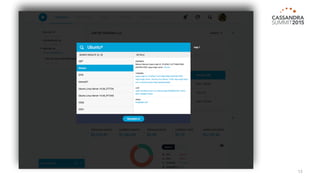
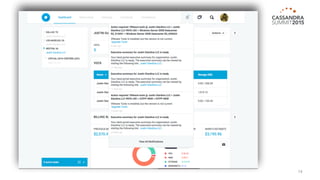
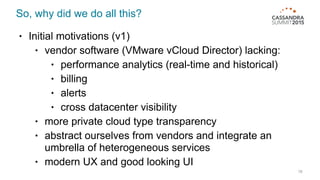


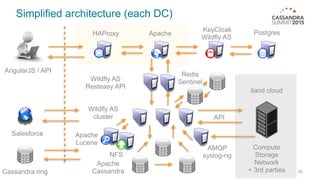
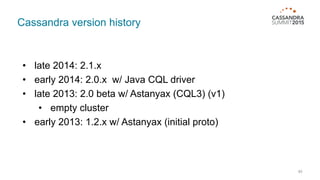
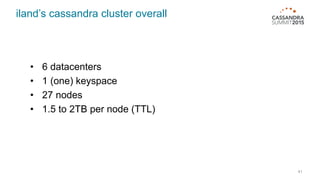
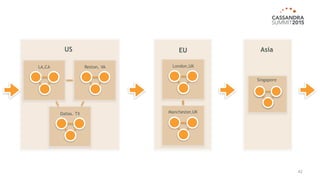

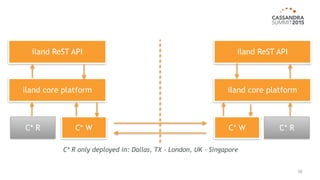


The document outlines iland's cloud platform utilizing Cassandra for real-time multi-data center analytics, detailing its architecture, deployment, and various lessons learned during implementation. Key points include the platform's capabilities for monitoring, billing, and predictive analytics, as well as the challenges faced in performance tuning and data management. Future extensions are discussed, with a focus on using new technologies like Spark for enhanced data processing and compliance.