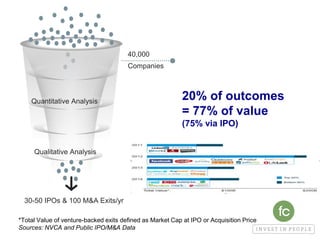
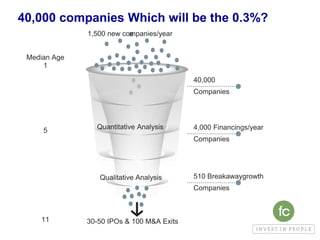
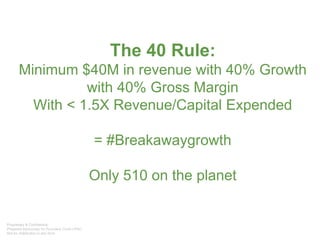
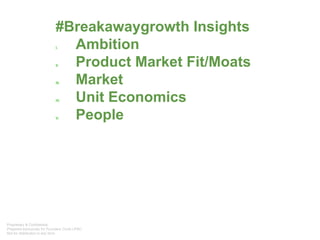
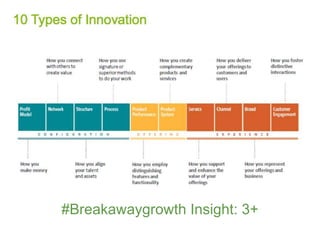
This document provides insights from Chris Albinson of Founders Circle Capital on identifying "breakaway growth" companies. It discusses how only 0.3% of startups become highly successful, achieving billions in value. It outlines Founders Circle's methodology for quantitatively and qualitatively analyzing companies to identify the few that will achieve breakaway growth. Key factors discussed include ambition, product-market fit, market opportunity, unit economics, and quality of the management team. The document also provides a case study analysis of Snap Inc. based on Founders Circle's framework.


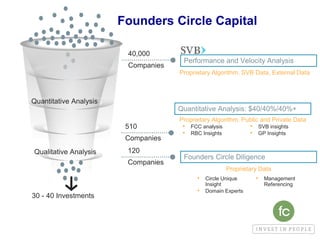


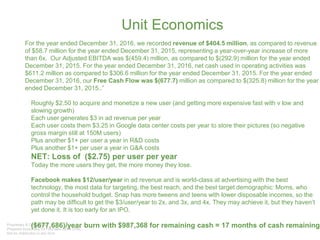
![Founders Circle Filter
Capital Efficiency of Growth
• Revenue over $40M – GOOD [$404]
• Revenue growth over 40% - GOOD [
600%]
• GM over 40% - FAIL [ (12%)]
• Revenue/Capital Expended – FAIL [ 2.9X
1.2B/$0.4]
• FAIL](https://image.slidesharecdn.com/gq47hf6qiapimm3g0l9i-signature-ad03765ae742697665284b0ce9416efafe3a9087981abd69d62f77c3727bfa76-poli-170213175958/85/Lessons-From-the-0-3-Highest-Performing-Private-Companies-42-320.jpg)