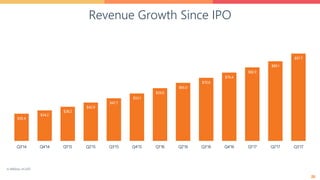
- HubSpot reported Q3 2017 results, with revenue growth of 22% year-over-year to $82.3 million.
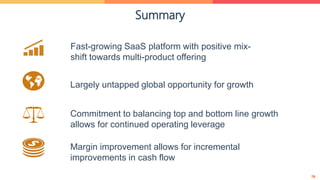
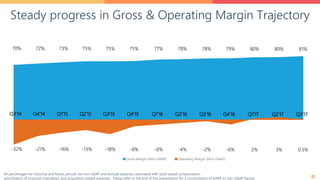
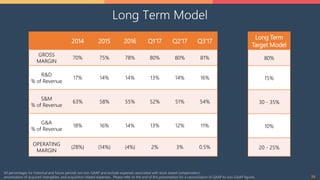
- The company discussed its continued focus on balancing revenue growth and margin improvement, with gross margins increasing to 81% in Q3 2017.
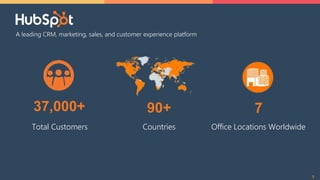
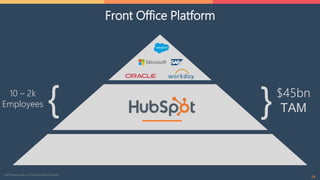
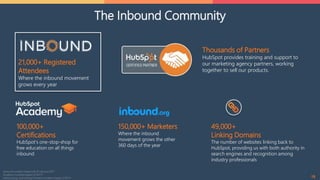
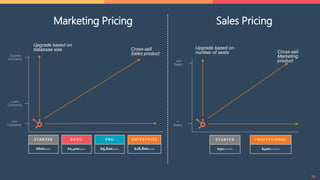
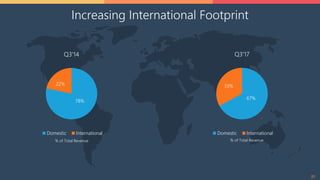
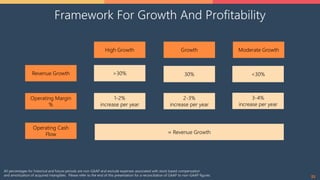
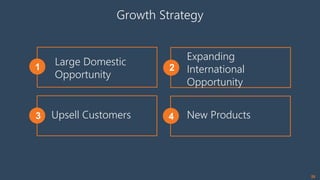
- HubSpot reiterated its commitment to its growth strategy, which includes expanding its product offerings, growing its international business, upselling existing customers, and tapping into the large market opportunity for its inbound platform.


![[ls머트리얼즈]LS Materials 417200 Algorithm Investment Report](https://cdn.slidesharecdn.com/ss_thumbnails/lsmaterials417200algorithminvestmentreport-260202182715-66072c7b-thumbnail.jpg?width=640&height=640&fit=bounds)