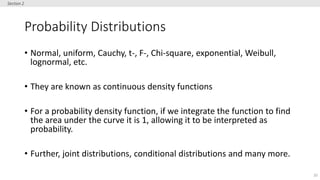
CS639:
Data Management for
Data Science
Lecture 2: Statistical Inference and Exploratory Data Analysis
Theodoros Rekatsinas
1
2
Announcements
• Waiting list: you receive invitations to register and
you have two days to reply.
• Piazza: you need to register to engage in discussions
and receive announcements
• Announcements: updated class website;
announcements will be posted there
3
First assignment (P0)
• Create a GitHub account and clone the github
repository of the class.
• Deploy the class VM (instructions in the slides of
Lecture 1)
Today’s Lecture
1. Quick Recap: The data science workflow
2. Statistical Inference
3. Exploratory Data Analysis
• Activity: EDA in Jupyter notebook
4
1. Quick Recap: The DS Workflow
5
Section 1
One definition of data science
6
Section 2
Data science is a broad field that refers to the collective
processes, theories, concepts, tools and technologies that
enable the review, analysis and extraction of valuable
knowledge and information from raw data.
Source: Techopedia
Data science workflow
7
Section 2
https://cacm.acm.org/blogs/blog-cacm/169199-data-science-
workflow-overview-and-challenges/fulltext
What is wrong here?
Data science workflow
8
Section 2
Data science is
not (only) about hacking!
9
Your mind-set should
be “statistical thinking
in the age of big-data”
2. Statistical Inference
10
Section 2
What you will learn about in this section
1. Uncertainty and Randomness in Data
2. Modeling Data
3. Samples and Distributions
11
Section 2
• Data represents the traces of real-world processes.
• The collected traces correspond to a sample of those processes.
• There is randomness and uncertainty in the data collection process.
• The process that generates the data is stochastic (random).
• Example: Let’s toss a coin! What will the outcome be? Heads or tails? There are
many factors that make a coin toss a stochastic process.
• The sampling process introduces uncertainty.
• Example: Errors due to sensor position due to error in GPS, errors due to the angles
of laser travel etc.
12
Section 2
Uncertainty and Randomness
• Data represents the traces of real-world processes.
• Part of the data science process: We need to model the real-world.
• A model is a function fθ(x)
• x: input variables (can be a vector)
• θ: model parameters
13
Section 2
Models
• Data represents the traces of real-world processes.
• There is randomness and uncertainty in the data collection process.
• A model is a function fθ(x)
• x: input variables (can be a vector)
• θ: model parameters
• Models should rely on probability theory to capture uncertainty and
randomness!
14
Section 2
Modeling Uncertainty and Randomness
15
Section 2
Modeling Example
16
Section 2
Modeling Example
The model
corresponds to a
linear function
17
Section 2
Population and Samples
• Population is complete set of traces/data points.
• US population 314 Million, world population is 7 billion for example
• All voters, all things
• Sample is a subset of the complete set (or population).
• How we select the sample introduces biases into the data
• Population sample  mathematical model
18
Section 2
Population and Samples
• Example: Emails sent by people in the CS dept. in a year.
• Method 1: 1/10 of all emails over the year randomly chosen
• Method 2: 1/10 of people randomly chosen; all their email over the year
• Both are reasonable sample selection method for analysis.
• However estimations pdfs (probability distribution functions) of the emails
sent by a person for the two samples will be different.
19
Section 2
Back to Models
• Abstraction of a real world process
• How to build a model?
• Probability distribution functions (pdfs) are building blocks of
statistical models.
20
Section 2
Probability Distributions
• Normal, uniform, Cauchy, t-, F-, Chi-square, exponential, Weibull,
lognormal, etc.
• They are known as continuous density functions
• For a probability density function, if we integrate the function to find
the area under the curve it is 1, allowing it to be interpreted as
probability.
• Further, joint distributions, conditional distributions and many more.
21
Section 2
Fitting a Model
• Fitting a model means estimating the parameters of the model.
• What distribution, what are the values of min, max, mean, stddev, etc.
• It involves algorithms such as maximum likelihood estimation (MLE)
and optimization methods.
• Example: y = β1+β2∗𝑥  y = 7.2 + 4.5*x
3. Exploratory Data Analysis
22
Section 3
What you will learn about in this section
1. Intro to Exploratory Data Analysis (EDA)
2. Activity: EDA in Jupyter
23
Section 3
24
Section 3
Activity
• Notebook link provided on website.

Lecture_2_Stats.pdf

  • 1.
    CS639: Data Management for DataScience Lecture 2: Statistical Inference and Exploratory Data Analysis Theodoros Rekatsinas 1
  • 2.
    2 Announcements • Waiting list:you receive invitations to register and you have two days to reply. • Piazza: you need to register to engage in discussions and receive announcements • Announcements: updated class website; announcements will be posted there
  • 3.
    3 First assignment (P0) •Create a GitHub account and clone the github repository of the class. • Deploy the class VM (instructions in the slides of Lecture 1)
  • 4.
    Today’s Lecture 1. QuickRecap: The data science workflow 2. Statistical Inference 3. Exploratory Data Analysis • Activity: EDA in Jupyter notebook 4
  • 5.
    1. Quick Recap:The DS Workflow 5 Section 1
  • 6.
    One definition ofdata science 6 Section 2 Data science is a broad field that refers to the collective processes, theories, concepts, tools and technologies that enable the review, analysis and extraction of valuable knowledge and information from raw data. Source: Techopedia
  • 7.
    Data science workflow 7 Section2 https://cacm.acm.org/blogs/blog-cacm/169199-data-science- workflow-overview-and-challenges/fulltext What is wrong here?
  • 8.
    Data science workflow 8 Section2 Data science is not (only) about hacking!
  • 9.
    9 Your mind-set should be“statistical thinking in the age of big-data”
  • 10.
  • 11.
    What you willlearn about in this section 1. Uncertainty and Randomness in Data 2. Modeling Data 3. Samples and Distributions 11 Section 2
  • 12.
    • Data representsthe traces of real-world processes. • The collected traces correspond to a sample of those processes. • There is randomness and uncertainty in the data collection process. • The process that generates the data is stochastic (random). • Example: Let’s toss a coin! What will the outcome be? Heads or tails? There are many factors that make a coin toss a stochastic process. • The sampling process introduces uncertainty. • Example: Errors due to sensor position due to error in GPS, errors due to the angles of laser travel etc. 12 Section 2 Uncertainty and Randomness
  • 13.
    • Data representsthe traces of real-world processes. • Part of the data science process: We need to model the real-world. • A model is a function fθ(x) • x: input variables (can be a vector) • θ: model parameters 13 Section 2 Models
  • 14.
    • Data representsthe traces of real-world processes. • There is randomness and uncertainty in the data collection process. • A model is a function fθ(x) • x: input variables (can be a vector) • θ: model parameters • Models should rely on probability theory to capture uncertainty and randomness! 14 Section 2 Modeling Uncertainty and Randomness
  • 15.
  • 16.
    16 Section 2 Modeling Example Themodel corresponds to a linear function
  • 17.
    17 Section 2 Population andSamples • Population is complete set of traces/data points. • US population 314 Million, world population is 7 billion for example • All voters, all things • Sample is a subset of the complete set (or population). • How we select the sample introduces biases into the data • Population sample  mathematical model
  • 18.
    18 Section 2 Population andSamples • Example: Emails sent by people in the CS dept. in a year. • Method 1: 1/10 of all emails over the year randomly chosen • Method 2: 1/10 of people randomly chosen; all their email over the year • Both are reasonable sample selection method for analysis. • However estimations pdfs (probability distribution functions) of the emails sent by a person for the two samples will be different.
  • 19.
    19 Section 2 Back toModels • Abstraction of a real world process • How to build a model? • Probability distribution functions (pdfs) are building blocks of statistical models.
  • 20.
    20 Section 2 Probability Distributions •Normal, uniform, Cauchy, t-, F-, Chi-square, exponential, Weibull, lognormal, etc. • They are known as continuous density functions • For a probability density function, if we integrate the function to find the area under the curve it is 1, allowing it to be interpreted as probability. • Further, joint distributions, conditional distributions and many more.
  • 21.
    21 Section 2 Fitting aModel • Fitting a model means estimating the parameters of the model. • What distribution, what are the values of min, max, mean, stddev, etc. • It involves algorithms such as maximum likelihood estimation (MLE) and optimization methods. • Example: y = β1+β2∗𝑥  y = 7.2 + 4.5*x
  • 22.
    3. Exploratory DataAnalysis 22 Section 3
  • 23.
    What you willlearn about in this section 1. Intro to Exploratory Data Analysis (EDA) 2. Activity: EDA in Jupyter 23 Section 3
  • 24.
    24 Section 3 Activity • Notebooklink provided on website.