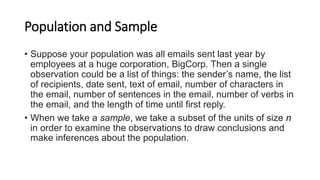
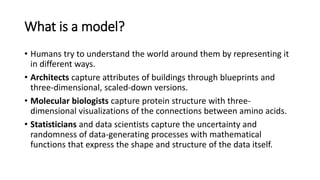
SlideShare a Scribd company logo
1 of 18
Statistical Inference
Statistical Inference Scenario
• Data Generation
• The world we live in is complex, random, and uncertain. At the same
time, it’s one big data-generating machine.
• As we commute to work on subways and in cars, as our blood moves
through our bodies, as we’re shopping, emailing, procrastinating at
work by browsing the Internet and watching the stock market, as
we’re building things, eating things, talking to our friends and family
about things, while factories are producing products, this all at least
potentially produces data.
Data Collection and Sampling methods
• Imagine spending 24 hours looking out the window, and for every
minute, counting and recording the number of people who pass by.
Or gathering up everyone who lives within a mile of your house and
making them tell you how many email messages they receive every
day for the next year. Imagine heading over to your local hospital and
rummaging around in the blood samples looking for patterns in the
DNA. That all sounded creepy, but it wasn’t supposed to. The point
here is that the processes in our lives are actually data-generating
processes.
Roles of data scientist
• We’d like ways to describe, understand, and make sense of these
processes, in part because as scientists we just want to understand
the world better, but many times, understanding these processes is
part of the solution to problems we’re trying to solve.
• Data represents the traces of the real-world processes, and exactly
which traces we gather are decided by our data collection or sampling
method.
• You, the data scientist, the observer, are turning the world into data.
Challenges in Data interpretation
• Once you have all this data, you have somehow captured the world,
or certain traces of the world. But you can’t go walking around with a
huge Excel spreadsheet or database of millions of transactions and
look at it and, with a snap of a finger, understand the world and
process that generated it.
• Simplification through Mathematical models
• So you need a new idea, and that’s to simplify those captured traces
into something more comprehensible, to something that somehow
captures it all in a much more concise way, and that something could
be mathematical models or functions of the data, known as statistical
estimators.
Statistical Inference Def and importance
• This overall process of going from the world to the data, and then
from the data back to the world, is the field of statistical inference.
• More precisely, statistical inference is the discipline that concerns
itself with the development of procedures, methods, and theorems
that allow us to extract meaning and information from data that has
been generated by stochastic (random) processes.
Statistical inference is the process of drawing conclusions or making
predictions about a population based on data from a sample. In other
words, it is a set of methods used to make inferences about an entire
population based on a smaller subset of the population (the sample).
Applications Statistical Inference
• Statistical inference is widely used in many fields, including
science, engineering, economics, and social sciences, among
others. It plays a critical role in making informed decisions and
drawing meaningful conclusions from data.
Population and Sample
• In classical statistical literature, a distinction is made between the
population and the sample. The word population immediately makes
us think of the entire Pakistani population of 220 million people, or
the entire world’s population of 7 billion people.
• But put that image out of your head, because in statistical inference
population isn’t used to simply describe only people. It could be any
set of objects or units, such as tweets or photographs or stars.
• If we could measure the characteristics or extract characteristics of
all
those objects, we’d have a complete set of observations, and the
convention is to use N to represent the total number of observations
in
the population.
Population and Sample
• Suppose your population was all emails sent last year by
employees at a huge corporation, BigCorp. Then a single
observation could be a list of things: the sender’s name, the list
of recipients, date sent, text of email, number of characters in
the email, number of sentences in the email, number of verbs in
the email, and the length of time until first reply.
• When we take a sample, we take a subset of the units of size n
in order to examine the observations to draw conclusions and
make inferences about the population.
• In the BigCorp email example, you could make a list of all the
employees and select 1/10th of those people at random and
take all the email they ever sent, and that would be your
sample.
What is a model?
• Humans try to understand the world around them by representing it
in different ways.
• Architects capture attributes of buildings through blueprints and
three-dimensional, scaled-down versions.
• Molecular biologists capture protein structure with three-
dimensional visualizations of the connections between amino acids.
• Statisticians and data scientists capture the uncertainty and
randomness of data-generating processes with mathematical
functions that express the shape and structure of the data itself.
What is a model?
• A model is our attempt to understand and represent the nature of
reality through a particular lens, be it architectural, biological, or
mathematical.
• A model is an artificial construction where all extraneous detail has
been removed or abstracted. Attention must always be paid to these
abstracted details after a model has been analyzed to see what might
have been overlooked.
Statistical Modeling
• Statistical modeling is the use of mathematical models and statistical
assumptions to generate sample data and make predictions about
the real world. A statistical model is a collection of probability
distributions on a set of all possible outcomes of an experiment.
• Statistical modeling refers to the data science process of applying
statistical analysis to datasets. A statistical model is a mathematical
relationship between one or more random variables and other non-
random variables. The application of statistical modeling to raw data
helps data scientists approach data analysis in a strategic manner,
providing intuitive visualizations that aid in identifying relationships
between variables and making predictions.
Statistical Modeling
• Common data sets for statistical analysis include Internet of
Things (IoT) sensors, census data, public health data, social
media data, imagery data, and other public sector data that
benefit from real-world predictions.
Probability
• Probability denotes the possibility of something happening. It is a
mathematical concept that predicts how likely events are to occur.
The probability values are expressed between 0 and 1. The definition
of probability is the degree to which something is likely to occur. This
fundamental theory of probability is also applied to probability
distributions.
Probability Distribution
• Probability distribution yields the possible outcomes for any random
event. It is also defined based on the underlying sample space as a set
of possible outcomes of any random experiment. These settings could
be a set of real numbers or a set of vectors or a set of any entities. It
is a part of probability and statistics.
• A probability distribution is a table or an equation that links each
possible value that a random variable can assume with its probability
of occurrence.
Introduction to R
• R is a programming language created by statisticians for statistics,
specifically for working with data.
• used by business analysts, data analysts, data scientists, and
• scientists.
• R is unique in that it is not general purpose.
• statistical analysis and data visualization.
• Academics, scientists, and researchers use it to analyze the results of
experiments.
• businesses of all sizes and in every industry use it to extract insights
from the increasing amount of daily data they generate.

More Related Content

Similar to Statistical Inference for development statistical model.pptx

UNIT1-2.pptx
UNIT1-2.pptxUNIT1-2.pptx
UNIT1-2.pptxcsecem
 
Qt business statistics-lesson1-2013
Qt business statistics-lesson1-2013Qt business statistics-lesson1-2013
Qt business statistics-lesson1-2013sonu kumar
 
Data Analysis in Research: Descriptive Statistics & Normality
Data Analysis in Research: Descriptive Statistics & NormalityData Analysis in Research: Descriptive Statistics & Normality
Data Analysis in Research: Descriptive Statistics & NormalityIkbal Ahmed
 
ONS Guide to Social and Economic Research – Welsh Baccalaureate Teacher Training
ONS Guide to Social and Economic Research – Welsh Baccalaureate Teacher TrainingONS Guide to Social and Economic Research – Welsh Baccalaureate Teacher Training
ONS Guide to Social and Economic Research – Welsh Baccalaureate Teacher TrainingOffice for National Statistics
 
Introduction to Statistics
Introduction to StatisticsIntroduction to Statistics
Introduction to StatisticsMoonWeryah
 
Analysing a Complex Agent-Based Model Using Data-Mining Techniques
Analysing a Complex Agent-Based Model  Using Data-Mining TechniquesAnalysing a Complex Agent-Based Model  Using Data-Mining Techniques
Analysing a Complex Agent-Based Model Using Data-Mining TechniquesBruce Edmonds
 
Introduction to biostatistics
Introduction to biostatisticsIntroduction to biostatistics
Introduction to biostatisticsAli Al Mousawi
 
classIX_DS_Teacher_Presentation.pptx
classIX_DS_Teacher_Presentation.pptxclassIX_DS_Teacher_Presentation.pptx
classIX_DS_Teacher_Presentation.pptxXICSStudents
 
Causal networks, learning and inference - Introduction
Causal networks, learning and inference - IntroductionCausal networks, learning and inference - Introduction
Causal networks, learning and inference - IntroductionFabio Stella
 
Analysing & interpreting data.ppt
Analysing & interpreting data.pptAnalysing & interpreting data.ppt
Analysing & interpreting data.pptmanaswidebbarma1
 
Chapter-1 - Notes.pptx
Chapter-1 - Notes.pptxChapter-1 - Notes.pptx
Chapter-1 - Notes.pptxDATASCIENCE41
 

Similar to Statistical Inference for development statistical model.pptx (20)

Statistics
StatisticsStatistics
Statistics
 
UNIT1-2.pptx
UNIT1-2.pptxUNIT1-2.pptx
UNIT1-2.pptx
 
Introduction to data science
Introduction to data scienceIntroduction to data science
Introduction to data science
 
Qt business statistics-lesson1-2013
Qt business statistics-lesson1-2013Qt business statistics-lesson1-2013
Qt business statistics-lesson1-2013
 
Lecture #01
Lecture #01Lecture #01
Lecture #01
 
Data collection, Data Integration, Data Understanding e Data Cleaning & Prepa...
Data collection, Data Integration, Data Understanding e Data Cleaning & Prepa...Data collection, Data Integration, Data Understanding e Data Cleaning & Prepa...
Data collection, Data Integration, Data Understanding e Data Cleaning & Prepa...
 
Sampaling
SampalingSampaling
Sampaling
 
Data Analysis in Research: Descriptive Statistics & Normality
Data Analysis in Research: Descriptive Statistics & NormalityData Analysis in Research: Descriptive Statistics & Normality
Data Analysis in Research: Descriptive Statistics & Normality
 
Data literacy
Data literacyData literacy
Data literacy
 
ONS Guide to Social and Economic Research – Welsh Baccalaureate Teacher Training
ONS Guide to Social and Economic Research – Welsh Baccalaureate Teacher TrainingONS Guide to Social and Economic Research – Welsh Baccalaureate Teacher Training
ONS Guide to Social and Economic Research – Welsh Baccalaureate Teacher Training
 
Introduction to Statistics
Introduction to StatisticsIntroduction to Statistics
Introduction to Statistics
 
Sensors1(1)
Sensors1(1)Sensors1(1)
Sensors1(1)
 
Statistics and data analysis
Statistics  and data analysisStatistics  and data analysis
Statistics and data analysis
 
Analysing a Complex Agent-Based Model Using Data-Mining Techniques
Analysing a Complex Agent-Based Model  Using Data-Mining TechniquesAnalysing a Complex Agent-Based Model  Using Data-Mining Techniques
Analysing a Complex Agent-Based Model Using Data-Mining Techniques
 
Introduction to biostatistics
Introduction to biostatisticsIntroduction to biostatistics
Introduction to biostatistics
 
classIX_DS_Teacher_Presentation.pptx
classIX_DS_Teacher_Presentation.pptxclassIX_DS_Teacher_Presentation.pptx
classIX_DS_Teacher_Presentation.pptx
 
Statistics
StatisticsStatistics
Statistics
 
Causal networks, learning and inference - Introduction
Causal networks, learning and inference - IntroductionCausal networks, learning and inference - Introduction
Causal networks, learning and inference - Introduction
 
Analysing & interpreting data.ppt
Analysing & interpreting data.pptAnalysing & interpreting data.ppt
Analysing & interpreting data.ppt
 
Chapter-1 - Notes.pptx
Chapter-1 - Notes.pptxChapter-1 - Notes.pptx
Chapter-1 - Notes.pptx
 

Recently uploaded

Software Engineering Methodologies (overview)
Software Engineering Methodologies (overview)Software Engineering Methodologies (overview)
Software Engineering Methodologies (overview)eniolaolutunde
 
1029-Danh muc Sach Giao Khoa khoi 6.pdf
1029-Danh muc Sach Giao Khoa khoi  6.pdf1029-Danh muc Sach Giao Khoa khoi  6.pdf
1029-Danh muc Sach Giao Khoa khoi 6.pdfQucHHunhnh
 
Holdier Curriculum Vitae (April 2024).pdf
Holdier Curriculum Vitae (April 2024).pdfHoldier Curriculum Vitae (April 2024).pdf
Holdier Curriculum Vitae (April 2024).pdfagholdier
 
Sanyam Choudhary Chemistry practical.pdf
Sanyam Choudhary Chemistry practical.pdfSanyam Choudhary Chemistry practical.pdf
Sanyam Choudhary Chemistry practical.pdfsanyamsingh5019
 
IGNOU MSCCFT and PGDCFT Exam Question Pattern: MCFT003 Counselling and Family...
IGNOU MSCCFT and PGDCFT Exam Question Pattern: MCFT003 Counselling and Family...IGNOU MSCCFT and PGDCFT Exam Question Pattern: MCFT003 Counselling and Family...
IGNOU MSCCFT and PGDCFT Exam Question Pattern: MCFT003 Counselling and Family...PsychoTech Services
 
Nutritional Needs Presentation - HLTH 104
Nutritional Needs Presentation - HLTH 104Nutritional Needs Presentation - HLTH 104
Nutritional Needs Presentation - HLTH 104misteraugie
 
SOCIAL AND HISTORICAL CONTEXT - LFTVD.pptx
SOCIAL AND HISTORICAL CONTEXT - LFTVD.pptxSOCIAL AND HISTORICAL CONTEXT - LFTVD.pptx
SOCIAL AND HISTORICAL CONTEXT - LFTVD.pptxiammrhaywood
 
Measures of Dispersion and Variability: Range, QD, AD and SD
Measures of Dispersion and Variability: Range, QD, AD and SDMeasures of Dispersion and Variability: Range, QD, AD and SD
Measures of Dispersion and Variability: Range, QD, AD and SDThiyagu K
 
APM Welcome, APM North West Network Conference, Synergies Across Sectors
APM Welcome, APM North West Network Conference, Synergies Across SectorsAPM Welcome, APM North West Network Conference, Synergies Across Sectors
APM Welcome, APM North West Network Conference, Synergies Across SectorsAssociation for Project Management
 
Student login on Anyboli platform.helpin
Student login on Anyboli platform.helpinStudent login on Anyboli platform.helpin
Student login on Anyboli platform.helpinRaunakKeshri1
 
Class 11th Physics NEET formula sheet pdf
Class 11th Physics NEET formula sheet pdfClass 11th Physics NEET formula sheet pdf
Class 11th Physics NEET formula sheet pdfAyushMahapatra5
 
BASLIQ CURRENT LOOKBOOK LOOKBOOK(1) (1).pdf
BASLIQ CURRENT LOOKBOOK  LOOKBOOK(1) (1).pdfBASLIQ CURRENT LOOKBOOK  LOOKBOOK(1) (1).pdf
BASLIQ CURRENT LOOKBOOK LOOKBOOK(1) (1).pdfSoniaTolstoy
 
Grant Readiness 101 TechSoup and Remy Consulting
Grant Readiness 101 TechSoup and Remy ConsultingGrant Readiness 101 TechSoup and Remy Consulting
Grant Readiness 101 TechSoup and Remy ConsultingTechSoup
 
Explore beautiful and ugly buildings. Mathematics helps us create beautiful d...
Explore beautiful and ugly buildings. Mathematics helps us create beautiful d...Explore beautiful and ugly buildings. Mathematics helps us create beautiful d...
Explore beautiful and ugly buildings. Mathematics helps us create beautiful d...christianmathematics
 
Arihant handbook biology for class 11 .pdf
Arihant handbook biology for class 11 .pdfArihant handbook biology for class 11 .pdf
Arihant handbook biology for class 11 .pdfchloefrazer622
 
Beyond the EU: DORA and NIS 2 Directive's Global Impact
Beyond the EU: DORA and NIS 2 Directive's Global ImpactBeyond the EU: DORA and NIS 2 Directive's Global Impact
Beyond the EU: DORA and NIS 2 Directive's Global ImpactPECB
 
Advanced Views - Calendar View in Odoo 17
Advanced Views - Calendar View in Odoo 17Advanced Views - Calendar View in Odoo 17
Advanced Views - Calendar View in Odoo 17Celine George
 
fourth grading exam for kindergarten in writing
fourth grading exam for kindergarten in writingfourth grading exam for kindergarten in writing
fourth grading exam for kindergarten in writingTeacherCyreneCayanan
 

Recently uploaded (20)

Software Engineering Methodologies (overview)
Software Engineering Methodologies (overview)Software Engineering Methodologies (overview)
Software Engineering Methodologies (overview)
 
1029-Danh muc Sach Giao Khoa khoi 6.pdf
1029-Danh muc Sach Giao Khoa khoi  6.pdf1029-Danh muc Sach Giao Khoa khoi  6.pdf
1029-Danh muc Sach Giao Khoa khoi 6.pdf
 
Holdier Curriculum Vitae (April 2024).pdf
Holdier Curriculum Vitae (April 2024).pdfHoldier Curriculum Vitae (April 2024).pdf
Holdier Curriculum Vitae (April 2024).pdf
 
Sanyam Choudhary Chemistry practical.pdf
Sanyam Choudhary Chemistry practical.pdfSanyam Choudhary Chemistry practical.pdf
Sanyam Choudhary Chemistry practical.pdf
 
IGNOU MSCCFT and PGDCFT Exam Question Pattern: MCFT003 Counselling and Family...
IGNOU MSCCFT and PGDCFT Exam Question Pattern: MCFT003 Counselling and Family...IGNOU MSCCFT and PGDCFT Exam Question Pattern: MCFT003 Counselling and Family...
IGNOU MSCCFT and PGDCFT Exam Question Pattern: MCFT003 Counselling and Family...
 
Nutritional Needs Presentation - HLTH 104
Nutritional Needs Presentation - HLTH 104Nutritional Needs Presentation - HLTH 104
Nutritional Needs Presentation - HLTH 104
 
INDIA QUIZ 2024 RLAC DELHI UNIVERSITY.pptx
INDIA QUIZ 2024 RLAC DELHI UNIVERSITY.pptxINDIA QUIZ 2024 RLAC DELHI UNIVERSITY.pptx
INDIA QUIZ 2024 RLAC DELHI UNIVERSITY.pptx
 
SOCIAL AND HISTORICAL CONTEXT - LFTVD.pptx
SOCIAL AND HISTORICAL CONTEXT - LFTVD.pptxSOCIAL AND HISTORICAL CONTEXT - LFTVD.pptx
SOCIAL AND HISTORICAL CONTEXT - LFTVD.pptx
 
Measures of Dispersion and Variability: Range, QD, AD and SD
Measures of Dispersion and Variability: Range, QD, AD and SDMeasures of Dispersion and Variability: Range, QD, AD and SD
Measures of Dispersion and Variability: Range, QD, AD and SD
 
APM Welcome, APM North West Network Conference, Synergies Across Sectors
APM Welcome, APM North West Network Conference, Synergies Across SectorsAPM Welcome, APM North West Network Conference, Synergies Across Sectors
APM Welcome, APM North West Network Conference, Synergies Across Sectors
 
Student login on Anyboli platform.helpin
Student login on Anyboli platform.helpinStudent login on Anyboli platform.helpin
Student login on Anyboli platform.helpin
 
Class 11th Physics NEET formula sheet pdf
Class 11th Physics NEET formula sheet pdfClass 11th Physics NEET formula sheet pdf
Class 11th Physics NEET formula sheet pdf
 
BASLIQ CURRENT LOOKBOOK LOOKBOOK(1) (1).pdf
BASLIQ CURRENT LOOKBOOK  LOOKBOOK(1) (1).pdfBASLIQ CURRENT LOOKBOOK  LOOKBOOK(1) (1).pdf
BASLIQ CURRENT LOOKBOOK LOOKBOOK(1) (1).pdf
 
Grant Readiness 101 TechSoup and Remy Consulting
Grant Readiness 101 TechSoup and Remy ConsultingGrant Readiness 101 TechSoup and Remy Consulting
Grant Readiness 101 TechSoup and Remy Consulting
 
Mattingly "AI & Prompt Design: The Basics of Prompt Design"
Mattingly "AI & Prompt Design: The Basics of Prompt Design"Mattingly "AI & Prompt Design: The Basics of Prompt Design"
Mattingly "AI & Prompt Design: The Basics of Prompt Design"
 
Explore beautiful and ugly buildings. Mathematics helps us create beautiful d...
Explore beautiful and ugly buildings. Mathematics helps us create beautiful d...Explore beautiful and ugly buildings. Mathematics helps us create beautiful d...
Explore beautiful and ugly buildings. Mathematics helps us create beautiful d...
 
Arihant handbook biology for class 11 .pdf
Arihant handbook biology for class 11 .pdfArihant handbook biology for class 11 .pdf
Arihant handbook biology for class 11 .pdf
 
Beyond the EU: DORA and NIS 2 Directive's Global Impact
Beyond the EU: DORA and NIS 2 Directive's Global ImpactBeyond the EU: DORA and NIS 2 Directive's Global Impact
Beyond the EU: DORA and NIS 2 Directive's Global Impact
 
Advanced Views - Calendar View in Odoo 17
Advanced Views - Calendar View in Odoo 17Advanced Views - Calendar View in Odoo 17
Advanced Views - Calendar View in Odoo 17
 
fourth grading exam for kindergarten in writing
fourth grading exam for kindergarten in writingfourth grading exam for kindergarten in writing
fourth grading exam for kindergarten in writing
 

Statistical Inference for development statistical model.pptx

  • 2. Statistical Inference Scenario • Data Generation • The world we live in is complex, random, and uncertain. At the same time, it’s one big data-generating machine. • As we commute to work on subways and in cars, as our blood moves through our bodies, as we’re shopping, emailing, procrastinating at work by browsing the Internet and watching the stock market, as we’re building things, eating things, talking to our friends and family about things, while factories are producing products, this all at least potentially produces data.
  • 3. Data Collection and Sampling methods • Imagine spending 24 hours looking out the window, and for every minute, counting and recording the number of people who pass by. Or gathering up everyone who lives within a mile of your house and making them tell you how many email messages they receive every day for the next year. Imagine heading over to your local hospital and rummaging around in the blood samples looking for patterns in the DNA. That all sounded creepy, but it wasn’t supposed to. The point here is that the processes in our lives are actually data-generating processes.
  • 4. Roles of data scientist • We’d like ways to describe, understand, and make sense of these processes, in part because as scientists we just want to understand the world better, but many times, understanding these processes is part of the solution to problems we’re trying to solve. • Data represents the traces of the real-world processes, and exactly which traces we gather are decided by our data collection or sampling method. • You, the data scientist, the observer, are turning the world into data.
  • 5. Challenges in Data interpretation • Once you have all this data, you have somehow captured the world, or certain traces of the world. But you can’t go walking around with a huge Excel spreadsheet or database of millions of transactions and look at it and, with a snap of a finger, understand the world and process that generated it. • Simplification through Mathematical models • So you need a new idea, and that’s to simplify those captured traces into something more comprehensible, to something that somehow captures it all in a much more concise way, and that something could be mathematical models or functions of the data, known as statistical estimators.
  • 6. Statistical Inference Def and importance • This overall process of going from the world to the data, and then from the data back to the world, is the field of statistical inference. • More precisely, statistical inference is the discipline that concerns itself with the development of procedures, methods, and theorems that allow us to extract meaning and information from data that has been generated by stochastic (random) processes. Statistical inference is the process of drawing conclusions or making predictions about a population based on data from a sample. In other words, it is a set of methods used to make inferences about an entire population based on a smaller subset of the population (the sample).
  • 7. Applications Statistical Inference • Statistical inference is widely used in many fields, including science, engineering, economics, and social sciences, among others. It plays a critical role in making informed decisions and drawing meaningful conclusions from data.
  • 8. Population and Sample • In classical statistical literature, a distinction is made between the population and the sample. The word population immediately makes us think of the entire Pakistani population of 220 million people, or the entire world’s population of 7 billion people. • But put that image out of your head, because in statistical inference population isn’t used to simply describe only people. It could be any set of objects or units, such as tweets or photographs or stars. • If we could measure the characteristics or extract characteristics of all those objects, we’d have a complete set of observations, and the convention is to use N to represent the total number of observations in the population.
  • 9. Population and Sample • Suppose your population was all emails sent last year by employees at a huge corporation, BigCorp. Then a single observation could be a list of things: the sender’s name, the list of recipients, date sent, text of email, number of characters in the email, number of sentences in the email, number of verbs in the email, and the length of time until first reply. • When we take a sample, we take a subset of the units of size n in order to examine the observations to draw conclusions and make inferences about the population.
  • 10. • In the BigCorp email example, you could make a list of all the employees and select 1/10th of those people at random and take all the email they ever sent, and that would be your sample.
  • 11. What is a model? • Humans try to understand the world around them by representing it in different ways. • Architects capture attributes of buildings through blueprints and three-dimensional, scaled-down versions. • Molecular biologists capture protein structure with three- dimensional visualizations of the connections between amino acids. • Statisticians and data scientists capture the uncertainty and randomness of data-generating processes with mathematical functions that express the shape and structure of the data itself.
  • 12. What is a model? • A model is our attempt to understand and represent the nature of reality through a particular lens, be it architectural, biological, or mathematical. • A model is an artificial construction where all extraneous detail has been removed or abstracted. Attention must always be paid to these abstracted details after a model has been analyzed to see what might have been overlooked.
  • 13. Statistical Modeling • Statistical modeling is the use of mathematical models and statistical assumptions to generate sample data and make predictions about the real world. A statistical model is a collection of probability distributions on a set of all possible outcomes of an experiment. • Statistical modeling refers to the data science process of applying statistical analysis to datasets. A statistical model is a mathematical relationship between one or more random variables and other non- random variables. The application of statistical modeling to raw data helps data scientists approach data analysis in a strategic manner, providing intuitive visualizations that aid in identifying relationships between variables and making predictions.
  • 14. Statistical Modeling • Common data sets for statistical analysis include Internet of Things (IoT) sensors, census data, public health data, social media data, imagery data, and other public sector data that benefit from real-world predictions.
  • 15. Probability • Probability denotes the possibility of something happening. It is a mathematical concept that predicts how likely events are to occur. The probability values are expressed between 0 and 1. The definition of probability is the degree to which something is likely to occur. This fundamental theory of probability is also applied to probability distributions.
  • 16. Probability Distribution • Probability distribution yields the possible outcomes for any random event. It is also defined based on the underlying sample space as a set of possible outcomes of any random experiment. These settings could be a set of real numbers or a set of vectors or a set of any entities. It is a part of probability and statistics. • A probability distribution is a table or an equation that links each possible value that a random variable can assume with its probability of occurrence.
  • 17.
  • 18. Introduction to R • R is a programming language created by statisticians for statistics, specifically for working with data. • used by business analysts, data analysts, data scientists, and • scientists. • R is unique in that it is not general purpose. • statistical analysis and data visualization. • Academics, scientists, and researchers use it to analyze the results of experiments. • businesses of all sizes and in every industry use it to extract insights from the increasing amount of daily data they generate.