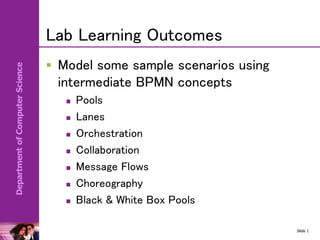
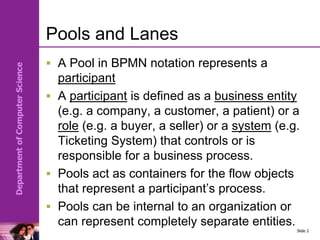
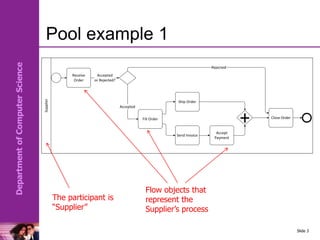
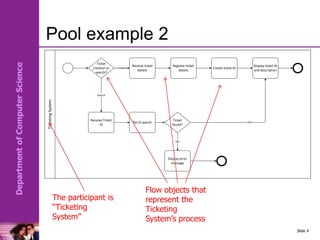
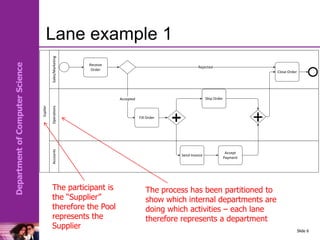
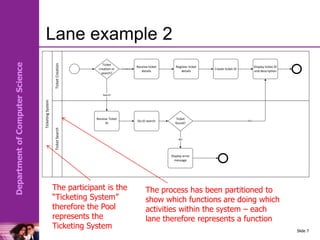
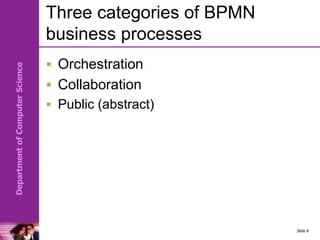
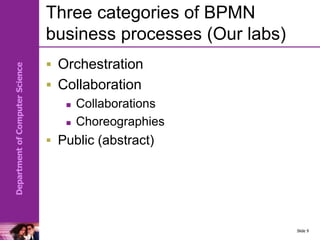
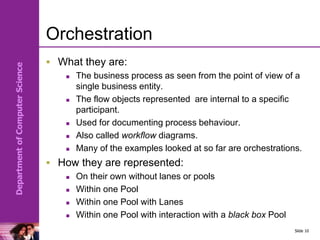
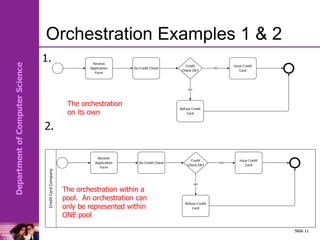
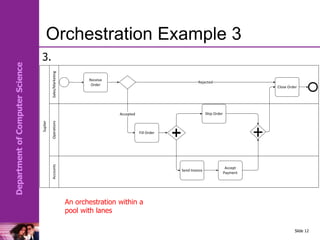
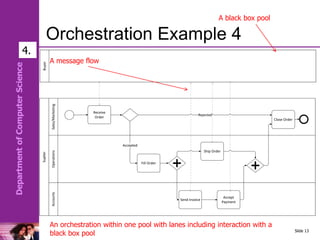
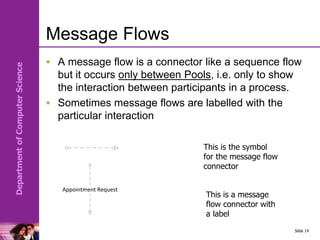
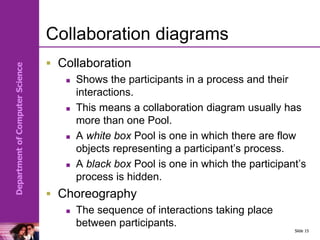
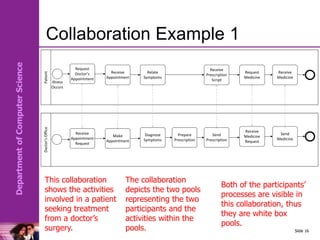
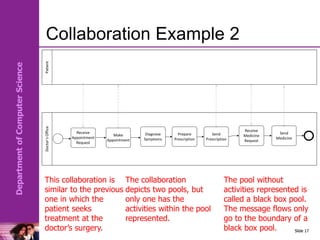
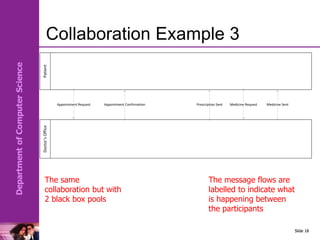
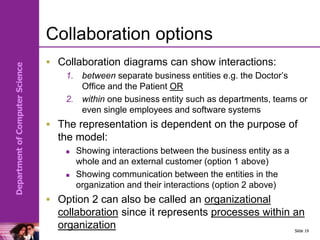
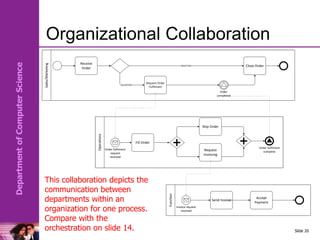
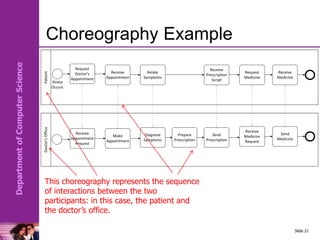
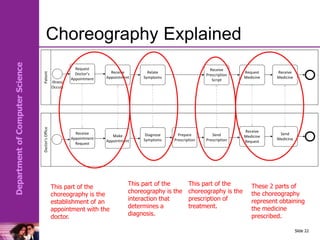
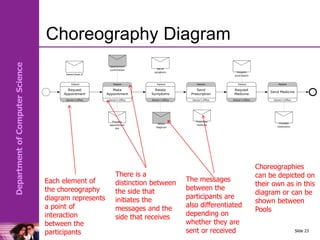
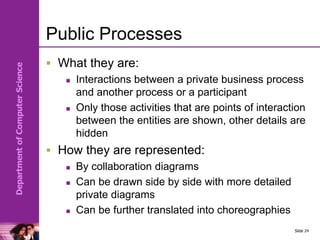
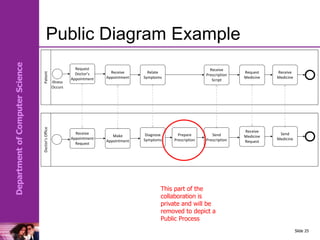
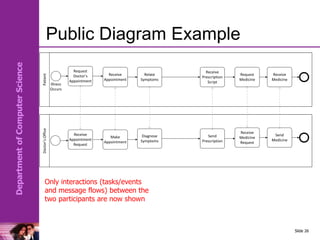
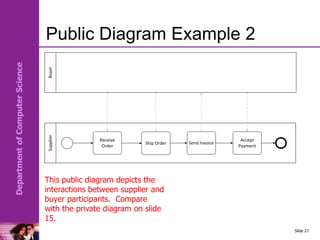
The document provides information on various BPMN modeling concepts including pools, lanes, orchestration, collaboration, choreography, and public processes. It includes examples and definitions of each concept. Pools represent participants, lanes partition pools, orchestration shows a single participant's internal process, collaboration shows interactions between multiple participants, choreography shows the sequence of interactions, and public processes show only interactions between private processes.
Here is an activity diagram for the document management process:
[DOCUMENT MANAGEMENT PROCESS]
Create Document -> Review Document -> [Approve?] -> Yes -> Archive Document | No -> Update Document -> Review Document
The activity starts with an author creating a document. The document is then sent to a reviewer for review. There is a decision point to determine if the document is approved. If approved, the document is archived. If not approved, the document goes back to the author for updates, and then back to the reviewer again for additional review.
Roles:
Author
Reviewer
Approver
Owner
Here is an activity diagram for the ticket vending machine process:
[TICKET
This document provides an overview of several ARIS modeling techniques including:
1. Process landscapes are used to structure a company's processes and usually include management, core, and support processes.
2. System landscapes describe which IT systems belong to logical units/domains for budgeting and responsibility purposes.
3. Data models represent a company's data view using entities, attributes, keys, and relationships.
4. Additional techniques covered include organizational charts, BPMN for workflows, and event-driven process chains.
This is the first BPMN poster, which was developed to facilitate learning of BPMN. It includes notation version 1.0 as well some patterns and anti-patterns of its use. It was primary developed on https://sourceforge.net/projects/itposter/
The document provides an overview of common graphical objects, notation, patterns and antipatterns in business process diagrams. It defines events, activities, artifacts, connecting objects like sequence flows and message flows. It also describes pools, lanes, gateways and other elements. Finally, it identifies several common mistakes made in business process diagrams like missing start/end events, incorrect use of flows within and between pools, and improperly positioned events.
This document provides definitions and guidelines for graphical objects and notation used in business process diagrams created using the Business Process Model and Notation (BPMN) standard. It defines common elements like events, activities, gateways, flows, pools, lanes and artifacts. It also describes common patterns and antipatterns to avoid when modeling processes with BPMN.
This document contains summaries of different modeling techniques including:
1. A structure diagram contains objects and connections to model organizational structures. It is often used as a starting point for various company views.
2. A process landscape structures a company's processes into management, core, and support processes to describe scenarios and refine process areas.
3. An event-driven process chain (EPC) models processes as a sequence of events, functions, and rules to describe activities, participants, data, systems, and risks.
4. A BPMN collaboration diagram models interactions between participants like in a business-to-business context using pools, message flows, gateways, and other elements.
5. A
The document discusses use case development, including the objectives, value, and process of developing use cases. It provides guidance on reviewing existing use cases, the key elements of use cases including name, description, actors, flows, and exceptions. The document uses examples to illustrate use case anatomy and best practices for writing use cases.
1) The document describes various symbols used in flowcharts such as rectangles, diamonds, circles, and arrows to represent processes, decisions, starts/ends, and flows.
2) There are three main types of flowcharts: sequence, selection, and iteration. Sequence flowcharts show a series of steps. Selection flowcharts show decision points. Iteration flowcharts show loops.
3) Micro flowcharts show greater detail of a process than macro flowcharts, which provide a higher-level view. The document provides examples of micro and macro flowcharts for a college admissions process.
The document discusses Business Process Model and Notation (BPMN), which is a standard graphical notation for drawing business processes. BPMN provides a notation that is readily understandable by all business stakeholders. It describes the core elements of BPMN including flow objects, events, activities, gateways, connection objects, data objects, and artifacts. It also discusses the different types of BPMN diagrams like process diagrams, collaboration diagrams, choreography diagrams, and conversation diagrams.
The document discusses business process modeling techniques. It provides an overview of process choreography, which defines how individual business processes interact. An example choreography diagram for a sales order process is shown. The document also covers event-driven process chains (EPCs), which model business processes as a chain of events and functions. An example EPC for a patient registration process at a clinic is included. Key elements of choreography diagrams and EPCs like tasks, messages, events, functions, and logical connectors are defined.
The document discusses use case modeling. It defines use cases as narrative descriptions of domain processes in a structured prose format. It describes key concepts like actors, scenarios, and the relationships between use cases such as include and extend. It provides guidelines for writing use cases, including identifying the system boundary, primary actors, and their goals to derive use cases. It also describes different styles and levels of detail for writing use cases.
The document provides information on the basic seven tools of quality: cause-and-effect diagrams, flowcharts, checklists, control charts, scatter diagrams, Pareto analysis, and histograms. It defines each tool and provides an example of some. Cause-and-effect diagrams help identify potential factors causing a problem or condition. Flowcharts show the sequence of steps in a process. Checklists identify quality problems. Control charts show if a process is in or out of control. Scatter diagrams illustrate relationships between variables. Pareto analysis separates vital few causes from trivial many. Histograms show the variation in data.
The document discusses scenarios and use cases for a workshop on scenarios and use cases. It includes an agenda for the workshop with times allocated for explaining scenarios and use cases, working in groups to develop scenarios and use cases, and presenting them. It also provides examples of scenarios involving a chemistry professor monitoring student progress and communicating with students. Guidelines are given for defining personas, scenarios, and use cases.
This document discusses data flow diagrams and modeling processes at different levels of abstraction. It provides examples of typical processes like computations, decisions, data manipulation, and triggering other processes. It then gives an example data flow diagram of a patient monitoring system to illustrate modeling a system at three different levels - showing more detail at each lower level. Finally, it discusses some common mistakes in data flow diagrams like missing inputs/outputs and irrelevant inputs not corresponding to the outputs.
The process approach (and business process management)Nicola Mezzetti
The document discusses the process approach and business process management. It defines a process as a set of interrelated activities that use inputs to produce an intended result. The process approach involves managing activities as interrelated processes to achieve consistent results efficiently. Key aspects of the process approach include establishing processes as an integrated system, defining activities and checks to deliver outputs, and using risk-based thinking. The document also discusses business process modeling notation (BPMN) for graphically representing business processes using elements like events, activities, gateways, sequence flows, and pools.
SE2018_Lec 14_ Process Modeling and Data Flow Diagram.pptxAmr E. Mohamed
The document discusses process modeling and data flow diagrams (DFDs). It begins by defining a system as consisting of inputs, outputs, and a process within defined boundaries. Logical and physical models are then described, with logical models showing what a system does independent of implementation and physical models including implementation details. The remainder of the document provides details on:
- Creating DFDs using processes, external entities, data stores, and data flows
- Developing context and level-0 diagrams
- Decomposing processes through functional decomposition and creating level-N diagrams
- Ensuring DFDs are complete and consistent
Welcome to my series of articles on Unified Modeling Language. This is "Session 2 – Use Case UML" of the series. I have covered Use Case Scenario, Use Case Narrative and Use Case Model in this session.
Please view my other documents where I have covered each UML diagram with examples
BPMN (Business Process Modeling Notation) provides a standard way to visually depict business processes in business process diagrams. It uses a set of core graphical elements like events, activities, gateways, swimlanes, and artifacts. Events can trigger the start, interruption or end of a process. Activities represent tasks or steps. Gateways control how sequence flows converge and diverge. Pools and swimlanes partition activities between different participants. BPMN also supports modeling exception handling, compensation, and transactions.
Final Project IS320 Electronic requisition systemMilosz Golik
The document outlines an electronic requisition system plan for purchasing office supplies. It includes an executive summary describing the key internal departments (purchasing, management, receiving, accounts payable) and external vendor involved. Diagrams are provided showing the data flow and logical structure of the system. Forms and reports that will be used are also described, such as a requisition order form, purchase order, and receipt. The goal is to streamline the approval and purchasing process electronically.
Software Engineering- ERD DFD Decision Tree and TableNishu Rastogi
Second half of Unit 2 of BCA 401 as per Invertis University, Syllabus
It includes introduction to ERD, DFD, Decision Tree and Table with examples and exercise.
Analysis and design of entreprise with umlzineb encgk
The document discusses visual modeling using the Unified Modeling Language (UML). It describes how UML can be used to capture business processes, analyze and design applications, and manage complexity. The document then provides an example of modeling a university registration system using UML, including identifying actors, use cases, class diagrams, and relationships between classes.
BPMN (Business Process Model and Notation) is a standard for business process modeling that provides a graphical notation for specifying business processes. It allows processes to be designed and shared between BPMS tools. ProcessMaker's BPMN Designer supports modeling processes and collaborations using BPMN. Key BPMN elements include events, activities, gateways, sequence flows, participants, and artifacts. BPMN enables visual representation of business processes through different types of diagrams.
This document provides an overview of various system and data modelling tools, including:
1. Data flow diagrams, context diagrams, schemas, and the data dictionary for representing database structure and relationships.
2. Decision trees and decision tables for showing decision paths and outcomes.
3. Normalization for minimizing data duplication through breaking databases into smaller linked tables.
4. SQL syntax and storyboards for querying databases and representing interfaces.
Examples are given for each tool to illustrate their use in system and data modelling.
A data flow diagram (DFD) visually shows the requirements of an information system through inputs, outputs, processes, data storage, and external entities. It uses standard symbols like processes, data flow, data stores, and external agents. The direction of data flow is top to bottom and left to right. Lower level DFDs expand processes into more detail. An event table lists events that trigger system responses. It includes the event, trigger, source, activity, response, and destination. Event tables define functional requirements and integrate with DFDs by showing how data flows when events are triggered. Each event table row represents a DFD fragment used to create a single process.
The document provides an introduction and overview of the Business Process Modeling Notation (BPMN). It discusses that BPMN was created to provide a standard notation that is understandable by all business users. BPMN defines graphical elements to develop simple diagrams that look like flowcharts. It categorizes the elements into flow objects, connecting objects, swimlanes, and artifacts. Flow objects include events, activities, and gateways. Connecting objects are sequence flows, message flows, and associations. Swimlanes separate activities using pools and lanes. BPMN aims to balance simplicity with the ability to model complex business processes.
BPMN (Business Process Modeling Notation) is a standard for modeling business processes. It allows for modeling processes, collaborations between participants, and choreographies of message exchanges. BPMN uses flowcharts and activity diagrams to represent the flow of activities. Key components include activities, events, gateways, swimlanes, and message flows. While BPMN is good for high-level modeling, it has limitations such as a lack of complexity and detail. These gaps can be addressed by extending BPMN with UML.
1. Defining the system involves developing standard templates, creating a vision document to communicate the product vision, and developing a use case model to define system functionality and stakeholders.
2. A vision document communicates the product's intent, benefits, features and goals to stakeholders. It establishes scope and priorities and records future ideas.
3. A use case model defines the system functions through use cases and actors. It provides a common understanding between developers and customers.
Integration is the process of combining separate software components into a single system. There are two main approaches: phased integration, where all components are combined at once, and incremental integration, where components are added one at a time. Incremental integration makes it easier to locate bugs and improves progress monitoring. Specific incremental strategies include top-down, bottom-up, and feature-oriented integration. It is generally best to use a combination of approaches for a given project. Daily builds and smoke tests also help reduce integration issues.
The document discusses IPv4 addressing and networking concepts. It defines an IPv4 address as a 32-bit address that uniquely identifies devices on the Internet. IPv4 addresses have either a binary or dotted decimal notation. The document also covers IPv4 classes, subnetting, supernetting, and classless addressing which allow for flexible allocation of address blocks.
This chapter discusses advanced entity-relationship modeling concepts including supertype/subtype relationships, generalization and specialization, constraints on supertype/subtype relationships, and business rules. It defines key terms like supertype, subtype, attribute inheritance, and provides examples of using supertype/subtype relationships to model common business situations. The chapter also covers using constraints to specify whether a supertype must have a subtype and whether subtypes are disjoint or can overlap. It introduces using entity clusters to improve readability of large EER diagrams and categorizes different types of business rules.
Access Methods and File System Mounting.pptxlaiba29012
There are three main ways to access files in a computer: sequential access, direct access, and index access. Sequential access reads files in order from beginning to end, direct access allows reading or writing any block directly by number, and index access uses pointers in an index to access records. A file system must be mounted before files can be accessed, with mount points typically being empty directories where the file system attaches within the overall file structure.
The document provides an introduction to SQL (Structured Query Language). It discusses the history and evolution of SQL standards. SQL is introduced as the most widely used and accepted language for managing data in relational database management systems. The key benefits of SQL and its role in creating, querying, updating and managing relational databases are described. Common SQL commands like CREATE, ALTER, DROP, INSERT, SELECT, UPDATE, DELETE are explained. Additional topics covered include functions, joins, subqueries and other advanced SQL features.
This document discusses memory management techniques in operating systems. It covers topics like swapping, contiguous memory allocation, paging, segmentation, and page tables. Paging divides memory into fixed-size blocks called frames and logical memory into blocks called pages. It uses a page table to map logical page numbers to physical frame numbers. Hierarchical and hashed page tables are discussed as structures to organize large page tables. Segmentation and paging can both be used to map logical to physical addresses.
This document presents a business plan for a company called Global Landfill Gas Production that aims to produce biogas from garbage using a waste-to-energy converter bin. The bin uses bacteria to break down organic waste and produce methane gas, which will then be transferred to containers and used as fuel by industries. The initial financing required is 2.9 million rupees to cover setup costs. The plan describes the production process, market potential in Pakistan, and competition in the waste management industry. It concludes there is considerable room for growth but also challenges from other firms developing new waste management technologies.
A distributed database (DDB) is a collection of logically related databases distributed across a computer network. It allows data and processing to occur at multiple sites. Key characteristics include data fragmentation across sites, replication of fragments for availability and performance, and distributed transaction management to ensure consistency. The main types are homogeneous DDBMS, where all sites use identical software, and heterogeneous DDBMS where different sites may use different systems. Challenges include complex management, security, and maintaining consistency across sites.
This document outlines a business idea for improving gym services. It identifies problems with the current manual system such as misinformation and elitist attitudes. The proposed solution is to digitalize services, offer video tutorials and seminars, implement friend/partner pricing and a reward program. This aims to educate staff, treat members as individuals, and build a supportive community.
HCL Notes und Domino Lizenzkostenreduzierung in der Welt von DLAUpanagenda
Webinar Recording: https://www.panagenda.com/webinars/hcl-notes-und-domino-lizenzkostenreduzierung-in-der-welt-von-dlau/
DLAU und die Lizenzen nach dem CCB- und CCX-Modell sind für viele in der HCL-Community seit letztem Jahr ein heißes Thema. Als Notes- oder Domino-Kunde haben Sie vielleicht mit unerwartet hohen Benutzerzahlen und Lizenzgebühren zu kämpfen. Sie fragen sich vielleicht, wie diese neue Art der Lizenzierung funktioniert und welchen Nutzen sie Ihnen bringt. Vor allem wollen Sie sicherlich Ihr Budget einhalten und Kosten sparen, wo immer möglich. Das verstehen wir und wir möchten Ihnen dabei helfen!
Wir erklären Ihnen, wie Sie häufige Konfigurationsprobleme lösen können, die dazu führen können, dass mehr Benutzer gezählt werden als nötig, und wie Sie überflüssige oder ungenutzte Konten identifizieren und entfernen können, um Geld zu sparen. Es gibt auch einige Ansätze, die zu unnötigen Ausgaben führen können, z. B. wenn ein Personendokument anstelle eines Mail-Ins für geteilte Mailboxen verwendet wird. Wir zeigen Ihnen solche Fälle und deren Lösungen. Und natürlich erklären wir Ihnen das neue Lizenzmodell.
Nehmen Sie an diesem Webinar teil, bei dem HCL-Ambassador Marc Thomas und Gastredner Franz Walder Ihnen diese neue Welt näherbringen. Es vermittelt Ihnen die Tools und das Know-how, um den Überblick zu bewahren. Sie werden in der Lage sein, Ihre Kosten durch eine optimierte Domino-Konfiguration zu reduzieren und auch in Zukunft gering zu halten.
Diese Themen werden behandelt
- Reduzierung der Lizenzkosten durch Auffinden und Beheben von Fehlkonfigurationen und überflüssigen Konten
- Wie funktionieren CCB- und CCX-Lizenzen wirklich?
- Verstehen des DLAU-Tools und wie man es am besten nutzt
- Tipps für häufige Problembereiche, wie z. B. Team-Postfächer, Funktions-/Testbenutzer usw.
- Praxisbeispiele und Best Practices zum sofortigen Umsetzen
Best 20 SEO Techniques To Improve Website Visibility In SERPPixlogix Infotech
Boost your website's visibility with proven SEO techniques! Our latest blog dives into essential strategies to enhance your online presence, increase traffic, and rank higher on search engines. From keyword optimization to quality content creation, learn how to make your site stand out in the crowded digital landscape. Discover actionable tips and expert insights to elevate your SEO game.
Programming Foundation Models with DSPy - Meetup SlidesZilliz
Prompting language models is hard, while programming language models is easy. In this talk, I will discuss the state-of-the-art framework DSPy for programming foundation models with its powerful optimizers and runtime constraint system.
A Comprehensive Guide to DeFi Development Services in 2024Intelisync
DeFi represents a paradigm shift in the financial industry. Instead of relying on traditional, centralized institutions like banks, DeFi leverages blockchain technology to create a decentralized network of financial services. This means that financial transactions can occur directly between parties, without intermediaries, using smart contracts on platforms like Ethereum.
In 2024, we are witnessing an explosion of new DeFi projects and protocols, each pushing the boundaries of what’s possible in finance.
In summary, DeFi in 2024 is not just a trend; it’s a revolution that democratizes finance, enhances security and transparency, and fosters continuous innovation. As we proceed through this presentation, we'll explore the various components and services of DeFi in detail, shedding light on how they are transforming the financial landscape.
At Intelisync, we specialize in providing comprehensive DeFi development services tailored to meet the unique needs of our clients. From smart contract development to dApp creation and security audits, we ensure that your DeFi project is built with innovation, security, and scalability in mind. Trust Intelisync to guide you through the intricate landscape of decentralized finance and unlock the full potential of blockchain technology.
Ready to take your DeFi project to the next level? Partner with Intelisync for expert DeFi development services today!
Digital Banking in the Cloud: How Citizens Bank Unlocked Their MainframePrecisely
Inconsistent user experience and siloed data, high costs, and changing customer expectations – Citizens Bank was experiencing these challenges while it was attempting to deliver a superior digital banking experience for its clients. Its core banking applications run on the mainframe and Citizens was using legacy utilities to get the critical mainframe data to feed customer-facing channels, like call centers, web, and mobile. Ultimately, this led to higher operating costs (MIPS), delayed response times, and longer time to market.
Ever-changing customer expectations demand more modern digital experiences, and the bank needed to find a solution that could provide real-time data to its customer channels with low latency and operating costs. Join this session to learn how Citizens is leveraging Precisely to replicate mainframe data to its customer channels and deliver on their “modern digital bank” experiences.
Digital Marketing Trends in 2024 | Guide for Staying AheadWask
https://www.wask.co/ebooks/digital-marketing-trends-in-2024
Feeling lost in the digital marketing whirlwind of 2024? Technology is changing, consumer habits are evolving, and staying ahead of the curve feels like a never-ending pursuit. This e-book is your compass. Dive into actionable insights to handle the complexities of modern marketing. From hyper-personalization to the power of user-generated content, learn how to build long-term relationships with your audience and unlock the secrets to success in the ever-shifting digital landscape.
Skybuffer SAM4U tool for SAP license adoptionTatiana Kojar
Manage and optimize your license adoption and consumption with SAM4U, an SAP free customer software asset management tool.
SAM4U, an SAP complimentary software asset management tool for customers, delivers a detailed and well-structured overview of license inventory and usage with a user-friendly interface. We offer a hosted, cost-effective, and performance-optimized SAM4U setup in the Skybuffer Cloud environment. You retain ownership of the system and data, while we manage the ABAP 7.58 infrastructure, ensuring fixed Total Cost of Ownership (TCO) and exceptional services through the SAP Fiori interface.
Dandelion Hashtable: beyond billion requests per second on a commodity serverAntonios Katsarakis
This slide deck presents DLHT, a concurrent in-memory hashtable. Despite efforts to optimize hashtables, that go as far as sacrificing core functionality, state-of-the-art designs still incur multiple memory accesses per request and block request processing in three cases. First, most hashtables block while waiting for data to be retrieved from memory. Second, open-addressing designs, which represent the current state-of-the-art, either cannot free index slots on deletes or must block all requests to do so. Third, index resizes block every request until all objects are copied to the new index. Defying folklore wisdom, DLHT forgoes open-addressing and adopts a fully-featured and memory-aware closed-addressing design based on bounded cache-line-chaining. This design offers lock-free index operations and deletes that free slots instantly, (2) completes most requests with a single memory access, (3) utilizes software prefetching to hide memory latencies, and (4) employs a novel non-blocking and parallel resizing. In a commodity server and a memory-resident workload, DLHT surpasses 1.6B requests per second and provides 3.5x (12x) the throughput of the state-of-the-art closed-addressing (open-addressing) resizable hashtable on Gets (Deletes).
GraphRAG for Life Science to increase LLM accuracyTomaz Bratanic
GraphRAG for life science domain, where you retriever information from biomedical knowledge graphs using LLMs to increase the accuracy and performance of generated answers
TrustArc Webinar - 2024 Global Privacy SurveyTrustArc
How does your privacy program stack up against your peers? What challenges are privacy teams tackling and prioritizing in 2024?
In the fifth annual Global Privacy Benchmarks Survey, we asked over 1,800 global privacy professionals and business executives to share their perspectives on the current state of privacy inside and outside of their organizations. This year’s report focused on emerging areas of importance for privacy and compliance professionals, including considerations and implications of Artificial Intelligence (AI) technologies, building brand trust, and different approaches for achieving higher privacy competence scores.
See how organizational priorities and strategic approaches to data security and privacy are evolving around the globe.
This webinar will review:
- The top 10 privacy insights from the fifth annual Global Privacy Benchmarks Survey
- The top challenges for privacy leaders, practitioners, and organizations in 2024
- Key themes to consider in developing and maintaining your privacy program
Skybuffer AI: Advanced Conversational and Generative AI Solution on SAP Busin...Tatiana Kojar
Skybuffer AI, built on the robust SAP Business Technology Platform (SAP BTP), is the latest and most advanced version of our AI development, reaffirming our commitment to delivering top-tier AI solutions. Skybuffer AI harnesses all the innovative capabilities of the SAP BTP in the AI domain, from Conversational AI to cutting-edge Generative AI and Retrieval-Augmented Generation (RAG). It also helps SAP customers safeguard their investments into SAP Conversational AI and ensure a seamless, one-click transition to SAP Business AI.
With Skybuffer AI, various AI models can be integrated into a single communication channel such as Microsoft Teams. This integration empowers business users with insights drawn from SAP backend systems, enterprise documents, and the expansive knowledge of Generative AI. And the best part of it is that it is all managed through our intuitive no-code Action Server interface, requiring no extensive coding knowledge and making the advanced AI accessible to more users.
Generating privacy-protected synthetic data using Secludy and MilvusZilliz
During this demo, the founders of Secludy will demonstrate how their system utilizes Milvus to store and manipulate embeddings for generating privacy-protected synthetic data. Their approach not only maintains the confidentiality of the original data but also enhances the utility and scalability of LLMs under privacy constraints. Attendees, including machine learning engineers, data scientists, and data managers, will witness first-hand how Secludy's integration with Milvus empowers organizations to harness the power of LLMs securely and efficiently.
5th LF Energy Power Grid Model Meet-up SlidesDanBrown980551
5th Power Grid Model Meet-up
It is with great pleasure that we extend to you an invitation to the 5th Power Grid Model Meet-up, scheduled for 6th June 2024. This event will adopt a hybrid format, allowing participants to join us either through an online Mircosoft Teams session or in person at TU/e located at Den Dolech 2, Eindhoven, Netherlands. The meet-up will be hosted by Eindhoven University of Technology (TU/e), a research university specializing in engineering science & technology.
Power Grid Model
The global energy transition is placing new and unprecedented demands on Distribution System Operators (DSOs). Alongside upgrades to grid capacity, processes such as digitization, capacity optimization, and congestion management are becoming vital for delivering reliable services.
Power Grid Model is an open source project from Linux Foundation Energy and provides a calculation engine that is increasingly essential for DSOs. It offers a standards-based foundation enabling real-time power systems analysis, simulations of electrical power grids, and sophisticated what-if analysis. In addition, it enables in-depth studies and analysis of the electrical power grid’s behavior and performance. This comprehensive model incorporates essential factors such as power generation capacity, electrical losses, voltage levels, power flows, and system stability.
Power Grid Model is currently being applied in a wide variety of use cases, including grid planning, expansion, reliability, and congestion studies. It can also help in analyzing the impact of renewable energy integration, assessing the effects of disturbances or faults, and developing strategies for grid control and optimization.
What to expect
For the upcoming meetup we are organizing, we have an exciting lineup of activities planned:
-Insightful presentations covering two practical applications of the Power Grid Model.
-An update on the latest advancements in Power Grid -Model technology during the first and second quarters of 2024.
-An interactive brainstorming session to discuss and propose new feature requests.
-An opportunity to connect with fellow Power Grid Model enthusiasts and users.
1. Department
of
Computer
Science
Lab Learning Outcomes
Model some sample scenarios using
intermediate BPMN concepts
Pools
Lanes
Orchestration
Collaboration
Message Flows
Choreography
Black & White Box Pools
Slide 1
2. Department
of
Computer
Science
Pools and Lanes
A Pool in BPMN notation represents a
participant
A participant is defined as a business entity
(e.g. a company, a customer, a patient) or a
role (e.g. a buyer, a seller) or a system (e.g.
Ticketing System) that controls or is
responsible for a business process.
Pools act as containers for the flow objects
that represent a participant’s process.
Pools can be internal to an organization or
can represent completely separate entities.
Slide 2
3. Department
of
Computer
Science
Pool example 1
Slide 3
Supplier
Receive
Order
Accepted
or Rejected?
Close Order
Fill Order
Accepted
Rejected
Send Invoice
Ship Order
Accept
Payment
+
The participant is
“Supplier”
Flow objects that
represent the
Supplier’s process
4. Department
of
Computer
Science
Ticketing
System
Receive ticket
details
Create ticket ID
Display error
message
Ticket
creation or
search?
Creation
Receive Ticket
ID
Search
Do ID search
Ticket
found?
YES
NO
Register ticket
details
Display ticket ID
and description
Pool example 2
Slide 4
The participant is
“Ticketing
System”
Flow objects that
represent the
Ticketing
System’s process
5. Department
of
Computer
Science
Lanes or swimlanes
Lanes are used to partition Pools.
A partition is used to organize and
categorize activities within a Pool.
Lanes usually represent internal roles
within an organisation (e.g., Manager,
Associate), systems (e.g., an enterprise
application), an internal department
(e.g., shipping, finance), a business
location (e.g., UK, Germany), etc.
Slide 5
6. Department
of
Computer
Science
Lane example 1
Slide 6
The participant is
the “Supplier”
therefore the Pool
represents the
Supplier
The process has been partitioned to
show which internal departments are
doing which activities – each lane
therefore represents a department
Suplier
Sales/Marketing
Accounts
Operations
Receive
Order
Close Order
Fill Order
Accepted
Rejected
Send Invoice
Ship Order
Accept
Payment
+
7. Department
of
Computer
Science
Ticketing
System
Ticket
Search
Ticket
Creation
Receive ticket
details
Create ticket ID
Display error
message
Ticket
creation or
search?
Creation
Receive Ticket
ID
Search
Do ID search
Ticket
found?
YES
NO
Register ticket
details
Display ticket ID
and description
Lane example 2
Slide 7
The participant is the
“Ticketing System”
therefore the Pool
represents the
Ticketing System
The process has been partitioned to
show which functions are doing which
activities within the system – each
lane therefore represents a function
10. Department
of
Computer
Science
Orchestration
What they are:
The business process as seen from the point of view of a
single business entity.
The flow objects represented are internal to a specific
participant.
Used for documenting process behaviour.
Also called workflow diagrams.
Many of the examples looked at so far are orchestrations.
How they are represented:
On their own without lanes or pools
Within one Pool
Within one Pool with Lanes
Within one Pool with interaction with a black box Pool
Slide 10
11. Department
of
Computer
Science
Orchestration Examples 1 & 2
Slide 11
Receive
Application
Form
Do Credit Check
Credit
Check OK?
Issue Credit
Card
Refuse Credit
Card
YES
NO
Credit
Card
Company
Receive
Application
Form
Do Credit Check
Credit
Check OK?
Issue Credit
Card
Refuse Credit
Card
YES
NO
The orchestration
on its own
The orchestration within a
pool. An orchestration can
only be represented within
ONE pool
1.
2.
12. Department
of
Computer
Science
Orchestration Example 3
Slide 12
An orchestration within a
pool with lanes
Suplier
Sales/Marketing
Accounts
Operations
Receive
Order
Close Order
Fill Order
Accepted
Rejected
Send Invoice
Ship Order
Accept
Payment
+
3.
14. Department
of
Computer
Science
Message Flows
A message flow is a connector like a sequence flow
but it occurs only between Pools, i.e. only to show
the interaction between participants in a process.
Sometimes message flows are labelled with the
particular interaction
Slide 14
This is the symbol
for the message flow
connector
This is a message
flow connector with
a label
Appointment Request
15. Department
of
Computer
Science
Collaboration diagrams
Collaboration
Shows the participants in a process and their
interactions.
This means a collaboration diagram usually has
more than one Pool.
A white box Pool is one in which there are flow
objects representing a participant’s process.
A black box Pool is one in which the participant’s
process is hidden.
Choreography
The sequence of interactions taking place
between participants.
Slide 15
16. Department
of
Computer
Science
Collaboration Example 1
Slide 16
Patient
Doctor’s
Office
Request
Doctor’s
Appointment
Receive
Appointment
Relate
Symptoms
Receive
Prescription
Script
Request
Medicine
Receive
Medicine
Receive
Appointment
Request
Make
Appointment
Diagnose
Symptoms
Prepare
Prescription
Send
Prescription
Receive
Medicine
Request
Send
Medicine
Illness
Occurs
This collaboration
shows the activities
involved in a patient
seeking treatment
from a doctor’s
surgery.
Both of the participants’
processes are visible in
this collaboration, thus
they are white box
pools.
The collaboration
depicts the two pools
representing the two
participants and the
activities within the
pools.
17. Department
of
Computer
Science
Collaboration Example 2
Slide 17
Patient
Doctor’s
Office
Receive
Appointment
Request
Make
Appointment
Diagnose
Symptoms
Prepare
Prescription
Send
Prescription
Receive
Medicine
Request
Send
Medicine
Slide 17
This collaboration is
similar to the previous
one in which the
patient seeks
treatment at the
doctor’s surgery.
The pool without
activities represented is
called a black box pool.
The message flows only
go to the boundary of a
black box pool.
The collaboration
depicts two pools, but
only one has the
activities within the pool
represented.
18. Department
of
Computer
Science
Collaboration Example 3
Slide 18
Slide 18
The same
collaboration but with
2 black box pools
The message flows are
labelled to indicate what
is happening between
the participants
Patient
Doctor’s
Office
Appointment Request Appointment Confirmation Prescription Sent Medicine Request Medicine Sent
19. Department
of
Computer
Science
Collaboration options
Collaboration diagrams can show interactions:
1. between separate business entities e.g. the Doctor’s
Office and the Patient OR
2. within one business entity such as departments, teams or
even single employees and software systems
The representation is dependent on the purpose of
the model:
Showing interactions between the business entity as a
whole and an external customer (option 1 above)
Showing communication between the entities in the
organization and their interactions (option 2 above)
Option 2 can also be called an organizational
collaboration since it represents processes within an
organization Slide 19
20. Department
of
Computer
Science
Organizational Collaboration
Slide 20
This collaboration depicts the
communication between
departments within an
organization for one process.
Compare with the
orchestration on slide 14.
Sales/Marketing
Operations
Function
Receive
Order
ACCEPTED
Request Order
Fulfilment
Fill Order
Ship Order
Request
Invoicing
Send Invoice
Accept
Payment
Close Order
REJECTED
Order fulfilment
request
received
Invoice request
received
Order
completed
Order fulfilment
complete
23. Department
of
Computer
Science
Choreography Diagram
Slide 23
Request
Appointment
Patient
Doctor’s Office
Make
Appointment
Patient
Doctor’s Office
Patient feels ill
Appointment
confirmation
Provides
appointment
slot
Relate
Symptoms
Patient
Doctor’s Office
Set of
symptoms
Illness
diagnosis
Send
Prescription
Patient
Doctor’s Office
Prescribes
medicine
Request
Medicine
Patient
Doctor’s Office
Presents
prescription
Send Medicine
Patient
Doctor’s Office
Provides
medication
Each element of
the choreography
diagram represents
a point of
interaction
between the
participants
There is a
distinction between
the side that
initiates the
messages and the
side that receives
The messages
between the
participants are
also differentiated
depending on
whether they are
sent or received
Choreographies
can be depicted on
their own as in this
diagram or can be
shown between
Pools
24. Department
of
Computer
Science
Public Processes
What they are:
Interactions between a private business process
and another process or a participant
Only those activities that are points of interaction
between the entities are shown, other details are
hidden
How they are represented:
By collaboration diagrams
Can be drawn side by side with more detailed
private diagrams
Can be further translated into choreographies
Slide 24
25. Department
of
Computer
Science
Public Diagram Example
Slide 25
Patient
Doctor’s
Office
Request
Doctor’s
Appointment
Receive
Appointment
Relate
Symptoms
Receive
Prescription
Script
Request
Medicine
Receive
Medicine
Receive
Appointment
Request
Make
Appointment
Diagnose
Symptoms
Prepare
Prescription
Send
Prescription
Receive
Medicine
Request
Send
Medicine
Illness
Occurs
This part of the
collaboration is
private and will be
removed to depict a
Public Process
26. Department
of
Computer
Science
Public Diagram Example
Slide 26
Patient
Doctor’s
Office
Request
Doctor’s
Appointment
Receive
Appointment
Relate
Symptoms
Receive
Prescription
Script
Request
Medicine
Receive
Medicine
Receive
Appointment
Request
Make
Appointment
Diagnose
Symptoms
Send
Prescription
Receive
Medicine
Request
Send
Medicine
Illness
Occurs
Only interactions (tasks/events
and message flows) between the
two participants are now shown
27. Department
of
Computer
Science
Public Diagram Example 2
Slide 27
Buyer
Supplier
Receive
Order
Send Invoice
Ship Order
Accept
Payment
This public diagram depicts the
interactions between supplier and
buyer participants. Compare
with the private diagram on slide
15.