Download to read offline


![Odds Ratios Explanation
• Need a statistical useful comparison
–Using odds ratios [J.T.E. Richardson personal communication]
• If the probability of the members of Group 1 exhibiting a
particular outcome is p then the odds of this are p/(1 − p)
• If the probability of the members of Group 2 exhibiting
that outcome is q, then the odds of this are q/(1 − q)
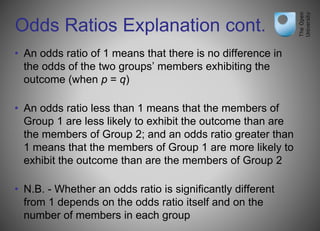
• The odds ratio is the ratio between these odds (i.e. [p/(1
− p)]/[q/(1 − q)], which equals [p(1 − q)]/[q(1 − p)])
• Odds ratios vary from 0 (when p = 0 or q = 1) to infinity
(when p = 1 or q = 0)](https://image.slidesharecdn.com/learninganalyticsandaccessibilitycalrg2015-mc-150617041118-lva1-app6892/85/Learning-analytics-and-accessibility-calrg-2015-5-320.jpg)
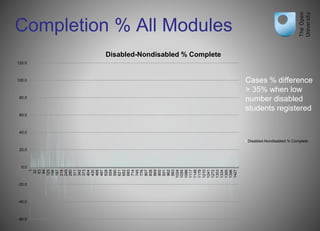


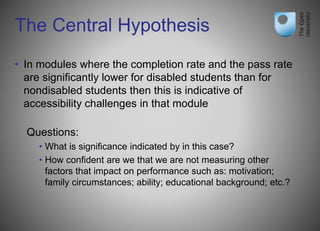
This document discusses the use of learning analytics (LA) to assess accessibility challenges faced by disabled students in academic modules, focusing on retention and pass rates. It emphasizes the significance of data analysis, including odds ratios, to identify accessibility barriers and proposes future actions to enhance module accessibility based on findings. The author suggests a threshold for decision-making regarding accessibility issues, highlighting the need for further qualitative assessments and collaboration with specialists.


