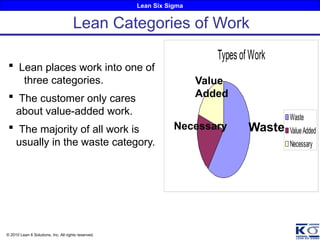
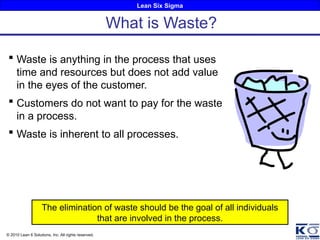
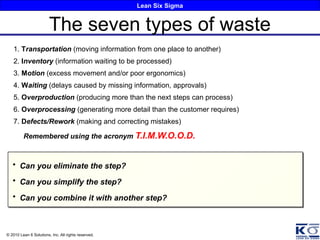
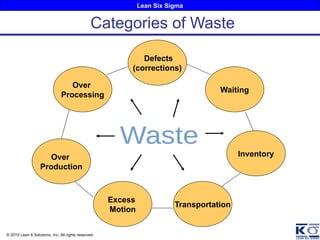
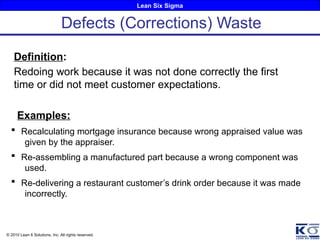
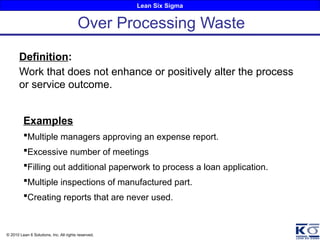
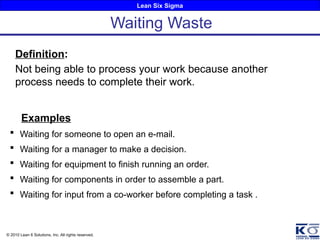
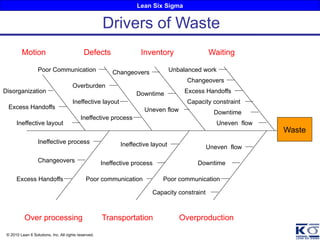
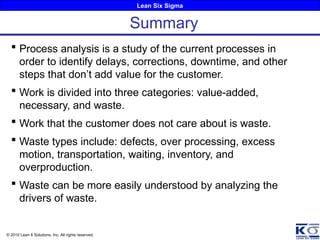
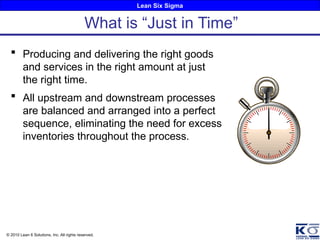
Lean Six Sigma
© 2010 Lean 6 Solutions, Inc. All rights reserved.
Pull System
Lean Six Sigma
© 2010 Lean 6 Solutions, Inc. All rights reserved.
Types of Work
Waste
ValueAdded
Necessary
Waste
Necessary
Value
Added
 Lean places work into one of
three categories.
 The customer only cares
about value-added work.
 The majority of all work is
usually in the waste category.
Lean Categories of Work
Lean Six Sigma
© 2010 Lean 6 Solutions, Inc. All rights reserved.
 Waste is anything in the process that uses
time and resources but does not add value
in the eyes of the customer.
 Customers do not want to pay for the waste
in a process.
 Waste is inherent to all processes.
What is Waste?
The elimination of waste should be the goal of all individuals
that are involved in the process.
Lean Six Sigma
© 2010 Lean 6 Solutions, Inc. All rights reserved.
1. Transportation (moving information from one place to another)
2. Inventory (information waiting to be processed)
3. Motion (excess movement and/or poor ergonomics)
4. Waiting (delays caused by missing information, approvals)
5. Overproduction (producing more than the next steps can process)
6. Overprocessing (generating more detail than the customer requires)
7. Defects/Rework (making and correcting mistakes)
Remembered using the acronym T.I.M.W.O.O.D.
The seven types of waste
• Can you eliminate the step?
• Can you simplify the step?
• Can you combine it with another step?
Lean Six Sigma
© 2010 Lean 6 Solutions, Inc. All rights reserved.
Categories of Waste
Over
Processing
Over
Production
Transportation
Waiting
Inventory
Defects
(corrections)
Excess
Motion
Lean Six Sigma
© 2010 Lean 6 Solutions, Inc. All rights reserved.
Definition:
Redoing work because it was not done correctly the first
time or did not meet customer expectations.
Examples:
 Recalculating mortgage insurance because wrong appraised value was
given by the appraiser.
 Re-assembling a manufactured part because a wrong component was
used.
 Re-delivering a restaurant customer’s drink order because it was made
incorrectly.
Defects (Corrections) Waste
Lean Six Sigma
© 2010 Lean 6 Solutions, Inc. All rights reserved.
Examples
Multiple managers approving an expense report.
Excessive number of meetings
Filling out additional paperwork to process a loan application.
Multiple inspections of manufactured part.
Creating reports that are never used.
Definition:
Work that does not enhance or positively alter the process
or service outcome.
Over Processing Waste
Lean Six Sigma
© 2010 Lean 6 Solutions, Inc. All rights reserved.
Definition:
Not being able to process your work because another
process needs to complete their work.
Examples
 Waiting for someone to open an e-mail.
 Waiting for a manager to make a decision.
 Waiting for equipment to finish running an order.
 Waiting for components in order to assemble a part.
 Waiting for input from a co-worker before completing a task .
Waiting Waste
Lean Six Sigma
© 2010 Lean 6 Solutions, Inc. All rights reserved.
Definition:
Carrying extra inventory beyond what is needed to meet
customer demands.
Examples
 Purchasing more materials than are needed to satisfy the demands
of the customer.
 Waiting until sufficient work accumulates to begin working.
 Ordering additional parts as a buffer against shortages.
Excess Inventory Waste
Lean Six Sigma
© 2010 Lean 6 Solutions, Inc. All rights reserved.
Definition:
Worker movements or displacements that do not add value
to the product or service.
Examples
 A filing system is unorganized and a person has to spend
excessive time looking for files.
 An assembly workstation is poorly designed and too many steps
and movement are needed to do the work.
 Accounting has to locate several files and databases to prepare a
customer invoice.
Excess Motion Waste
Lean Six Sigma
© 2010 Lean 6 Solutions, Inc. All rights reserved.
Definition:
Delivering more products or services than required;
production or processing done at a faster rate than
required to meet customer demand.
Examples
 Manufacturing excessive product based on a forecast.
 Overestimating in the budgeting process.
 Creating more reports than are necessary.
 Ordering more parts than are necessary to fix equipment.
Over Production Waste
Lean Six Sigma
© 2010 Lean 6 Solutions, Inc. All rights reserved.
Definition:
Movement and transportation of material, product, or
information not absolutely necessary to meet
customer requirements.
Examples
 Moving finished materials long distances for storage.
 Back and forth mailing between departments to obtain
authorization signatures.
 Movement of materials from one operation to another.
 Unloading material from a truck and placing in temporary
storage before moving it to final storage.
Transportation Waste
Lean Six Sigma
© 2010 Lean 6 Solutions, Inc. All rights reserved.
Drivers of Waste
Waste
Waiting
Over processing Overproduction
Inventory
Motion
Transportation
Defects
Downtime
Disorganization
Overburden
Excess Handoffs
Uneven flow
Ineffective layout
Ineffective process
Uneven flow
Changeovers
Ineffective layout
Downtime
Downtime
Excess Handoffs
Ineffective process
Ineffective process
Capacity constraint
Unbalanced work
Excess Handoffs
Ineffective layout
Changeovers
Poor communication
Poor Communication Changeovers
Poor communication
Uneven flow
Capacity constraint
Lean Six Sigma
© 2010 Lean 6 Solutions, Inc. All rights reserved.
 A resource that physically limits the
process from meeting its objectives.
 Any resource whose capacity is less
than or equal to the demand placed
upon it.
 The resource constraint may be internal
or external.
Capacity Constraint
Lean Six Sigma
© 2010 Lean 6 Solutions, Inc. All rights reserved.
Volume of work does not arrive is a steady rate.
 End of quarter sales
 All repair parts are returned at the end of the month
 Shipping extra products to exceed end of the month goals
 Batching work before sending it to the next process.
Uneven Process Flow
Lean Six Sigma
© 2010 Lean 6 Solutions, Inc. All rights reserved.
Large Batch Size
 Processes with large batch sizes often contribute a lot of
waste to the system.
 Large batches create waiting time in the processes
because all the work needs to be done before moving on
the next step.
 Large batches increase detection time for process errors
because of the delays in getting to the next step.
 Large batches increase levels of inventory.
Lean Six Sigma
© 2010 Lean 6 Solutions, Inc. All rights reserved.
 The rate at which the process produces does not always
meet the demand of the customer (internal or external
customer).
 Individual work areas can overproduce for their internal
customers, while the overall process can still meet the
demands of the external customer.
 Excess items in queue (inventory) is a sign that a process is
overproducing.
 A process should be designed to produce at rate of customer
demand.
Producing at the Rate of Demand
Lean Six Sigma
© 2010 Lean 6 Solutions, Inc. All rights reserved.
Takt Time - the time which synchronizes work or service
required to customer demand.
Takt time =
Total Available Work Time
Average Customer Demand
What is Takt Time?
Takt time is most easily applied
to repetitive processes.
Lean Six Sigma
© 2010 Lean 6 Solutions, Inc. All rights reserved.
Available Work Time
Working Days Per Month 20
Shifts Per Day 3
Minutes Per Shift 480
Breaks (minutes) 60
Available Work Time 25200
Monthly Customer Demand
Month Qty
25200
Jan 800
Feb 709
Mar 560
Apr 765
May 762
Jun 670
Jul 555
Average 689
Takt Time = 36.6 minutes/part
=
689
(20*3*(480-60))
Takt Time Example
Lean Six Sigma
© 2010 Lean 6 Solutions, Inc. All rights reserved.
Unbalanced Work
Process steps that take varying amounts of cycle time to
complete the work.
Work in Process
22 min 45 min
18 min
20 min
Cycle Time
Lean Six Sigma
© 2010 Lean 6 Solutions, Inc. All rights reserved.
Line Balance Chart
Step
#1
Step
#2
Step
#3
Step
#4
Takt Time
Cycle
Time
 Each process step should be producing close to the takt time.
 In this example, step 4 is out of balance with the rest of the steps.
Process Step
Lean Six Sigma
© 2010 Lean 6 Solutions, Inc. All rights reserved.
Line Balance Chart
Step
#1
Step
#2
Step
#3
Takt Time
Cycle
Time
 Redistributing the work allows each step to be closer to the takt time.
 In this example, the work was consolidated into three steps in order to
operate the process at a lower cost.
Process Step
Lean Six Sigma
© 2010 Lean 6 Solutions, Inc. All rights reserved.
Overburdened People/Equipment
 The overextension of the capacities of people and/or
equipment.
 When people or equipment is pushed beyond their
natural limits waste often occurs (corrections, waiting,
etc).
 Examples
- A group of people are worked long hours every day for multiple days to
deliver a customer order.
- A design engineer is always overbooked beyond her capacity
- One piece of equipment is operated beyond its normal
operating capabilities.
Lean Six Sigma
© 2010 Lean 6 Solutions, Inc. All rights reserved.
 The majority of the cycle time
in a process is waste.
 Processes are made efficient
by reducing total cycle time.
 Total cycle time consists of
process time and queue time.
Cycle Time Reduction
Value
Added
Waste
Total Cycle Time
Lean Six Sigma
© 2010 Lean 6 Solutions, Inc. All rights reserved.
 Processing 1% - 5% of total cycle time
 Queue/Storage 70% - 80% of total cycle time
 Transportation 10% of total cycle time
 Inspection 5%-10% of total cycle time
Typical Process Activities
Lean Six Sigma
© 2010 Lean 6 Solutions, Inc. All rights reserved.
 Process Cycle Efficiency (PCE) is the percentage of value
added work in the process.
 Process Cycle Efficiency is the best measure of overall
process health.
 A process with low PCE will have a lot of non value-added
work and great opportunities for cost reduction.
Process Cycle Efficiency
PCE =
Value Added Time
Total Cycle Time
Lean Six Sigma
© 2010 Lean 6 Solutions, Inc. All rights reserved.
 Process analysis is a study of the current processes in
order to identify delays, corrections, downtime, and other
steps that don’t add value for the customer.
 Work is divided into three categories: value-added,
necessary, and waste.
 Work that the customer does not care about is waste.
 Waste types include: defects, over processing, excess
motion, transportation, waiting, inventory, and
overproduction.
 Waste can be more easily understood by analyzing the
drivers of waste.
Summary
Lean Six Sigma
© 2010 Lean 6 Solutions, Inc. All rights reserved.
 Producing and delivering the right goods
and services in the right amount at just
the right time.
 All upstream and downstream processes
are balanced and arranged into a perfect
sequence, eliminating the need for excess
inventories throughout the process.
What is “Just in Time”
Lean Six Sigma
© 2010 Lean 6 Solutions, Inc. All rights reserved.
 Just-in-Time” is a term that applies to the tools and
methods that make value flow faster.
 These tools are used to communicate customer demand
up the product or service chain
 Customer demand serves as the pull—the signal to
make more.
 Batch sizes are reduced, ideally to one, so that goods
and services can flow more quickly.
Just In Time
Lean Six Sigma
© 2010 Lean 6 Solutions, Inc. All rights reserved.
 Developed by Toyota to meet the need for small quantity
production in Japan.
 Designed by Toyota executive Taiichi Ohno who observed,
after visiting an American supermarket:
- Consumers bought what they needed, as they needed it.
- The products in the store were restocked after being taken off the
shelf.
Origins of JIT
Lean Six Sigma
© 2010 Lean 6 Solutions, Inc. All rights reserved.
 Process flow examines the flow of product, material, and
information through the process.
 Continues through each step of production or processing,
including the acquisition of raw materials or information.
 Ends with the order and delivery of the finished product or
service to meet customer needs.
Process Flow
Lean Six Sigma
© 2010 Lean 6 Solutions, Inc. All rights reserved.
 Products and services travel through the process
without any interruptions; there is little to no queue time.
 Continuous flow means that when a customer places an
order there is trigger to obtain the raw materials needed
just for that order.
 As an item finishes being processed in one activity, it
immediately starts being worked on in the next one.
 Eliminating all wasted time and effort in the process in
order to reduce total cycle time.
What is Continuous Flow?
Lean Six Sigma
© 2010 Lean 6 Solutions, Inc. All rights reserved.
 Easily exposes
waste in the
workplace.
 Reduces inventory
costs
 Increases flexibility
in meeting customer
demands
 Produces only what
the customer orders
 Shortens total cycle
time.
 Improves safety
 Increases throughput
to the customer
because
overproduction is
reduced.
 Improves morale
because of increase
value in work.
 Reduces costs by
quickly detecting
defects to prevent
additional in-process
Benefits of Continuous Flow
Lean Six Sigma
© 2010 Lean 6 Solutions, Inc. All rights reserved.
 Beginning a task, stopping and then putting
the work aside because information or parts
are not available.
 Batching your work (waiting until you have a
sufficient quantity) before forwarding it to the
next step.
 Managing a task multiple times when it could
have been completed all at one time.
 Capacity constraints in the process.
 Imbalanced line
What Interferes with Flow
Lean Six Sigma
© 2010 Lean 6 Solutions, Inc. All rights reserved.
General Principle Example
Don’t work with
incomplete material
or information
Don’t assemble custom products until all components
are available.
Minimize batching
and queuing
Reduce the number of parts that are wound before
they are moved to masking.
Use one-touch flow Move masked rolls to spray without staging.
Manufacturing Flow Examples
Lean Six Sigma
© 2010 Lean 6 Solutions, Inc. All rights reserved.
 Organize people and equipment by similarity in function.
- Economies of scale: squeeze out the most production at the
lowest possible cost per unit.
- Flexibility in scheduling to achieve high asset utilization.
 Move products and services in large batches to eliminate
trips and travel time.
 Production schedules are created for each individual
department in order to optimize equipment usage and
utilize people.
Traditional Mass Production
Lean Six Sigma
© 2010 Lean 6 Solutions, Inc. All rights reserved.
 Processes create a lot of inventory
which is not used to meet the actual
demand of the customer.
 Work may be slowed by being queued
behind proceeding work, or shortages
of material or information.
 Local optimization of departmental
processes that does not improve the
end to end process.
Traditional Mass Production
Lean Six Sigma
© 2010 Lean 6 Solutions, Inc. All rights reserved.
Traditional System
When a process completes its work, it delivers the product,
service, or unit of work to a downstream process, where it
is stored until needed.
Pull System
A process requests a product, service, or unit of work from
an upstream process as it is required; there is no
intermediate storage.
A pull system should be used when continuous flow can not be
achieved.
What is a Pull System?
Lean Six Sigma
© 2010 Lean 6 Solutions, Inc. All rights reserved.
 A system where an signal controls the flow of
materials and information.
 Resources are allocated based on actual
consumption not a forecasted demand.
 A pacemaker process sets the pace of
production.
 Scheduling of work is based on visual
controls.
What is a Pull System?
Lean Six Sigma
© 2010 Lean 6 Solutions, Inc. All rights reserved.
 The pull system helps eliminate waste in the process:
- Waste of overproduction
- Waste of inventory
 Pull systems also reduce uneven flow in the system and
overburden on individual resources.
 By analyzing process flow, you can identify bottlenecks,
inefficiencies, and other obstacles to quality, which will
reduce waste in the process.
Benefits of Pull Systems
Lean Six Sigma
© 2010 Lean 6 Solutions, Inc. All rights reserved.
1 min
Process A Process B Process C
9 min
3 min
27 min
CT= 3 min/part
CT = 1 min/part CT = 1 min/part
1 min
 Using a batch size of 10, the first unit will take 41 minutes to pass through
the entire process.
 The majority of the time is spent in queue waiting for the other units to be
produced.
Cycle Time Queue Time
Large Batch Sizes
Lean Six Sigma
© 2010 Lean 6 Solutions, Inc. All rights reserved.
1 min
Process A Process B Process C
0 min
3 min
0 min
1 min
 Using a batch size of 1, the first unit will take 5 minutes to pass through
the entire process.
 The entire order will also take less time because the next operation can be
working on units, instead of waiting for them.
Cycle Time Queue Time
Small Batch Sizes
CT = 1 min/part CT= 3 min/part CT = 1 min/part
Lean Six Sigma
© 2010 Lean 6 Solutions, Inc. All rights reserved.
 It is a visual signal that tells the an operation how much to
produce and when to stop.
 A kanban system controls production to replenish
consumed product.
 In a kanban environment a product or service is produced
when a signal to produce has been sent from the upstream
process.
 A kanban system replaces traditional daily or weekly
production schedules.
What is a Kanban?
Lean Six Sigma
© 2010 Lean 6 Solutions, Inc. All rights reserved.
There are two basic types of Kanban:
1. In-Process Kanban: A visual signal to
pace the movement of products in a flow
process.
2. Material Kanban: A visual signal to
replenish consumed material in a lean
production process.
Types of Kanban?
Lean Six Sigma
© 2010 Lean 6 Solutions, Inc. All rights reserved.
 When material runs out, an operator brings a kanban card
to the material storage area.
 Someone replenishes the material at the production area.
 There are three types of material kanbans:
- Supplier Kanbans
- Production Kanbans
- Withdrawal Kanbans
Material Kanban
Lean Six Sigma
© 2010 Lean 6 Solutions, Inc. All rights reserved.
 Operators maintain a maximum number of units as in-
process work, while working on one unit at their station.
 After a unit is pulled out of the in-process work, they begin
to work on another one at their station.
In-Process Kanban
Lean Six Sigma
© 2010 Lean 6 Solutions, Inc. All rights reserved.
 When one bin is empty, it is a signal for to have the
bin replenished by the upstream process.
 The bins are sized such that the 2nd
bin will never be
empty before the 1st
bin has been replenished.
Full
Full
Time
Full
Empty
Signal sent to
fill empty
container
Partial
One container
in use while
other is filled
Empty
Full
Signal sent to
fill empty
container
Partial
One container
in use while
other is filled
Two-bin Kanban
Lean Six Sigma
© 2010 Lean 6 Solutions, Inc. All rights reserved.
1. The downstream process pulls from the upstream
process only what is needed.
2. The upstream process makes only what is needed to
replenish what the downstream process used.
3. Defects are never sent to the next process.
4. Kanban cards are always kept with the product.
5. A kanban system will help identify waste in the process.
Rules of Kanban
Lean Six Sigma
© 2010 Lean 6 Solutions, Inc. All rights reserved.
 The quantity of parts in each bin of a 2-bin kanban is
calculated by the following formula:
 Kanban quantity = (time to refill bin) X (# parts required
during that time) + safety buffer,
 2 bin-kanban systems are easy to manage.
 Requires a steady demand for your product.
Kanban Quantities
Lean Six Sigma
© 2010 Lean 6 Solutions, Inc. All rights reserved.
 A strategically located inventory of parts, which protects the
process against part shortages caused by variable demand.
 A multi-bin kanban creates a “pull signal” every time a bin is
withdrawn, whereas a supermarket creates a “pull signal” at
a pre-defined level.
What is a Supermarket?
Lean Six Sigma
© 2010 Lean 6 Solutions, Inc. All rights reserved.
 Place it close to the point of use.
 Ensure that it is centrally located in the
facility for ease of retrieval.
 Locate them in locations where it
facilitates First-in-first-out.
Locating a Supermarket
Lean Six Sigma
© 2010 Lean 6 Solutions, Inc. All rights reserved.
Water Spider – Milk Runs
• Water Spider (Bus Route vs. Cab)
– Continual route that is repeated on a regular interval
– Pick up and delivery at every bus stop
– Rare to move without inventory
• Milk Runs
– Continual route of external pick up and deliveries,
often from suppliers or outside services
– The route is set at a certain pick up and delivery time
Lean Six Sigma
© 2010 Lean 6 Solutions, Inc. All rights reserved.
Advantages of Routine Material Movement
• Keep Regular VA workers at task
• Supports pacing of operations
• Simplifies the calculation of inventory required at each
operations
– cycle time of deliveries – 2 hours for water spider typically
• Defects are caught quickly & easily communicated up
stream
• Keeps materials flowing through the system
• Ties together operations that are not physically located
together
• Adds in maintaining FIFO
Lean Six Sigma
© 2010 Lean 6 Solutions, Inc. All rights reserved.
Process Balance – Design Principles
• Remove / Minimize NVA (conveyance, standby, and motion wastes)
• Stabilize then minimize Cycle Time
• Maximize resource efficiency
• Minimize number of process steps
• Balance tasks/labor across process steps
• Maximize space utilization
• Minimize takt variance
Lean Six Sigma
© 2010 Lean 6 Solutions, Inc. All rights reserved.
 Purpose: Practice analyzing and improving a production
flow.
 Groupings: 4 teams, 2 companies each company will have
1 Sub-assembly and 1 assembly line, each team will have
5-6 people
 Materials: Lego bricks
 Exercise: Use the tools learned during the training to
reduce waste and improve cycle time efficiency of the
proposed production flow.
 Time: 60 Minutes
Process Analysis Exercise

Lean Six Sigma - pull system Training and implementation.pptx

  • 1.
    Lean Six Sigma ©2010 Lean 6 Solutions, Inc. All rights reserved. Pull System
  • 2.
    Lean Six Sigma ©2010 Lean 6 Solutions, Inc. All rights reserved. Types of Work Waste ValueAdded Necessary Waste Necessary Value Added  Lean places work into one of three categories.  The customer only cares about value-added work.  The majority of all work is usually in the waste category. Lean Categories of Work
  • 3.
    Lean Six Sigma ©2010 Lean 6 Solutions, Inc. All rights reserved.  Waste is anything in the process that uses time and resources but does not add value in the eyes of the customer.  Customers do not want to pay for the waste in a process.  Waste is inherent to all processes. What is Waste? The elimination of waste should be the goal of all individuals that are involved in the process.
  • 4.
    Lean Six Sigma ©2010 Lean 6 Solutions, Inc. All rights reserved. 1. Transportation (moving information from one place to another) 2. Inventory (information waiting to be processed) 3. Motion (excess movement and/or poor ergonomics) 4. Waiting (delays caused by missing information, approvals) 5. Overproduction (producing more than the next steps can process) 6. Overprocessing (generating more detail than the customer requires) 7. Defects/Rework (making and correcting mistakes) Remembered using the acronym T.I.M.W.O.O.D. The seven types of waste • Can you eliminate the step? • Can you simplify the step? • Can you combine it with another step?
  • 5.
    Lean Six Sigma ©2010 Lean 6 Solutions, Inc. All rights reserved. Categories of Waste Over Processing Over Production Transportation Waiting Inventory Defects (corrections) Excess Motion
  • 6.
    Lean Six Sigma ©2010 Lean 6 Solutions, Inc. All rights reserved. Definition: Redoing work because it was not done correctly the first time or did not meet customer expectations. Examples:  Recalculating mortgage insurance because wrong appraised value was given by the appraiser.  Re-assembling a manufactured part because a wrong component was used.  Re-delivering a restaurant customer’s drink order because it was made incorrectly. Defects (Corrections) Waste
  • 7.
    Lean Six Sigma ©2010 Lean 6 Solutions, Inc. All rights reserved. Examples Multiple managers approving an expense report. Excessive number of meetings Filling out additional paperwork to process a loan application. Multiple inspections of manufactured part. Creating reports that are never used. Definition: Work that does not enhance or positively alter the process or service outcome. Over Processing Waste
  • 8.
    Lean Six Sigma ©2010 Lean 6 Solutions, Inc. All rights reserved. Definition: Not being able to process your work because another process needs to complete their work. Examples  Waiting for someone to open an e-mail.  Waiting for a manager to make a decision.  Waiting for equipment to finish running an order.  Waiting for components in order to assemble a part.  Waiting for input from a co-worker before completing a task . Waiting Waste
  • 9.
    Lean Six Sigma ©2010 Lean 6 Solutions, Inc. All rights reserved. Definition: Carrying extra inventory beyond what is needed to meet customer demands. Examples  Purchasing more materials than are needed to satisfy the demands of the customer.  Waiting until sufficient work accumulates to begin working.  Ordering additional parts as a buffer against shortages. Excess Inventory Waste
  • 10.
    Lean Six Sigma ©2010 Lean 6 Solutions, Inc. All rights reserved. Definition: Worker movements or displacements that do not add value to the product or service. Examples  A filing system is unorganized and a person has to spend excessive time looking for files.  An assembly workstation is poorly designed and too many steps and movement are needed to do the work.  Accounting has to locate several files and databases to prepare a customer invoice. Excess Motion Waste
  • 11.
    Lean Six Sigma ©2010 Lean 6 Solutions, Inc. All rights reserved. Definition: Delivering more products or services than required; production or processing done at a faster rate than required to meet customer demand. Examples  Manufacturing excessive product based on a forecast.  Overestimating in the budgeting process.  Creating more reports than are necessary.  Ordering more parts than are necessary to fix equipment. Over Production Waste
  • 12.
    Lean Six Sigma ©2010 Lean 6 Solutions, Inc. All rights reserved. Definition: Movement and transportation of material, product, or information not absolutely necessary to meet customer requirements. Examples  Moving finished materials long distances for storage.  Back and forth mailing between departments to obtain authorization signatures.  Movement of materials from one operation to another.  Unloading material from a truck and placing in temporary storage before moving it to final storage. Transportation Waste
  • 13.
    Lean Six Sigma ©2010 Lean 6 Solutions, Inc. All rights reserved. Drivers of Waste Waste Waiting Over processing Overproduction Inventory Motion Transportation Defects Downtime Disorganization Overburden Excess Handoffs Uneven flow Ineffective layout Ineffective process Uneven flow Changeovers Ineffective layout Downtime Downtime Excess Handoffs Ineffective process Ineffective process Capacity constraint Unbalanced work Excess Handoffs Ineffective layout Changeovers Poor communication Poor Communication Changeovers Poor communication Uneven flow Capacity constraint
  • 14.
    Lean Six Sigma ©2010 Lean 6 Solutions, Inc. All rights reserved.  A resource that physically limits the process from meeting its objectives.  Any resource whose capacity is less than or equal to the demand placed upon it.  The resource constraint may be internal or external. Capacity Constraint
  • 15.
    Lean Six Sigma ©2010 Lean 6 Solutions, Inc. All rights reserved. Volume of work does not arrive is a steady rate.  End of quarter sales  All repair parts are returned at the end of the month  Shipping extra products to exceed end of the month goals  Batching work before sending it to the next process. Uneven Process Flow
  • 16.
    Lean Six Sigma ©2010 Lean 6 Solutions, Inc. All rights reserved. Large Batch Size  Processes with large batch sizes often contribute a lot of waste to the system.  Large batches create waiting time in the processes because all the work needs to be done before moving on the next step.  Large batches increase detection time for process errors because of the delays in getting to the next step.  Large batches increase levels of inventory.
  • 17.
    Lean Six Sigma ©2010 Lean 6 Solutions, Inc. All rights reserved.  The rate at which the process produces does not always meet the demand of the customer (internal or external customer).  Individual work areas can overproduce for their internal customers, while the overall process can still meet the demands of the external customer.  Excess items in queue (inventory) is a sign that a process is overproducing.  A process should be designed to produce at rate of customer demand. Producing at the Rate of Demand
  • 18.
    Lean Six Sigma ©2010 Lean 6 Solutions, Inc. All rights reserved. Takt Time - the time which synchronizes work or service required to customer demand. Takt time = Total Available Work Time Average Customer Demand What is Takt Time? Takt time is most easily applied to repetitive processes.
  • 19.
    Lean Six Sigma ©2010 Lean 6 Solutions, Inc. All rights reserved. Available Work Time Working Days Per Month 20 Shifts Per Day 3 Minutes Per Shift 480 Breaks (minutes) 60 Available Work Time 25200 Monthly Customer Demand Month Qty 25200 Jan 800 Feb 709 Mar 560 Apr 765 May 762 Jun 670 Jul 555 Average 689 Takt Time = 36.6 minutes/part = 689 (20*3*(480-60)) Takt Time Example
  • 20.
    Lean Six Sigma ©2010 Lean 6 Solutions, Inc. All rights reserved. Unbalanced Work Process steps that take varying amounts of cycle time to complete the work. Work in Process 22 min 45 min 18 min 20 min Cycle Time
  • 21.
    Lean Six Sigma ©2010 Lean 6 Solutions, Inc. All rights reserved. Line Balance Chart Step #1 Step #2 Step #3 Step #4 Takt Time Cycle Time  Each process step should be producing close to the takt time.  In this example, step 4 is out of balance with the rest of the steps. Process Step
  • 22.
    Lean Six Sigma ©2010 Lean 6 Solutions, Inc. All rights reserved. Line Balance Chart Step #1 Step #2 Step #3 Takt Time Cycle Time  Redistributing the work allows each step to be closer to the takt time.  In this example, the work was consolidated into three steps in order to operate the process at a lower cost. Process Step
  • 23.
    Lean Six Sigma ©2010 Lean 6 Solutions, Inc. All rights reserved. Overburdened People/Equipment  The overextension of the capacities of people and/or equipment.  When people or equipment is pushed beyond their natural limits waste often occurs (corrections, waiting, etc).  Examples - A group of people are worked long hours every day for multiple days to deliver a customer order. - A design engineer is always overbooked beyond her capacity - One piece of equipment is operated beyond its normal operating capabilities.
  • 24.
    Lean Six Sigma ©2010 Lean 6 Solutions, Inc. All rights reserved.  The majority of the cycle time in a process is waste.  Processes are made efficient by reducing total cycle time.  Total cycle time consists of process time and queue time. Cycle Time Reduction Value Added Waste Total Cycle Time
  • 25.
    Lean Six Sigma ©2010 Lean 6 Solutions, Inc. All rights reserved.  Processing 1% - 5% of total cycle time  Queue/Storage 70% - 80% of total cycle time  Transportation 10% of total cycle time  Inspection 5%-10% of total cycle time Typical Process Activities
  • 26.
    Lean Six Sigma ©2010 Lean 6 Solutions, Inc. All rights reserved.  Process Cycle Efficiency (PCE) is the percentage of value added work in the process.  Process Cycle Efficiency is the best measure of overall process health.  A process with low PCE will have a lot of non value-added work and great opportunities for cost reduction. Process Cycle Efficiency PCE = Value Added Time Total Cycle Time
  • 27.
    Lean Six Sigma ©2010 Lean 6 Solutions, Inc. All rights reserved.  Process analysis is a study of the current processes in order to identify delays, corrections, downtime, and other steps that don’t add value for the customer.  Work is divided into three categories: value-added, necessary, and waste.  Work that the customer does not care about is waste.  Waste types include: defects, over processing, excess motion, transportation, waiting, inventory, and overproduction.  Waste can be more easily understood by analyzing the drivers of waste. Summary
  • 28.
    Lean Six Sigma ©2010 Lean 6 Solutions, Inc. All rights reserved.  Producing and delivering the right goods and services in the right amount at just the right time.  All upstream and downstream processes are balanced and arranged into a perfect sequence, eliminating the need for excess inventories throughout the process. What is “Just in Time”
  • 29.
    Lean Six Sigma ©2010 Lean 6 Solutions, Inc. All rights reserved.  Just-in-Time” is a term that applies to the tools and methods that make value flow faster.  These tools are used to communicate customer demand up the product or service chain  Customer demand serves as the pull—the signal to make more.  Batch sizes are reduced, ideally to one, so that goods and services can flow more quickly. Just In Time
  • 30.
    Lean Six Sigma ©2010 Lean 6 Solutions, Inc. All rights reserved.  Developed by Toyota to meet the need for small quantity production in Japan.  Designed by Toyota executive Taiichi Ohno who observed, after visiting an American supermarket: - Consumers bought what they needed, as they needed it. - The products in the store were restocked after being taken off the shelf. Origins of JIT
  • 31.
    Lean Six Sigma ©2010 Lean 6 Solutions, Inc. All rights reserved.  Process flow examines the flow of product, material, and information through the process.  Continues through each step of production or processing, including the acquisition of raw materials or information.  Ends with the order and delivery of the finished product or service to meet customer needs. Process Flow
  • 32.
    Lean Six Sigma ©2010 Lean 6 Solutions, Inc. All rights reserved.  Products and services travel through the process without any interruptions; there is little to no queue time.  Continuous flow means that when a customer places an order there is trigger to obtain the raw materials needed just for that order.  As an item finishes being processed in one activity, it immediately starts being worked on in the next one.  Eliminating all wasted time and effort in the process in order to reduce total cycle time. What is Continuous Flow?
  • 33.
    Lean Six Sigma ©2010 Lean 6 Solutions, Inc. All rights reserved.  Easily exposes waste in the workplace.  Reduces inventory costs  Increases flexibility in meeting customer demands  Produces only what the customer orders  Shortens total cycle time.  Improves safety  Increases throughput to the customer because overproduction is reduced.  Improves morale because of increase value in work.  Reduces costs by quickly detecting defects to prevent additional in-process Benefits of Continuous Flow
  • 34.
    Lean Six Sigma ©2010 Lean 6 Solutions, Inc. All rights reserved.  Beginning a task, stopping and then putting the work aside because information or parts are not available.  Batching your work (waiting until you have a sufficient quantity) before forwarding it to the next step.  Managing a task multiple times when it could have been completed all at one time.  Capacity constraints in the process.  Imbalanced line What Interferes with Flow
  • 35.
    Lean Six Sigma ©2010 Lean 6 Solutions, Inc. All rights reserved. General Principle Example Don’t work with incomplete material or information Don’t assemble custom products until all components are available. Minimize batching and queuing Reduce the number of parts that are wound before they are moved to masking. Use one-touch flow Move masked rolls to spray without staging. Manufacturing Flow Examples
  • 36.
    Lean Six Sigma ©2010 Lean 6 Solutions, Inc. All rights reserved.  Organize people and equipment by similarity in function. - Economies of scale: squeeze out the most production at the lowest possible cost per unit. - Flexibility in scheduling to achieve high asset utilization.  Move products and services in large batches to eliminate trips and travel time.  Production schedules are created for each individual department in order to optimize equipment usage and utilize people. Traditional Mass Production
  • 37.
    Lean Six Sigma ©2010 Lean 6 Solutions, Inc. All rights reserved.  Processes create a lot of inventory which is not used to meet the actual demand of the customer.  Work may be slowed by being queued behind proceeding work, or shortages of material or information.  Local optimization of departmental processes that does not improve the end to end process. Traditional Mass Production
  • 38.
    Lean Six Sigma ©2010 Lean 6 Solutions, Inc. All rights reserved. Traditional System When a process completes its work, it delivers the product, service, or unit of work to a downstream process, where it is stored until needed. Pull System A process requests a product, service, or unit of work from an upstream process as it is required; there is no intermediate storage. A pull system should be used when continuous flow can not be achieved. What is a Pull System?
  • 39.
    Lean Six Sigma ©2010 Lean 6 Solutions, Inc. All rights reserved.  A system where an signal controls the flow of materials and information.  Resources are allocated based on actual consumption not a forecasted demand.  A pacemaker process sets the pace of production.  Scheduling of work is based on visual controls. What is a Pull System?
  • 40.
    Lean Six Sigma ©2010 Lean 6 Solutions, Inc. All rights reserved.  The pull system helps eliminate waste in the process: - Waste of overproduction - Waste of inventory  Pull systems also reduce uneven flow in the system and overburden on individual resources.  By analyzing process flow, you can identify bottlenecks, inefficiencies, and other obstacles to quality, which will reduce waste in the process. Benefits of Pull Systems
  • 41.
    Lean Six Sigma ©2010 Lean 6 Solutions, Inc. All rights reserved. 1 min Process A Process B Process C 9 min 3 min 27 min CT= 3 min/part CT = 1 min/part CT = 1 min/part 1 min  Using a batch size of 10, the first unit will take 41 minutes to pass through the entire process.  The majority of the time is spent in queue waiting for the other units to be produced. Cycle Time Queue Time Large Batch Sizes
  • 42.
    Lean Six Sigma ©2010 Lean 6 Solutions, Inc. All rights reserved. 1 min Process A Process B Process C 0 min 3 min 0 min 1 min  Using a batch size of 1, the first unit will take 5 minutes to pass through the entire process.  The entire order will also take less time because the next operation can be working on units, instead of waiting for them. Cycle Time Queue Time Small Batch Sizes CT = 1 min/part CT= 3 min/part CT = 1 min/part
  • 43.
    Lean Six Sigma ©2010 Lean 6 Solutions, Inc. All rights reserved.  It is a visual signal that tells the an operation how much to produce and when to stop.  A kanban system controls production to replenish consumed product.  In a kanban environment a product or service is produced when a signal to produce has been sent from the upstream process.  A kanban system replaces traditional daily or weekly production schedules. What is a Kanban?
  • 44.
    Lean Six Sigma ©2010 Lean 6 Solutions, Inc. All rights reserved. There are two basic types of Kanban: 1. In-Process Kanban: A visual signal to pace the movement of products in a flow process. 2. Material Kanban: A visual signal to replenish consumed material in a lean production process. Types of Kanban?
  • 45.
    Lean Six Sigma ©2010 Lean 6 Solutions, Inc. All rights reserved.  When material runs out, an operator brings a kanban card to the material storage area.  Someone replenishes the material at the production area.  There are three types of material kanbans: - Supplier Kanbans - Production Kanbans - Withdrawal Kanbans Material Kanban
  • 46.
    Lean Six Sigma ©2010 Lean 6 Solutions, Inc. All rights reserved.  Operators maintain a maximum number of units as in- process work, while working on one unit at their station.  After a unit is pulled out of the in-process work, they begin to work on another one at their station. In-Process Kanban
  • 47.
    Lean Six Sigma ©2010 Lean 6 Solutions, Inc. All rights reserved.  When one bin is empty, it is a signal for to have the bin replenished by the upstream process.  The bins are sized such that the 2nd bin will never be empty before the 1st bin has been replenished. Full Full Time Full Empty Signal sent to fill empty container Partial One container in use while other is filled Empty Full Signal sent to fill empty container Partial One container in use while other is filled Two-bin Kanban
  • 48.
    Lean Six Sigma ©2010 Lean 6 Solutions, Inc. All rights reserved. 1. The downstream process pulls from the upstream process only what is needed. 2. The upstream process makes only what is needed to replenish what the downstream process used. 3. Defects are never sent to the next process. 4. Kanban cards are always kept with the product. 5. A kanban system will help identify waste in the process. Rules of Kanban
  • 49.
    Lean Six Sigma ©2010 Lean 6 Solutions, Inc. All rights reserved.  The quantity of parts in each bin of a 2-bin kanban is calculated by the following formula:  Kanban quantity = (time to refill bin) X (# parts required during that time) + safety buffer,  2 bin-kanban systems are easy to manage.  Requires a steady demand for your product. Kanban Quantities
  • 50.
    Lean Six Sigma ©2010 Lean 6 Solutions, Inc. All rights reserved.  A strategically located inventory of parts, which protects the process against part shortages caused by variable demand.  A multi-bin kanban creates a “pull signal” every time a bin is withdrawn, whereas a supermarket creates a “pull signal” at a pre-defined level. What is a Supermarket?
  • 51.
    Lean Six Sigma ©2010 Lean 6 Solutions, Inc. All rights reserved.  Place it close to the point of use.  Ensure that it is centrally located in the facility for ease of retrieval.  Locate them in locations where it facilitates First-in-first-out. Locating a Supermarket
  • 52.
    Lean Six Sigma ©2010 Lean 6 Solutions, Inc. All rights reserved. Water Spider – Milk Runs • Water Spider (Bus Route vs. Cab) – Continual route that is repeated on a regular interval – Pick up and delivery at every bus stop – Rare to move without inventory • Milk Runs – Continual route of external pick up and deliveries, often from suppliers or outside services – The route is set at a certain pick up and delivery time
  • 53.
    Lean Six Sigma ©2010 Lean 6 Solutions, Inc. All rights reserved. Advantages of Routine Material Movement • Keep Regular VA workers at task • Supports pacing of operations • Simplifies the calculation of inventory required at each operations – cycle time of deliveries – 2 hours for water spider typically • Defects are caught quickly & easily communicated up stream • Keeps materials flowing through the system • Ties together operations that are not physically located together • Adds in maintaining FIFO
  • 54.
    Lean Six Sigma ©2010 Lean 6 Solutions, Inc. All rights reserved. Process Balance – Design Principles • Remove / Minimize NVA (conveyance, standby, and motion wastes) • Stabilize then minimize Cycle Time • Maximize resource efficiency • Minimize number of process steps • Balance tasks/labor across process steps • Maximize space utilization • Minimize takt variance
  • 55.
    Lean Six Sigma ©2010 Lean 6 Solutions, Inc. All rights reserved.  Purpose: Practice analyzing and improving a production flow.  Groupings: 4 teams, 2 companies each company will have 1 Sub-assembly and 1 assembly line, each team will have 5-6 people  Materials: Lego bricks  Exercise: Use the tools learned during the training to reduce waste and improve cycle time efficiency of the proposed production flow.  Time: 60 Minutes Process Analysis Exercise

Editor's Notes

  • #6 Scrap, mistakes, rework, and repair all fall into this category. Waste of correction requires excess processing and reduces capacity because resources are used up fixing errors rather than performing value-added work. Waste of correction permeates all areas of the enterprise: operations, maintenance, engineering, management, administrative, marketing, finance, accounting, etc.; there are no exceptions.
  • #13 The 7 types of waste are only symptoms of the problem. The problems have underlying causes. The following is a list of the most common types of causes for the 7 wastes. The team can be more specific in their identification of the waste. For example: Instead of identifying waiting as a waste the team can use: Equipment downtime, Long changeover, or unbalanced work as the cause of waste. When the team gets to the improve phase of the project it will be easier to identify a solution is the cause of the waste is known.
  • #18 Takt time is different than cycle time. Cycle time is the rate of a process, regardless of what the customer demand is. Takt time is based on what customer requires within a time period. . Takt time has the following benefits: Aligns internal work rate to customer demand Focuses awareness of customer demand Sets a standard rate that all employees can plan for and be measured against
  • #32 While the just-in-time philosophy is most easily visualized in manufacturing, the philosophy applies as well to most service and information businesses. While it is true that you cannot perform most services in advance, there are still many common practices that interfere with the flow of value.
  • #38 The idea behind a pull system is that downstream processes requests work from upstream processes. No products or services should be produced until they are needed downstream. Your customer requests the product from you, so you produce only what is needed. The customer downstream may be the process that follows you internally or the external customer who buys the final product.