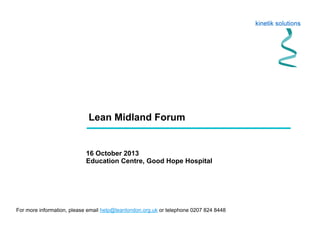
The Lean Midland Forum aims to:
1) Create an environment where Lean solutions in the NHS are shared and implemented.
2) Engage in a debate about the strengths and weaknesses of Lean methods in the current NHS climate.
3) Provide networking opportunities for colleagues.
The agenda includes presentations on improving infection control through Lean and effective use of statistical process control in the NHS. A hot seat session is also scheduled for questions.


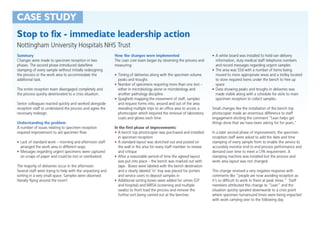


![The
two
types
of
mistake
Mistake
One
• InterpreOng
the
rouOne
variaOon
of
noise
as
if
it
amounted
to
a
signal
of
a
change
in
the
underlying
process,
thereby
sounding
a
false
alarm.
[false
posiOve]
Mistake
Two
• Thinking
that
a
signal
of
a
change
in
the
underlying
process
is
merely
the
noise
of
rouOne
variaOon,
thereby
missing
a
signal.
[false
negaOve]](https://image.slidesharecdn.com/leanmidland-presentation-161013-160120135147/85/Lean-midland-presentation-161013-36-320.jpg)