This document discusses the challenges of aging drinking water infrastructure in the United States, focusing on lead pipes as a particular issue. It estimates that $384 billion is needed to upgrade water systems by 2030. Lead pipes are a major problem, with over 3 million lines estimated in 1990. The EPA's Lead and Copper Rule requires testing for and addressing high lead levels, but its sampling methods may underestimate risks. Cities like Milwaukee face enormous costs to replace pipes but removing lines can increase lead levels without addressing private lines. The document examines Milwaukee as a case study and recommends updating policies and practices to better assess risks and replace all infrastructure to avoid health hazards.
S5c2 chapter 2-facts and figures related to irrigation.Shivu P
In this chapter some of the facts and figures related to rain fall, scarcity of drinking water and water for irrigation (drought), poor chemical quality of the bore well water and poor microbiological quality of the surface water due to water pollution, scarcity of electricity and the solutions for the same are mentioned.
The Philippines’ main sources of water are rivers, lakes, river basins, and groundwater reservoirs. The longest and largest river, Cagayan River, discharges approximately 53, 943 million cubic meters of water annually. Its groundwater reserves are 47, 895 million cubic meters replenished by rainfall and seepage from rivers and lakes. The lakes are utilized mainly for fish cultivation. The four major groundwater reservoirs are in Cagayan, Central Luzon, Agusan, and Cotabato. There are 438 major dams and 423 smaller dams.
The importance of groundwater surface water interaction - a case study on Rio...The Texas Network, LLC
Presented by Ronald T. Green, Ph.D., P.G., F. Paul Bertetti, P.G., and Marques Miller
at the Texas Water Conservation Association Conference in The Woodlands, Texas - March 2014
Piped, clean and safe water and waste water and sewerage treatment and disposal provision is challenge for the County Government of Mombasa. The Solution lies in having a seawater Desalination plant and modern Waste water and sewerage disposal plant, which saves the marine/ocean environment, protects ocean life from pollutants and reduces preventable diseases for the people of Mombasa.
We conducted a survey on the condition of Lakes in Bengaluru and here are our findings. Do take a look and take part in our Wake The Lake Campaign for helping out in improving the condition of the Lakes in our City. :)
Team United Way Bengaluru.
What is an urban Lake? How do I engage with my local lake? How do we work together to protect and rejuvenate our urban lake? Using Bangalore's example, and building on the work by many urban lake groups, citizens and Biome Environmental Trust, here is an introduction to urban lakes and how we as citizens can engage with our common pool urban natural resources. For more information, contact water@biome-solutions.com.
Water issues of Mumbai city from the perspective of the local municipal authority in charges of supply and distribution to the city. Challenges and solutions to meeting the increasing demand for water and dealing with distribution losses among other problems.
Sydney’s Water - Grey water, Water efficiency programs, Desalination Plant an...Biocity Studio
Sydney’s water demand is currently met by 11 major damns, recycled water and water pumped from the Shoalhaven River. Warragamba dam provides Sydney with 80% of Sydney drinking water supply. Sydney’s high demand for water has forced the NSW Government to come up with a Metropolitan Plan for Sydney, by creating more Grey water, Water efficiency programs, Desalination Plant and early lead detection.
Sydney’s Water Sustainability | Biocity StudioBiocity Studio
According to the CSIRO Sydney rainfall will decrease by 3% while population will increase, amounting to an increase of 20% more water by 2030. Currently Sydney is recycling 25 billion litres per year; by 2015 we will be recycling up to 70 million litres. 12% of Sydney’s water usage will be recycled water.
Better Builder Magazine brings together premium product manufactures and leading builders to create better differentiated homes and buildings that use less energy, save water and reduce our impact on the environment. The magazine is published four times a year.
Here’s how to use Facebook to build relationships, find new followers, and market your agency more effectively. The Super Zinggs Has mentioned some useful ideas which surely going to be helps you. For more details visit our website or contact us (951) 757-0681
#PESQUISA365 - Pesquisa de Opinião - Manaus - Fevereiro/2017Durango Duarte
Objetivo: identificar qual a praça mais bonita de Manaus, qual a avenida/rua mais importante de Manaus, qual o melhor ponto turístico de Manaus e qual empresa melhor representaria o Amazonas no Brasil.
Metodologia e período de realização da pesquisa: Pesquisa quantitativa descritiva através de uma amostragem probabilística e aleatória por área. A coleta de dados ocorreu nos dias 01, 02 e 03 de fevereiro de 2017.
Tamanho da amostra: Foram realizadas 1.100 (mil e cem) entrevistas.
Margem de erro e grau de confiabilidade: A margem de erro de 3,0% para mais ou para menos, com um grau de confiabilidade de 95%. Isso significa que se fossem feitas 100 entrevistas com a mesma metodologia, 95 estariam dentro da margem de erro prevista.
ICLR Friday Forum: Diagnosing and reducing basement flooding in existing and ...glennmcgillivray
On September 15, 2017, ICLR hosted a Webinar entitled 'Diagnosing and Reducing Basement Flood Risk in New and Existing Homes', led by Norton Engineering's Barbara Robinson. Clean water (Inflow and Infiltration (I/I)) is currently entering brand new sewer systems (both on public and private property) at an unacceptable rate across North America. This clean water reduces the capacity of sewers to convey large storms, constraining new development, and impacting already taxed downstream infrastructure, all of which are costly.
Barbara Robinson, M.A.Sc., P.Eng., from Norton Engineering discussed an ongoing project supported by ICLR to examine unacceptable levels of I/I entering brand new sewer systems, understand the complexities behind this issue and to develop measures to prevent it. Issues with the Ontario (and National) Building Codes that are directly impacting the amount of I/I entering new sewers on private property, was also discussed. Norton & ICLR staff’s leadership on the development of a new CSA Guideline for Basement Flood Protection, which looks at the mandatory implementation of protective plumbing measures & other lot level measures in both new and existing infrastructure, including minimizing the development of I/I, was also showcased. As part of a longer-term research project, Norton is working with ICLR and some private insurers on a research project to find ways to cross reference engineering data (included flow monitoring), either owned privately by the municipality, or other public data not normally accessible to insurance companies, to help more accurately assign risk of flooding and help residents to mitigate flooding on their property where it is at higher risk. Barbara has spent her career focused on the Environmental Assessment, predesign, design and construction of a wide variety of municipal infrastructure, particularly sanitary sewers. She specializes in projects to identify and remove rainwater and groundwater (inflow and infiltration) from existing sanitary sewer systems. She has spent many years in the field, inspecting new and existing sanitary sewer installations, private property and basement plumbing and installation, and has undertaken confined space entry of thousands of manholes and large sewers. Her clients include the Township of Woolwich, Region of York, Region of Peel, City of Windsor, City of London, and a wide variety of private consultants.
Competitive bidding for pipes Demonstrates Significant Local Cost SavingsManishPatel169454
American cities, adopting the use of advanced technology and better approaches to clean water and sewer are common and often required by law. Cities providing public water delivery have not only grown in population size and in number, but also in their attitudes toward public health, and innovations involving system
designs, technologies and accepted practices. In the 19th century cast iron was added to the common use of clay, lead and wooden pipes by cities to convey water and wastewater. In the 20th century, continued innovation carried ductile iron, concrete
and cement, and plastic pipes into the market. In the 21st century, new generations of plastics, advanced composites, and other materials are being added to a long list of
viable piping materials. Technological advancements in pipe materials have helped to support a growing national population while continuing to improve on cost and performance and achieve public health protection goals to guard against waterborne
parasites and toxic contaminants.
municipal procurement competitive bidding for pipes demonstrates significant ...ManishPatel169454
In 2013 the Mayors Water Council (MWC) released “Municipal Procurement: Procurement Process Improvements Yield Cost-Effective Public Benefits”, a report examining procurement practices in the water infrastructure sector. The report made a business case for considering alternative pipe material so local governments could realize public benefits (e.g., cost, performance, safety). The report suggested the need to change outdated procurement policies, and that the biggest impediment to adopting these changes stemmed from the reluctance of local procurement officials to break from convention.This report presents information from new research that demonstrates the merits of adopting open procurement policies and new practices that apply competitive consideration of alternative pipe materials. These policies will help local officials maximize
resources and practice good governance.
The Hidden Danger of Failing Water InfrastructureDaniel Guest
America’s water infrastructure is in a state of crisis. Both our water and our wastewater pipeline systems are in disrepair. In fact, the American Society for Civil Engineers (“ASCE”), a preeminent, respected authority on structural systems reliability and maintenance management, grades the condition of today’s drinking water infrastructure a D. What is more, the ASCE also gives the score of D to our wastewater infrastructure. A “D” is not a good place to be.
Concerns for Quarry Pits in regards to groundwater resources in Brant County. Looking at geological and economic risks and the need to protect water and farmland.
Similar to Lead Infrastructure Policy Brief - Siwula (20)
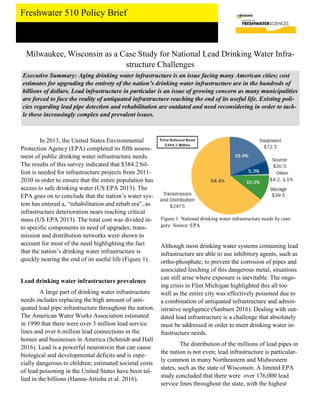
1. Freshwater 510 Policy Brief
Milwaukee, Wisconsin as a Case Study for National Lead Drinking Water Infra-
structure Challenges
Executive Summary: Aging drinking water infrastructure is an issue facing many American cities; cost
estimates for upgrading the entirety of the nation’s drinking water infrastructure are in the hundreds of
billions of dollars. Lead infrastructure in particular is an issue of growing concern as many municipalities
are forced to face the reality of antiquated infrastructure reaching the end of its useful life. Existing poli-
cies regarding lead pipe detection and rehabilitation are outdated and need reconsidering in order to tack-
le these increasingly complex and prevalent issues.
In 2013, the United States Environmental
Protection Agency (EPA) completed its fifth assess-
ment of public drinking water infrastructure needs.
The results of this survey indicated that $384.2 bil-
lion is needed for infrastructure projects from 2011-
2030 in order to ensure that the entire population has
access to safe drinking water (US EPA 2013). The
EPA goes on to conclude that the nation’s water sys-
tem has entered a, “rehabilitation and rehab era”, as
infrastructure deterioration nears reaching critical
mass (US EPA 2013). The total cost was divided in-
to specific components in need of upgrades; trans-
mission and distribution networks were shown to
account for most of the need highlighting the fact
that the nation’s drinking water infrastructure is
quickly nearing the end of its useful life (Figure 1).
Lead drinking water infrastructure prevalence
A large part of drinking water infrastructure
needs includes replacing the high amount of anti-
quated lead pipe infrastructure throughout the nation.
The American Water Works Association estimated
in 1990 that there were over 3 million lead service
lines and over 6 million lead connections in the
homes and businesses in America (Schmidt and Hall
2016). Lead is a powerful neurotoxin that can cause
biological and developmental deficits and is espe-
cially dangerous to children; estimated societal costs
of lead poisoning in the United States have been tal-
lied in the billions (Hanna-Attisha et al. 2016).
Although most drinking water systems containing lead
infrastructure are able to use inhibitory agents, such as
ortho-phosphate, to prevent the corrosion of pipes and
associated leeching of this dangerous metal, situations
can still arise where exposure is inevitable. The ongo-
ing crisis in Flint Michigan highlighted this all too
well as the entire city was effectively poisoned due to
a combination of antiquated infrastructure and admin-
istrative negligence (Sanburn 2016). Dealing with out-
dated lead infrastructure is a challenge that absolutely
must be addressed in order to meet drinking water in-
frastructure needs.
The distribution of the millions of lead pipes in
the nation is not even; lead infrastructure is particular-
ly common in many Northeastern and Midwestern
states, such as the state of Wisconsin. A limited EPA
study concluded that there were over 176,000 lead
service lines throughout the state, with the highest
Figure 1. National drinking water infrastructure needs by cate-
gory. Source: EPA
2. Freshwater 510 Policy Brief
numbers in the more urban areas such as Mil-
waukee, Wausau, and Racine (Schmidt and Hall
2016). Milwaukee alone accounts for around
77,000 of these lead service lines and faces a
$500 million bill in order to remove all of them
(Behm 2016) (Figure 2). The city does use ortho
-phosphate inhibitory agents to prevent lead
from leeching, but this practice can have ramifi-
cations in terms of water quality in surrounding
areas, in this case Lake Michigan (Schmidt and
Hall 2016). There is also the risk for catastrophic
failure of the antiquated lead pipes, which has
prompted the Wisconsin Public Works Commis-
sion to put pressure on Milwaukee in the past to
increase its yearly rate of lead pipe removal
(Behm 2014).
Figure 2. Prevalence of lead drinking water infrastructure
in Milwaukee, WI. Source: Milwaukee Public Works
Department
Current policy for lead infrastructure
The majority of the current policy regarding lead
infrastructure replacement stems from the federal Lead and
Copper Rule. An EPA regulation enacted in 1991, the Lead
and Copper Rule requires water system administrators to
regularly test customers taps for levels of lead and copper.
If lead levels are in excess of 15 parts per billion (ppb) in
more than 10% of homes surveyed, then anti-corrosion
measures must be applied to prevent leeching (EPA Lead
and Copper Rule). However, the requirements for conduct-
ing surveys to detect the presence of these metals seems to
fall short of truly meeting the goals set out in the Lead and
Copper Rule. Due to a history of compliance, Milwaukee is
currently on a reduced surveying schedule and only has to
test for lead in 50 homes throughout the city every three
years (Schmidt and Hall 2016). Only surveying 50 homes
seems as if it would give a gross misrepresentation of the
prevalence of lead in the city considering that nearly
600,000 people call Milwaukee home. Furthermore, the
sampling protocol for the rule was evaluated and found to
consistently miss high levels of lead due to daily fluctua-
tions in homes serviced by lead lines (Del Toral et al.
2013). Lastly, the Lead and Copper Rule allows for 10% of
homes to be in excess of the 15 ppb cutoff. This means that
even though the city may be in compliance, there will still
be members of the population exposed to elevated levels of
lead in their drinking water. This is particularly disturbing
considering that the Safe Drinking Water Act’s (SDWA)
maximum contaminant level goal (MCLG), or contaminant
level at which there are no known health effects, for lead is
zero (EPA Table of Regulated Drinking Water Contami-
nants). While well intentioned, the Lead and Copper Rule
could use updating in order to adequately assess where lead
contamination may be prevalent as well as to keep the en-
tire population safe from the toxic effects of exposure.
If the aforementioned corrosion measures required
by the Lead and Copper Rule are ineffective or compliance
is breached further, then a municipality could be required to
increase its replacement rate of lead infrastructure, which
brings additional challenges (Schmidt and Hall 2016).
3. Freshwater 510 Policy Brief
Lead pipes in cities are found in both the large
water mains as well as the smaller service lines
that branch off of these mains and cross individ-
ual property lines to serve individual homes and
businesses. Municipal lead removal projects are
only able to focus on the portion of the infra-
structure that is owned by the utility, which ex-
tends only to the property line (Schmidt and Hall
2016). When the utility removes these mains but
leaves the lead lateral service lines intact, there
are two main issues that arise. The first is that
the lead lateral service lines remain which makes
the removal of the main almost superfluous in
terms of preventing lead from getting into the
water supply. Second, it has been shown that
removal of lead mains in neighborhoods that al-
so have lead service lines causes contamination
and extremely high levels of lead during the
construction process (Schmidt and Hall 2016)
(Del Toral et al. 2013). This predicament is what
prompted the city of Milwaukee to temporarily
pause its lead removal efforts while a plan is for-
mulated to address the issue before continuing
with water main replacement projects (Behm
2016). The Milwaukee County head of public
health, Paul Biedrzycki has commented on this
describing the situation as a tradeoff between
upgrading infrastructure and avoiding construc-
tion-induced lead contamination (Schmidt and
Hall 2016). It is clear that a new, integrative, and
well-thought out approach is needed in order to
safely replace both lead mains as well as lead
laterals without exacerbating lead contamination
problems.
Moving Forward
Updating the Lead and Copper Rule
seems as though it would provide a means to
better assess which communities have issues
with lead in their drinking water, as well as
where exactly in those communities to focus
replacement efforts. The present issues with sampling
schedule and technique illustrated by the Del Toral study
are disturbing in the sense that problems with lead drinking
water infrastructure could be underestimated (Del Toral et
al. 2013). In order to accurately assess the exact prevalence
of lead infrastructure in cities such as Milwaukee, surveys
should be expanded and combined with long-term monitor-
ing schedules. In this way, problematic areas can be more
easily defined and remediation efforts can be focused.
However, this type of approach has the potential to present
a trade-off scenario in which more resources may be ex-
pended only to find that there may not be as prevalent a
lead problem as previously anticipated. Fortunately, the
more data that is gathered regarding the exact location of
problematic lead infrastructure, the more accurate further
assessments and remediation projects will become.
The issues that arise from the practice of lead main
removal while lateral service lines remain are complex and
require a holistic approach to ensure that remediation ef-
forts are effective and not causing further fluxes of lead into
the water supply. Fortunately, there is a city near Milwau-
kee that was able to utilize such a holistic approach to re-
move virtually its entire lead infrastructure while minimiz-
ing complications. Beginning in 2001, Madison, WI entered
the construction phase of a decades-long lead removal pro-
ject in which they attempted to remove all of the lead mains
and laterals found throughout their city (Behm 2016).
Figure 3. A city of Madison crew works to replace a lead service line
leading into a private residence. Source: Wisconsin Watch
4. Freshwater 510 Policy Brief
References
Behm, Don. "Milwaukee Faces Daunting Costs with Lead Water Pipes." Milwaukee Faces Daunting Costs with Lead Water Pipes.
Milwaukee Journal Sentinel, 27 Jan. 2016. Web. 03 Mar. 2016.
Behm, Don. "Milwaukee Ordered to Step up pace of Water Main Replacement." Milwaukee Ordered to Step up pace of Water
Main Replacement. Milwaukee Journal Sentinel, 14 Sept. 2014. Web. 03 Mar. 2016.
Del Toral, Miguel A., Andrea Porter, and Michael R. Schock. "Detection and evaluation of elevated lead release from service
lines: a field study." Environmental science & technology 47.16 (2013): 9300-9307.
Hanna-Attisha, Mona, et al. "Elevated blood lead levels in children associated with the Flint drinking water crisis: a spatial analy-
sis of risk and public health response." American journal of public health 0 (2016): e1-e8.
"Lead and Copper Rule." EPA. Environmental Protection Agency, n.d. Web. 03 Mar. 2016.
"Table of Regulated Drinking Water Contaminants." EPA. Environmental Protection Agency, n.d. Web. 03 Mar. 2016.
Sanburn, Josh. "The Toxic Tap." Time 1 Feb. 2016: 32-39. Web.
Schmidt, Silke, and Dee Hall. "Lead Pipes, Antiquated Law Threaten Wisconsin's Drinking Water Quality." WisconsinWatchorg.
Wisconsin Watch, 01 Feb. 2016. Web. 03 Mar. 2016.
Schmidt, Silke. "First in the Nation: City of Madison Replaced All Lead Pipes." WisconsinWatchorg. Wisconsin Watch, 01 Feb.
2016. Web. 03 Mar. 2016.
United States of America. Environmental Protection Agency. Office of Water. Drinking Water Infrastructure Needs Survey and
Assessment: Fifth Report to Congress. Washington D.C. 2013. Print.
The impetus for this project was largely to avoid
eutrophication issues for the two large lakes sur-
rounding the city that could arise due to the use
of ortho-phosphate inhibitory agents (Schmidt
2016). Madison was able to achieve their goal of
removing all lead infrastructure by providing a
monetary incentive program for private property
owners to work with the utility to incorporate
lateral service line replacement during main re-
placement projects (Behm 2016). In this way,
they were able to solve the problem of laterals
remaining after lead replacement as well as the
construction-based lead flux issues all at once.
While Madison is significantly smaller than Mil-
waukee and had less lead infrastructure preva-
lence, their approach can serve as a useful model
from which to model Milwaukee’s own lead in-
frastructure replacement program.
Conclusion
The fact that the United States’ drinking water
infrastructure is nearing the end of its useful life has
been highlighted by studies from government agencies,
by the recent crisis in Flint, Michigan, as well as by the
struggles municipalities are experiencing in regards to
coming to terms with how to tackle these increasingly
complex problems. Unfortunately, antiquated 20th
cen-
tury infrastructure is currently paired with antiquated
20th
century-based surveying and rehabilitation policies
and practices. Moving forward, these policies and prac-
tices will need to be modernized in order to address the
drinking water infrastructure issues of the 21st
century.
Modernization will be the first step towards continuing
universal access to clean drinking water for all.