Download to read offline
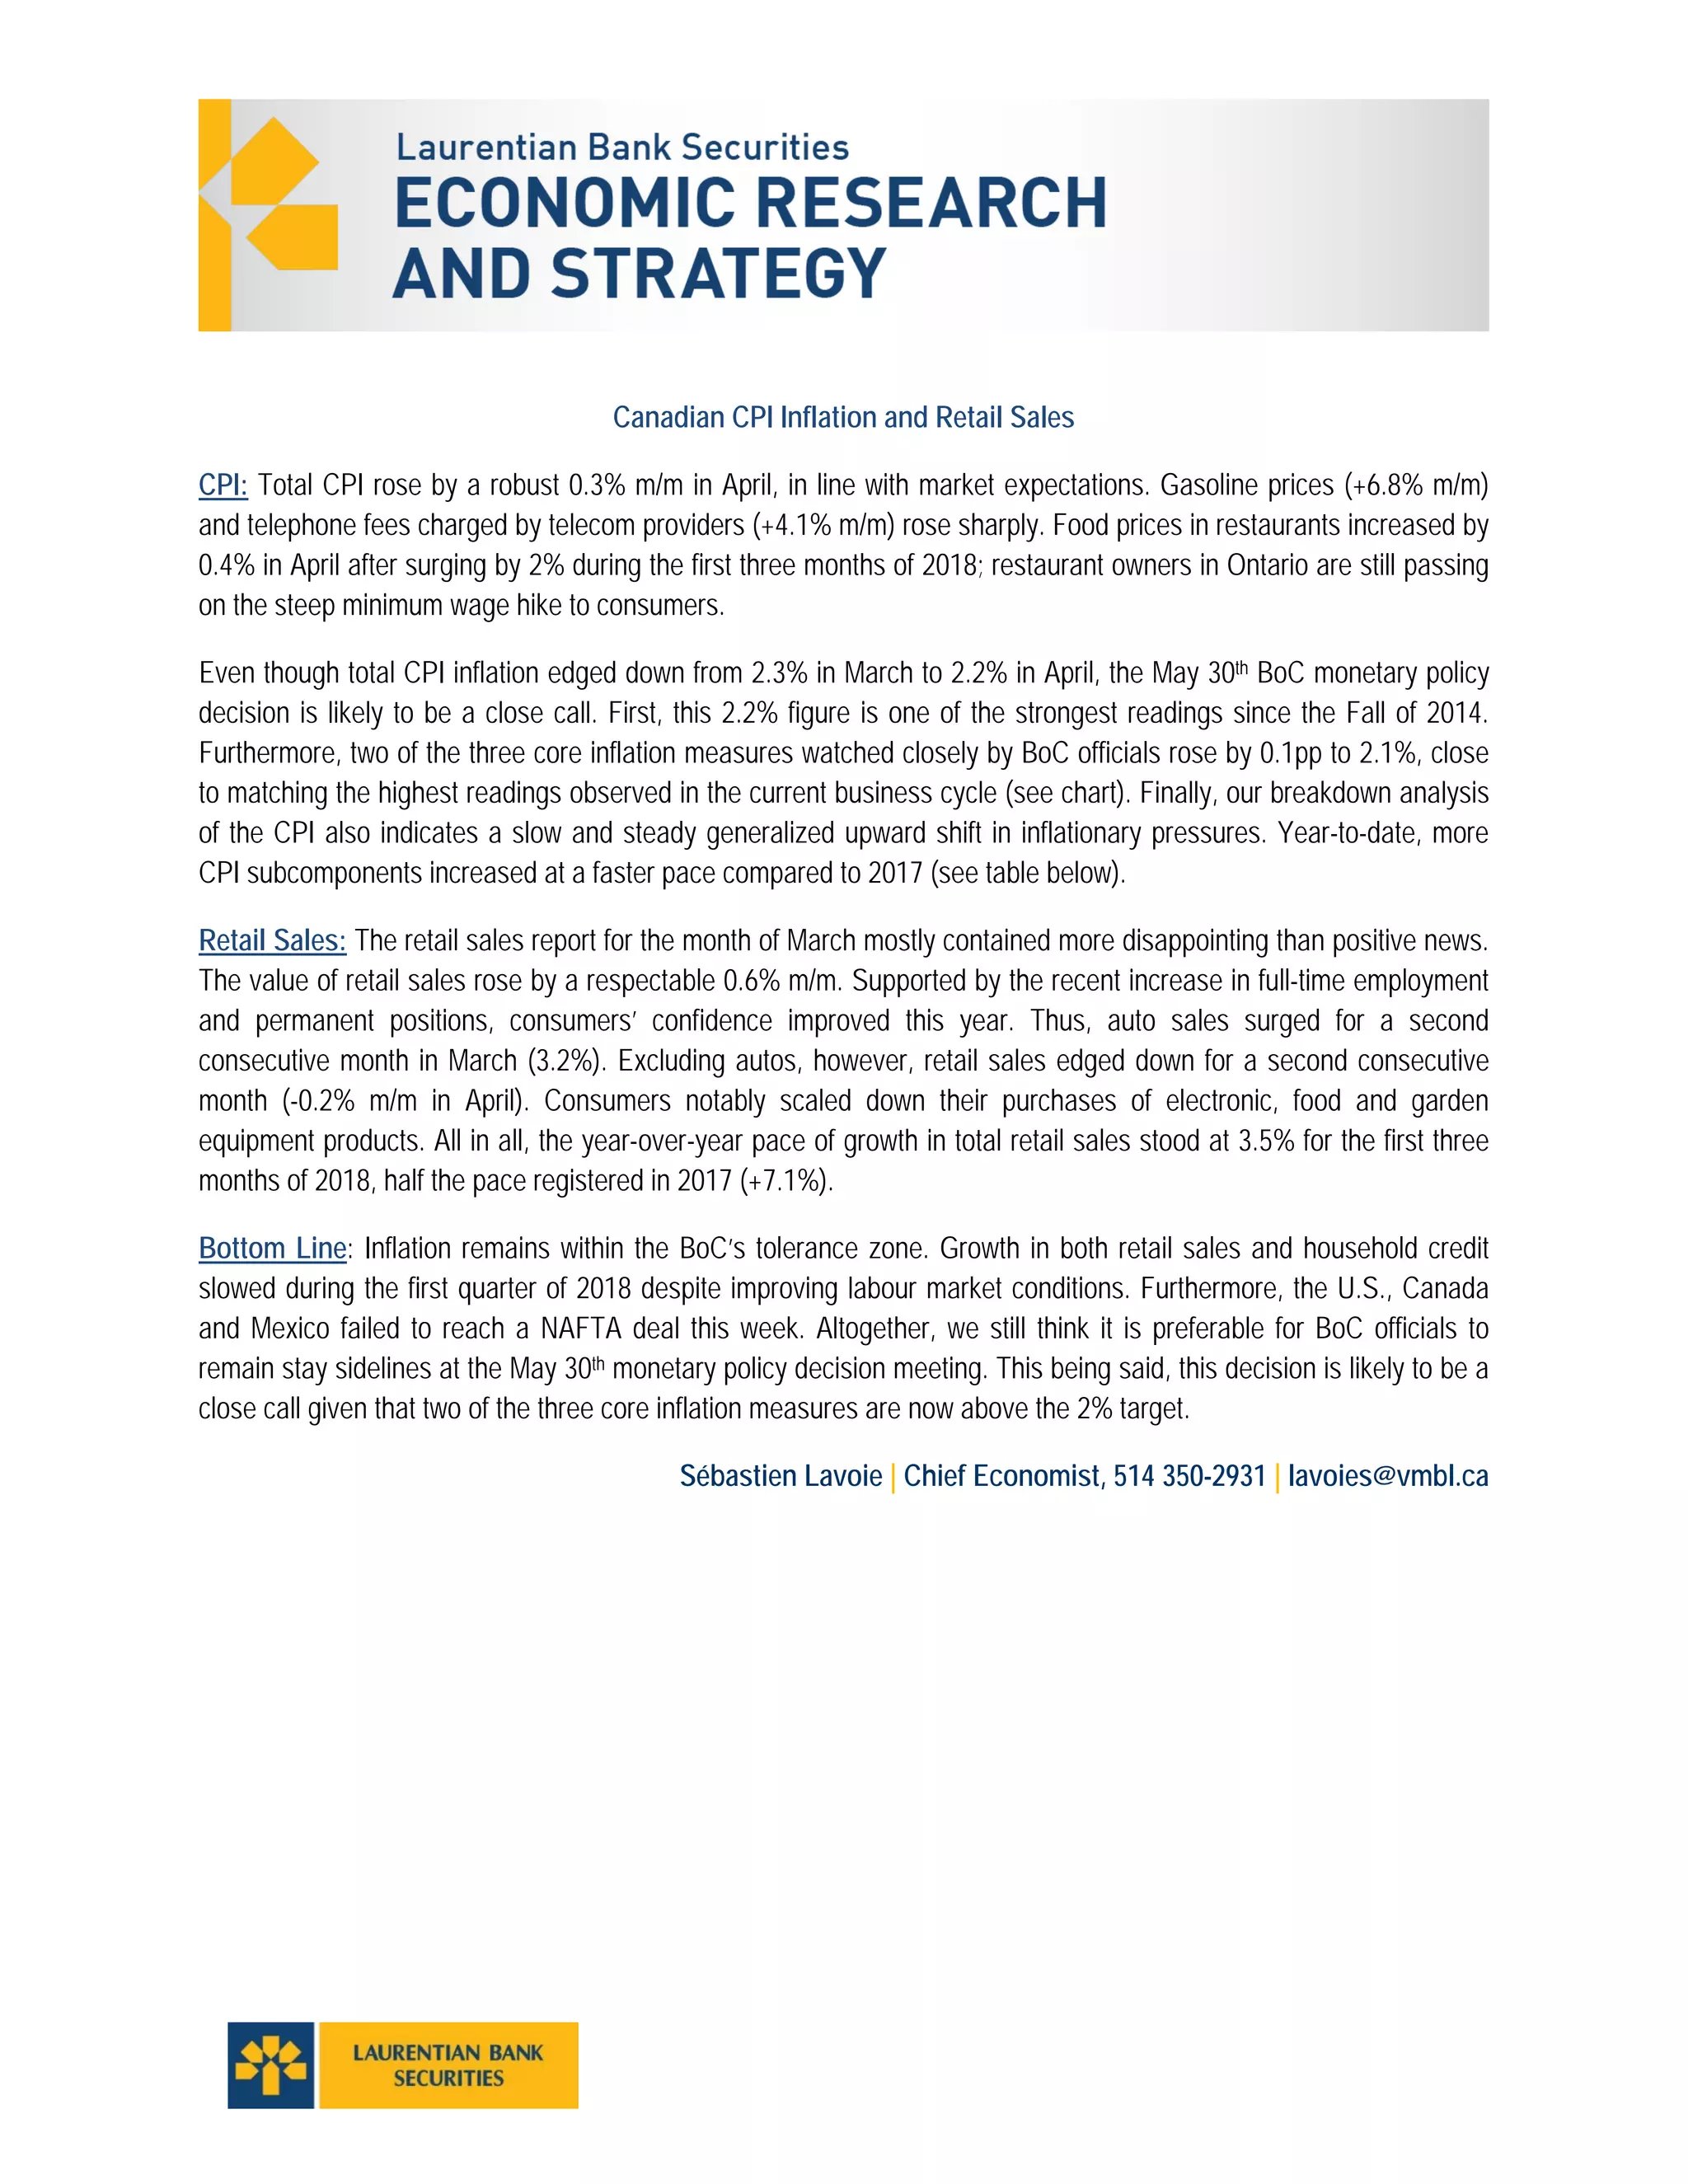
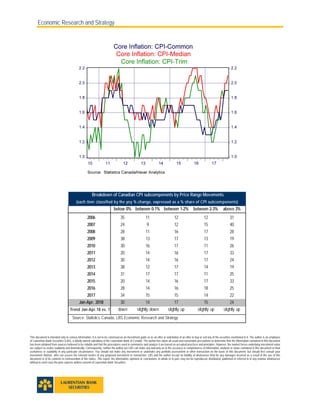

In April, Canada's total CPI rose by 0.3% month-over-month, mainly driven by increases in gasoline prices and telephone fees, leading to a slight decrease in annual inflation from 2.3% to 2.2%. Retail sales showed a modest 0.6% increase in March, buoyed by improved consumer confidence, though sales excluding autos declined for the second month. The Bank of Canada's upcoming monetary policy decision is expected to be close, as two out of three core inflation measures are above the 2% target despite slowing credit growth.


