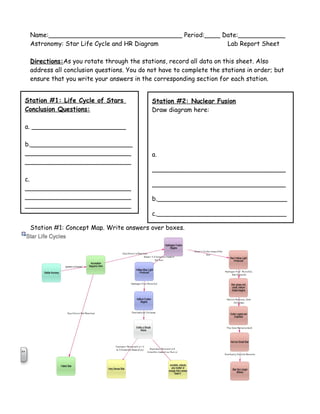
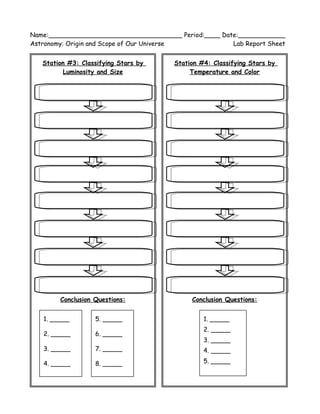
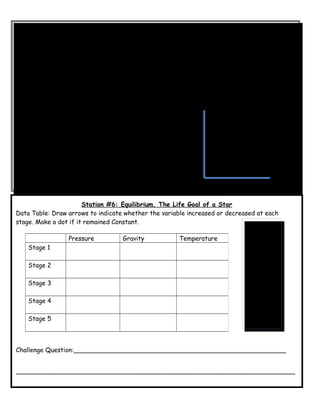
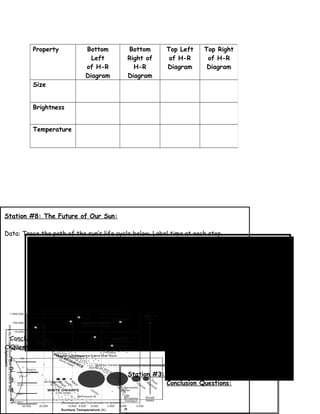
Station #2: Nuclear Fusion
Draw diagram here:
a.
__________________________________
__________________________________
b._________________________________
c._________________________________
Name:__________________________________ Period:____ Date:____________
Astronomy: Star Life Cycle and HR Diagram Lab Report Sheet
Directions:As you rotate through the stations, record all data on this sheet. Also
address all conclusion questions. You do not have to complete the stations in order; but
ensure that you write your answers in the corresponding section for each station.
Station #1: Concept Map. Write answers over boxes.
Station #1: Life Cycle of Stars
Conclusion Questions:
a. ________________________
b.__________________________
___________________________
___________________________
c.
___________________________
___________________________
___________________________
Station #4: Classifying Stars by
Temperature and Color
Conclusion Questions:
Our
Name:__________________________________ Period:____ Date:____________
Astronomy: Origin and Scope of Our Universe Lab Report Sheet
1. _____
2. _____
3. _____
4. _____
5. _____
Station #3: Classifying Stars by
Luminosity and Size
Conclusion Questions:
5. _____
6. _____
7. _____
8. _____
1. _____
2. _____
3. _____
4. _____
Pressure Gravity Temperature
Stage 1
Stage 2
Stage 3
Stage 4
Stage 5
Station #6: Equilibrium, The Life Goal of a Star
Data Table: Draw arrows to indicate whether the variable increased or decreased at each
stage. Make a dot if it remained Constant.
Challenge Question:______________________________________________________
_______________________________________________________________________
_________________
Station #5: Interactive H-R Diagram
Star Temperature Brightness
Betelgeuse
Vega
Our Sun
Centauri B
Sirius B
Challenge Questions:
a. _______________________________
_________________________________
_________________________________
b. _______________________________
Conclusion
Questions:
a) ____
b) ____
c) ____
d) ____
e) ____
f) ____
g) ____
Station # 7: Light Up H-R Diagram: Conclusion
Questions
Station #8: The Future of Our Sun:
Data: Trace the path of the sun’s life cycle below. Label time at each stop.
Challenge Question:
Property Bottom
Left
of H-R
Diagram
Bottom
Right of
H-R
Diagram
Top Left
of H-R
Diagram
Top Right
of H-R
Diagram
Size
Brightness
Temperature
Station #3: Doppler Effect Computer Program
Conclusion Questions:
a._________________________________
1. _____
2. _____
3. _____
4. _____
5. _____
6. _____
7. _____
8. _____
9. _____
10. _____
Conclusion
Questions:
1. _____
2. _____
3. _____
4. _____
5. _____

Lab report sheet

  • 1.
    Station #2: NuclearFusion Draw diagram here: a. __________________________________ __________________________________ b._________________________________ c._________________________________ Name:__________________________________ Period:____ Date:____________ Astronomy: Star Life Cycle and HR Diagram Lab Report Sheet Directions:As you rotate through the stations, record all data on this sheet. Also address all conclusion questions. You do not have to complete the stations in order; but ensure that you write your answers in the corresponding section for each station. Station #1: Concept Map. Write answers over boxes. Station #1: Life Cycle of Stars Conclusion Questions: a. ________________________ b.__________________________ ___________________________ ___________________________ c. ___________________________ ___________________________ ___________________________
  • 2.
    Station #4: ClassifyingStars by Temperature and Color Conclusion Questions: Our Name:__________________________________ Period:____ Date:____________ Astronomy: Origin and Scope of Our Universe Lab Report Sheet 1. _____ 2. _____ 3. _____ 4. _____ 5. _____ Station #3: Classifying Stars by Luminosity and Size Conclusion Questions: 5. _____ 6. _____ 7. _____ 8. _____ 1. _____ 2. _____ 3. _____ 4. _____
  • 3.
    Pressure Gravity Temperature Stage1 Stage 2 Stage 3 Stage 4 Stage 5 Station #6: Equilibrium, The Life Goal of a Star Data Table: Draw arrows to indicate whether the variable increased or decreased at each stage. Make a dot if it remained Constant. Challenge Question:______________________________________________________ _______________________________________________________________________ _________________ Station #5: Interactive H-R Diagram Star Temperature Brightness Betelgeuse Vega Our Sun Centauri B Sirius B Challenge Questions: a. _______________________________ _________________________________ _________________________________ b. _______________________________ Conclusion Questions: a) ____ b) ____ c) ____ d) ____ e) ____ f) ____ g) ____
  • 4.
    Station # 7:Light Up H-R Diagram: Conclusion Questions Station #8: The Future of Our Sun: Data: Trace the path of the sun’s life cycle below. Label time at each stop. Challenge Question: Property Bottom Left of H-R Diagram Bottom Right of H-R Diagram Top Left of H-R Diagram Top Right of H-R Diagram Size Brightness Temperature Station #3: Doppler Effect Computer Program Conclusion Questions: a._________________________________ 1. _____ 2. _____ 3. _____ 4. _____ 5. _____ 6. _____ 7. _____ 8. _____ 9. _____ 10. _____ Conclusion Questions: 1. _____ 2. _____ 3. _____ 4. _____ 5. _____