Download free for 30 days
Sign in
Upload
Language (EN)
Support
Business
Mobile
Social Media
Marketing
Technology
Art & Photos
Career
Design
Education
Presentations & Public Speaking
Government & Nonprofit
Healthcare
Internet
Law
Leadership & Management
Automotive
Engineering
Software
Recruiting & HR
Retail
Sales
Services
Science
Small Business & Entrepreneurship
Food
Environment
Economy & Finance
Data & Analytics
Investor Relations
Sports
Spiritual
News & Politics
Travel
Self Improvement
Real Estate
Entertainment & Humor
Health & Medicine
Devices & Hardware
Lifestyle
Change Language
Language
English
Español
Português
Français
Deutsche
Cancel
Save
Submit search
EN
Uploaded by
Ismail Sultan
54 views
L03-ProjectManagement ProjectManagement.pdf
L03-ProjectManagement ProjectManagement.pdf
Engineering
◦
Read more
0
Save
Share
Embed
Embed presentation
Download
Download to read offline
1
/ 4
2
/ 4
3
/ 4
4
/ 4
More Related Content
PDF
MG6088 SOFTWARE PROJECT MANAGEMENT
by
Kathirvel Ayyaswamy
PPT
Spm
by
Suresh Kumar
PPT
Risk management
by
tumetr1
PPT
Unit 7
by
anuragmbst
PPT
Business_5-JLang.ppt
by
NanoSana
PPT
Business_5-JLang (1).ppt
by
Laxmikant Bhandare
PPT
Business_5-JLang.ppt
by
Purushottam Pawar
PPT
Business_5-JLang.ppt
by
NanOo7
MG6088 SOFTWARE PROJECT MANAGEMENT
by
Kathirvel Ayyaswamy
Spm
by
Suresh Kumar
Risk management
by
tumetr1
Unit 7
by
anuragmbst
Business_5-JLang.ppt
by
NanoSana
Business_5-JLang (1).ppt
by
Laxmikant Bhandare
Business_5-JLang.ppt
by
Purushottam Pawar
Business_5-JLang.ppt
by
NanOo7
Similar to L03-ProjectManagement ProjectManagement.pdf
PPT
PROJECT MANAGEMENT
by
Seif Shaame
PPT
Software Project Management lecture 7
by
Syed Muhammad Hammad
PPT
Process Quality Management, Human Resources, Quality Assurance
by
Reem Alattas
PPT
9 project planning
by
randhirlpu
PDF
SE_Chapterrrrrrrrrrrrrrrrrrrrrrrrrr3.pdf
by
timoemin50
PDF
MG6088 SOFTWARE PROJECT MANAGEMENT
by
Kathirvel Ayyaswamy
PPT
Spm
by
Suresh Kumar
PDF
spm-uniti-201022085737.pdf
by
Vinoth Kumar
PPTX
Software Project Management
by
karthikeyanC40
PPT
Overview of project planning
by
Nidhya Rangarajan
PPTX
Bai giang-spm-20feb14
by
TRAN Khanh Dung, Khoa CNTT, Đại Học Xây Dựng
PDF
"We are doing it wrong."
by
weissgraeber
PPT
Project management
by
Usman Bin Saad
PPTX
Software development o & c
by
Amit Patil
PPTX
Welingkar First Year Project- ProjectWeLike
by
PrinceTrivedi4
PDF
Future of Software Analysis & Measurement_CAST
by
CAST
PPTX
Lecture 6 - Risk Management.pptx
by
Kike Noveas
PPT
Chapter03
by
Franco Valdez
PPTX
3B - How to effectively engage users and managers in IT projects - Richard Co...
by
CFG
DOCX
Assignment 1 Identify elements of concern (e.g. resources.docx
by
sherni1
PROJECT MANAGEMENT
by
Seif Shaame
Software Project Management lecture 7
by
Syed Muhammad Hammad
Process Quality Management, Human Resources, Quality Assurance
by
Reem Alattas
9 project planning
by
randhirlpu
SE_Chapterrrrrrrrrrrrrrrrrrrrrrrrrr3.pdf
by
timoemin50
MG6088 SOFTWARE PROJECT MANAGEMENT
by
Kathirvel Ayyaswamy
Spm
by
Suresh Kumar
spm-uniti-201022085737.pdf
by
Vinoth Kumar
Software Project Management
by
karthikeyanC40
Overview of project planning
by
Nidhya Rangarajan
Bai giang-spm-20feb14
by
TRAN Khanh Dung, Khoa CNTT, Đại Học Xây Dựng
"We are doing it wrong."
by
weissgraeber
Project management
by
Usman Bin Saad
Software development o & c
by
Amit Patil
Welingkar First Year Project- ProjectWeLike
by
PrinceTrivedi4
Future of Software Analysis & Measurement_CAST
by
CAST
Lecture 6 - Risk Management.pptx
by
Kike Noveas
Chapter03
by
Franco Valdez
3B - How to effectively engage users and managers in IT projects - Richard Co...
by
CFG
Assignment 1 Identify elements of concern (e.g. resources.docx
by
sherni1
More from Ismail Sultan
PDF
3d pmp Ch1-Intro 3d pmp pmp Ch1-Intro.pdf
by
Ismail Sultan
PDF
Project_Mgmt_Institute_- Marc Marc Marc.pdf
by
Ismail Sultan
PDF
Introduction-to-PMI-CP PMI-CP PMI-CP.pdf
by
Ismail Sultan
PDF
_11_Project_Delivery_Methods_PMI_CP_1755449019.pdf
by
Ismail Sultan
PDF
The_Deathbed_Regret_List_Exercise_1749576114.pdf
by
Ismail Sultan
PDF
Understanding-Interface-Criticality-in-Large-Infrastructure-Projects-INCOSE-I...
by
Ismail Sultan
PDF
1163 Interface Interface paper_low.pdf
by
Ismail Sultan
PDF
Project_Mgmt_Institute_-Marc Introduction Introduction-to-PMI-CP.pdf.pdf
by
Ismail Sultan
PDF
Introduction Introduction-to-PMI-CP.pdf
by
Ismail Sultan
PDF
Project_Mgmt_Institute_-Marc Marc Marc .pdf
by
Ismail Sultan
PDF
Construction_Project_Managers_Pocket_Book_by_Duncan_Cartlidge_z-lib.org_.pdf
by
Ismail Sultan
PDF
CONSTRUCTION INTERFACE MANAGEMENT preview.pdf
by
Ismail Sultan
PPTX
156796533-Stage-Gate 156796533-Stage-Gate.pptx
by
Ismail Sultan
PPT
Lecture-8-Maritime-routes-and-inland-waterways-ppt.ppt
by
Ismail Sultan
PPT
Lecture-9-Maritime-Organizations-ppt.ppt
by
Ismail Sultan
PPTX
Interface-management-for-complex-Projects.pptx
by
Ismail Sultan
PDF
Interface Management An Emerging Project Management Discipline
by
Ismail Sultan
PPT
504472995-Introduction-to-Iso-55000-Asset-Management-1.ppt
by
Ismail Sultan
PPTX
Asset-Management Asset-Management-ISO55.pptx
by
Ismail Sultan
PPTX
ISO55001-2014-Asset-Management-System.pptx
by
Ismail Sultan
3d pmp Ch1-Intro 3d pmp pmp Ch1-Intro.pdf
by
Ismail Sultan
Project_Mgmt_Institute_- Marc Marc Marc.pdf
by
Ismail Sultan
Introduction-to-PMI-CP PMI-CP PMI-CP.pdf
by
Ismail Sultan
_11_Project_Delivery_Methods_PMI_CP_1755449019.pdf
by
Ismail Sultan
The_Deathbed_Regret_List_Exercise_1749576114.pdf
by
Ismail Sultan
Understanding-Interface-Criticality-in-Large-Infrastructure-Projects-INCOSE-I...
by
Ismail Sultan
1163 Interface Interface paper_low.pdf
by
Ismail Sultan
Project_Mgmt_Institute_-Marc Introduction Introduction-to-PMI-CP.pdf.pdf
by
Ismail Sultan
Introduction Introduction-to-PMI-CP.pdf
by
Ismail Sultan
Project_Mgmt_Institute_-Marc Marc Marc .pdf
by
Ismail Sultan
Construction_Project_Managers_Pocket_Book_by_Duncan_Cartlidge_z-lib.org_.pdf
by
Ismail Sultan
CONSTRUCTION INTERFACE MANAGEMENT preview.pdf
by
Ismail Sultan
156796533-Stage-Gate 156796533-Stage-Gate.pptx
by
Ismail Sultan
Lecture-8-Maritime-routes-and-inland-waterways-ppt.ppt
by
Ismail Sultan
Lecture-9-Maritime-Organizations-ppt.ppt
by
Ismail Sultan
Interface-management-for-complex-Projects.pptx
by
Ismail Sultan
Interface Management An Emerging Project Management Discipline
by
Ismail Sultan
504472995-Introduction-to-Iso-55000-Asset-Management-1.ppt
by
Ismail Sultan
Asset-Management Asset-Management-ISO55.pptx
by
Ismail Sultan
ISO55001-2014-Asset-Management-System.pptx
by
Ismail Sultan
Recently uploaded
PPTX
Engineering Economics CHAPTER 4.pptx - R
by
MisgnaArefe
PPTX
Optimizing Plant Maintenance — Key Elements of a Successful Maintenance Plan ...
by
MaintWiz Technologies Private Limited
DOCX
Project Management(BOE 070) notes Unite 4 AKTU
by
26dsyogam
PPT
Tutorial-security-privacy-cloud intro duction about cloud compting its services
by
HEmansuSingh
PPTX
22PEOIT4C Session 9 Local search in continuous space.pptx
by
mailmegokilavani
PPTX
Track & Monitor Preventive Maintenance — Best Practices with MaintWiz CMMS
by
MaintWiz Technologies Private Limited
PDF
Bee problems on the basic engineering of electrical
by
Vinodkumar941730
PPTX
A7383 3D Printing UNIT-III : 3D printing techniques
by
VishnuVardhan909561
PDF
3rd International Conference on AI & Civil Engineering (AICiViL 2025)
by
ieijjournal
PPTX
Fiber reinforced concrete (FRC) is a composite material made from Portland ce...
by
manojaioe
PPTX
Introduction to Civil Engineering-Defination, Branches of civil engineering a...
by
vidyanand kadam
PDF
Nostr : A protocol for freedom of speech
by
Emre YILMAZ
PPT
24CYT13 - Chemistry for Electronics and Computer Systems-Unit-V-E Waste & Its...
by
KrishnaveniKrishnara1
PDF
Modeltomodel_Transformation_with_ATL (1).pdf
by
ISEMENSIAS
PDF
22PEOIT4C Artificial Intelligence Syllab
by
mailmegokilavani
PDF
TechSprint: Innovate for Impact Hackathon
by
DeepakkumarSingh415123
PPTX
Network Security v1.0 - Module 2.pptx
by
ssuserb1479b
PPTX
Network intrusion detection system .pptx
by
venomghost09082000
PDF
PROPEX-RAG: Prompt-Driven GraphRAG for Multi-Hop QA
by
apurvakarne
PPTX
Industrial Smart Ventilation system.pptx
by
fsanjay42
Engineering Economics CHAPTER 4.pptx - R
by
MisgnaArefe
Optimizing Plant Maintenance — Key Elements of a Successful Maintenance Plan ...
by
MaintWiz Technologies Private Limited
Project Management(BOE 070) notes Unite 4 AKTU
by
26dsyogam
Tutorial-security-privacy-cloud intro duction about cloud compting its services
by
HEmansuSingh
22PEOIT4C Session 9 Local search in continuous space.pptx
by
mailmegokilavani
Track & Monitor Preventive Maintenance — Best Practices with MaintWiz CMMS
by
MaintWiz Technologies Private Limited
Bee problems on the basic engineering of electrical
by
Vinodkumar941730
A7383 3D Printing UNIT-III : 3D printing techniques
by
VishnuVardhan909561
3rd International Conference on AI & Civil Engineering (AICiViL 2025)
by
ieijjournal
Fiber reinforced concrete (FRC) is a composite material made from Portland ce...
by
manojaioe
Introduction to Civil Engineering-Defination, Branches of civil engineering a...
by
vidyanand kadam
Nostr : A protocol for freedom of speech
by
Emre YILMAZ
24CYT13 - Chemistry for Electronics and Computer Systems-Unit-V-E Waste & Its...
by
KrishnaveniKrishnara1
Modeltomodel_Transformation_with_ATL (1).pdf
by
ISEMENSIAS
22PEOIT4C Artificial Intelligence Syllab
by
mailmegokilavani
TechSprint: Innovate for Impact Hackathon
by
DeepakkumarSingh415123
Network Security v1.0 - Module 2.pptx
by
ssuserb1479b
Network intrusion detection system .pptx
by
venomghost09082000
PROPEX-RAG: Prompt-Driven GraphRAG for Multi-Hop QA
by
apurvakarne
Industrial Smart Ventilation system.pptx
by
fsanjay42
L03-ProjectManagement ProjectManagement.pdf
1.
1 University of Toronto
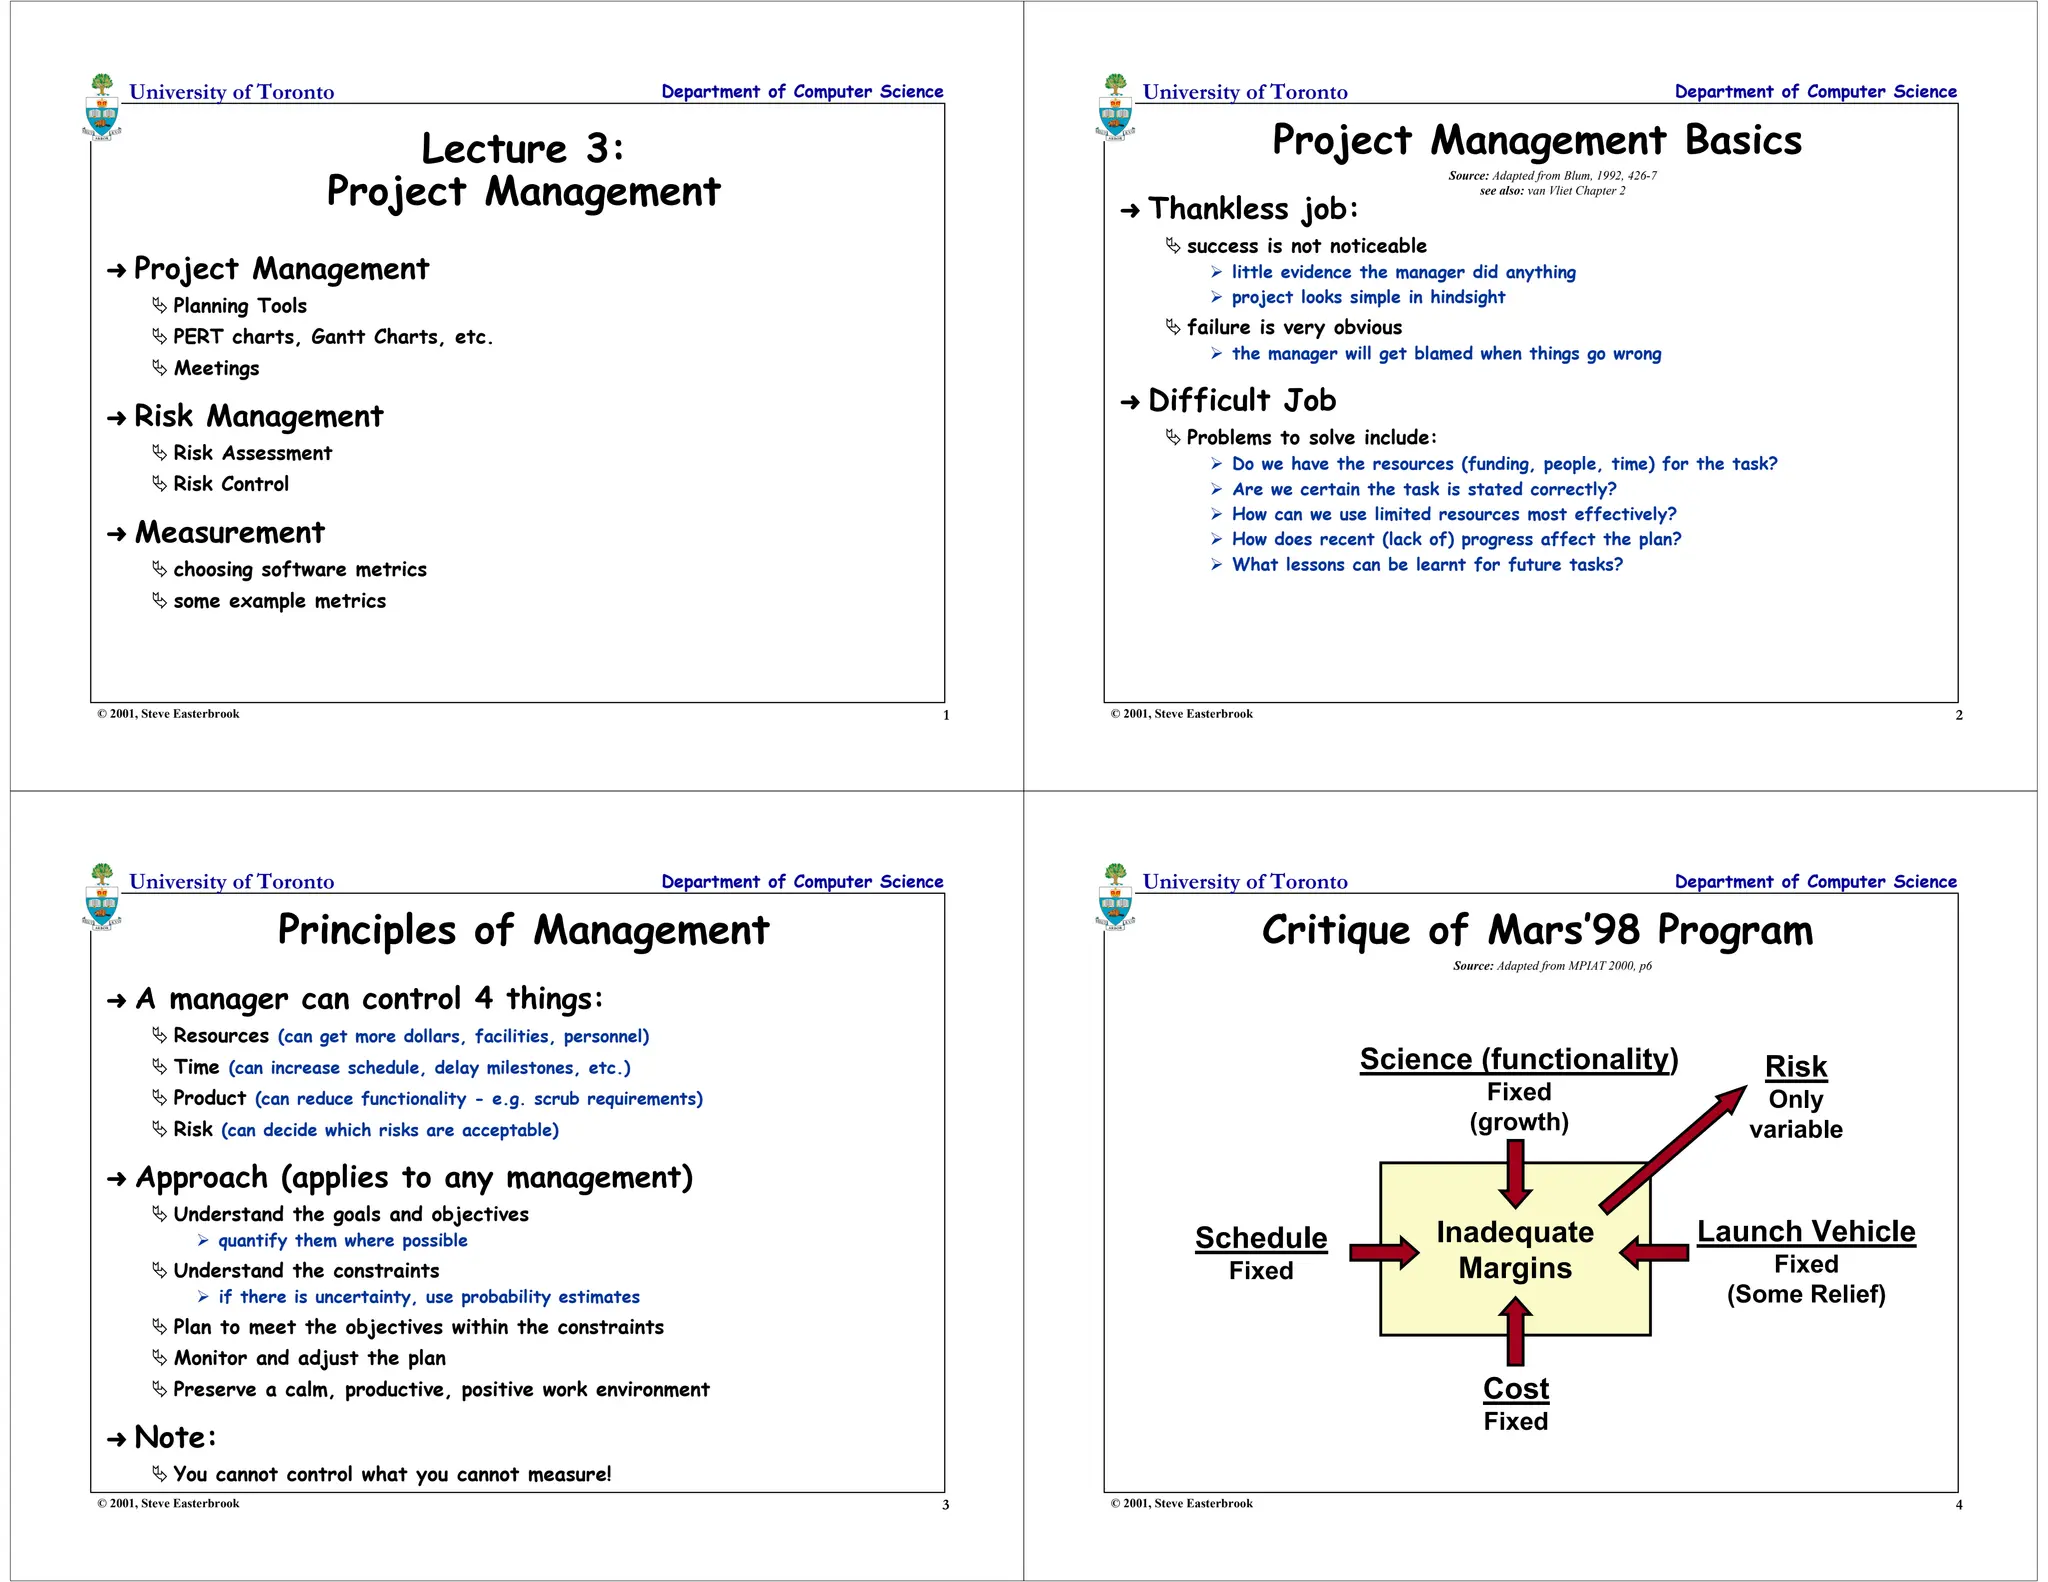
Department of Computer Science © 2001, Steve Easterbrook Lecture 3: Project Management ➜ Project Management Planning Tools PERT charts, Gantt Charts, etc. Meetings ➜ Risk Management Risk Assessment Risk Control ➜ Measurement choosing software metrics some example metrics 2 University of Toronto Department of Computer Science © 2001, Steve Easterbrook Project Management Basics ➜ Thankless job: success is not noticeable little evidence the manager did anything project looks simple in hindsight failure is very obvious the manager will get blamed when things go wrong ➜ Difficult Job Problems to solve include: Do we have the resources (funding, people, time) for the task? Are we certain the task is stated correctly? How can we use limited resources most effectively? How does recent (lack of) progress affect the plan? What lessons can be learnt for future tasks? Source: Adapted from Blum, 1992, 426-7 see also: van Vliet Chapter 2 3 University of Toronto Department of Computer Science © 2001, Steve Easterbrook Principles of Management ➜ A manager can control 4 things: Resources (can get more dollars, facilities, personnel) Time (can increase schedule, delay milestones, etc.) Product (can reduce functionality - e.g. scrub requirements) Risk (can decide which risks are acceptable) ➜ Approach (applies to any management) Understand the goals and objectives quantify them where possible Understand the constraints if there is uncertainty, use probability estimates Plan to meet the objectives within the constraints Monitor and adjust the plan Preserve a calm, productive, positive work environment ➜ Note: You cannot control what you cannot measure! 4 University of Toronto Department of Computer Science © 2001, Steve Easterbrook Critique of Mars’98 Program Inadequate Margins Science (functionality) Fixed (growth) Schedule Fixed Cost Fixed Launch Vehicle Fixed (Some Relief) Risk Only variable Source: Adapted from MPIAT 2000, p6
2.
5 University of Toronto
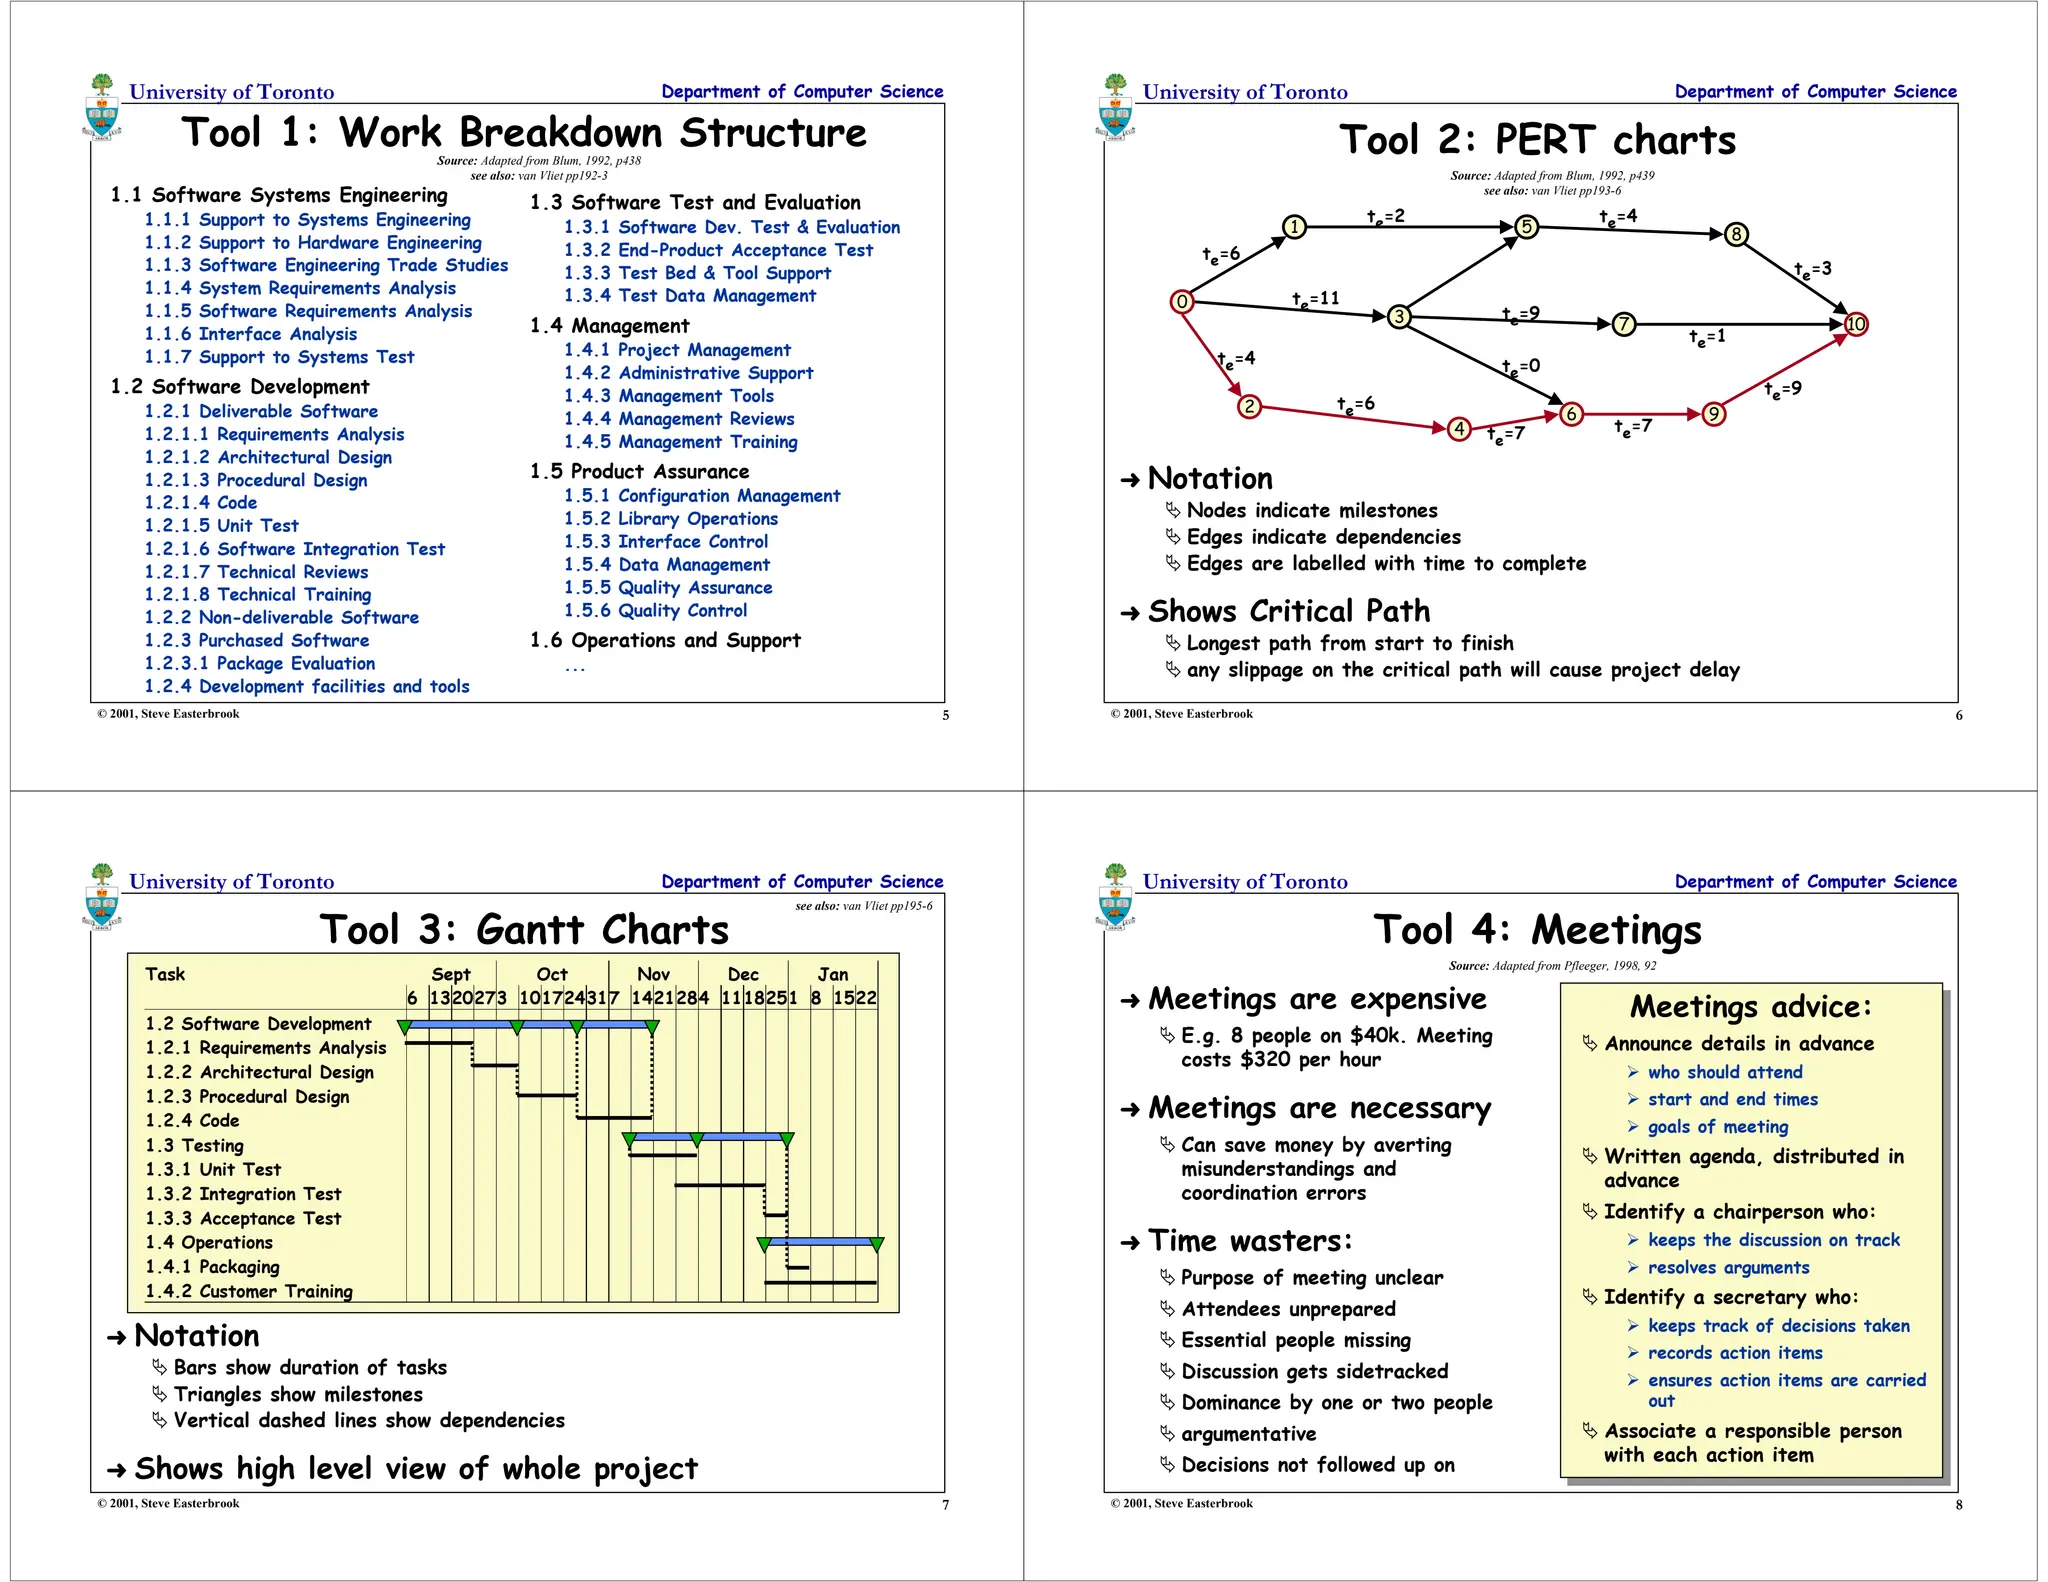
Department of Computer Science © 2001, Steve Easterbrook Tool 1: Work Breakdown Structure 1.1 Software Systems Engineering 1.1.1 Support to Systems Engineering 1.1.2 Support to Hardware Engineering 1.1.3 Software Engineering Trade Studies 1.1.4 System Requirements Analysis 1.1.5 Software Requirements Analysis 1.1.6 Interface Analysis 1.1.7 Support to Systems Test 1.2 Software Development 1.2.1 Deliverable Software 1.2.1.1 Requirements Analysis 1.2.1.2 Architectural Design 1.2.1.3 Procedural Design 1.2.1.4 Code 1.2.1.5 Unit Test 1.2.1.6 Software Integration Test 1.2.1.7 Technical Reviews 1.2.1.8 Technical Training 1.2.2 Non-deliverable Software 1.2.3 Purchased Software 1.2.3.1 Package Evaluation 1.2.4 Development facilities and tools Source: Adapted from Blum, 1992, p438 see also: van Vliet pp192-3 1.3 Software Test and Evaluation 1.3.1 Software Dev. Test Evaluation 1.3.2 End-Product Acceptance Test 1.3.3 Test Bed Tool Support 1.3.4 Test Data Management 1.4 Management 1.4.1 Project Management 1.4.2 Administrative Support 1.4.3 Management Tools 1.4.4 Management Reviews 1.4.5 Management Training 1.5 Product Assurance 1.5.1 Configuration Management 1.5.2 Library Operations 1.5.3 Interface Control 1.5.4 Data Management 1.5.5 Quality Assurance 1.5.6 Quality Control 1.6 Operations and Support ... 6 University of Toronto Department of Computer Science © 2001, Steve Easterbrook Tool 2: PERT charts 1 2 3 4 5 6 7 8 0 10 9 te=6 te=4 te=11 te=6 te=2 te=9 te=4 te=0 te=7 te=7 te=9 te=1 te=3 ➜ Notation Nodes indicate milestones Edges indicate dependencies Edges are labelled with time to complete ➜ Shows Critical Path Longest path from start to finish any slippage on the critical path will cause project delay Source: Adapted from Blum, 1992, p439 see also: van Vliet pp193-6 7 University of Toronto Department of Computer Science © 2001, Steve Easterbrook Tool 3: Gantt Charts ➜ Notation Bars show duration of tasks Triangles show milestones Vertical dashed lines show dependencies ➜ Shows high level view of whole project Task Sept Oct Nov Dec Jan 6 1320273 101724317 1421284 1118251 8 1522 1.2 Software Development 1.2.1 Requirements Analysis 1.2.2 Architectural Design 1.2.3 Procedural Design 1.2.4 Code 1.3 Testing 1.3.1 Unit Test 1.3.2 Integration Test 1.3.3 Acceptance Test 1.4 Operations 1.4.1 Packaging 1.4.2 Customer Training see also: van Vliet pp195-6 8 University of Toronto Department of Computer Science © 2001, Steve Easterbrook Tool 4: Meetings ➜ Meetings are expensive E.g. 8 people on $40k. Meeting costs $320 per hour ➜ Meetings are necessary Can save money by averting misunderstandings and coordination errors ➜ Time wasters: Purpose of meeting unclear Attendees unprepared Essential people missing Discussion gets sidetracked Dominance by one or two people argumentative Decisions not followed up on Source: Adapted from Pfleeger, 1998, 92 Meetings advice: Announce details in advance who should attend start and end times goals of meeting Written agenda, distributed in advance Identify a chairperson who: keeps the discussion on track resolves arguments Identify a secretary who: keeps track of decisions taken records action items ensures action items are carried out Associate a responsible person with each action item Meetings advice: Announce details in advance who should attend start and end times goals of meeting Written agenda, distributed in advance Identify a chairperson who: keeps the discussion on track resolves arguments Identify a secretary who: keeps track of decisions taken records action items ensures action items are carried out Associate a responsible person with each action item
3.
9 University of Toronto
Department of Computer Science © 2001, Steve Easterbrook Risk Management ➜ Two Parts: Risk Assessment Risk Control ➜ Definitions Risk Exposure (RE) = p(unsat. outcome) X loss(unsat. outcome) Risk Reduction Leverage (RRL) = (REbefore - REafter) / cost of intervention ➜ Principles If you don’t actively attack risks, they will attack you Risk prevention is cheaper than risk detection Degree and Cause of Risk must never be hidden from decision makers “The real professional … knows the risks, their degree, their causes, and the action necessary to counter them, and shares this knowledge with [her] colleagues and clients” (Tom Gilb) Source: Adapted from Blum, 1992, p441-447 see also: van Vliet pp189-191 10 University of Toronto Department of Computer Science © 2001, Steve Easterbrook Top Ten Risks (with Countermeasures) Personnel Shortfalls use top talent team building training Unrealistic schedules and budgets multisource estimation designing to cost requirements scrubbing Developing the wrong Software functions better requirements analysis organizational/operational analysis Developing the wrong User Interface prototypes, scenarios, task analysis Gold Plating requirements scrubbing cost benefit analysis designing to cost Source: Adapted from Boehm, 1989 see also: van Vliet p192 Continuing stream of requirements changes high change threshold information hiding incremental development Shortfalls in externally furnished components early benchmarking inspections, compatibility analysis Shortfalls in externally performed tasks pre-award audits competitive designs Real-time performance shortfalls targeted analysis simulations, benchmarks, models Straining computer science capabilities technical analysis checking scientific literature 11 University of Toronto Department of Computer Science © 2001, Steve Easterbrook Principles of Measurement “You Cannot Control What You Cannot Measure” ➜ Types of Metric algorithmic vs. subjective process vs. product ➜ Good metrics are: simple (to collect and interpret) valid (measure what they purport to measure) robust (insensitive to manipulation) prescriptive analyzable ➜ 5 types of scale nominal (=, ≠ ≠ ≠ ≠ make sense; discrete categories) ordinal (, , =, make sense; e.g. oven temps: cool, warm, hot, very hot) interval (+, -, , , = make sense; e.g. temperature in centigrade) ratio (x, ÷, +, -, , , = make sense; e.g. temperature in Kelvin) absolute (a natural number count) Source: Adapted from Blum, 1992, p457-458 see also: van Vliet pp104-9 12 University of Toronto Department of Computer Science © 2001, Steve Easterbrook Some suggested metrics Plot planned and actual staffing levels over time Record number type of code and test errors Plot number of resolved unresolved problem reports over time Plot planned actual number of units whose VV is completed over time: a) design reviews completed b) unit tests completed c) integration tests completed Plot software build size over time Plot average complexity for the 10% most complex units over time (using some suitable measure of complexity) Plot new, modified and reused SLOCs for each CSCI over time SLOC = Source Lines Of Code (decide how to count this!) Plot estimated schedule to completion based on deliveries achieved (needs a detailed WBS and PERT or GANTT chart) Source: Adapted from Nusenoff Bunde, 1993
4.
13 University of Toronto
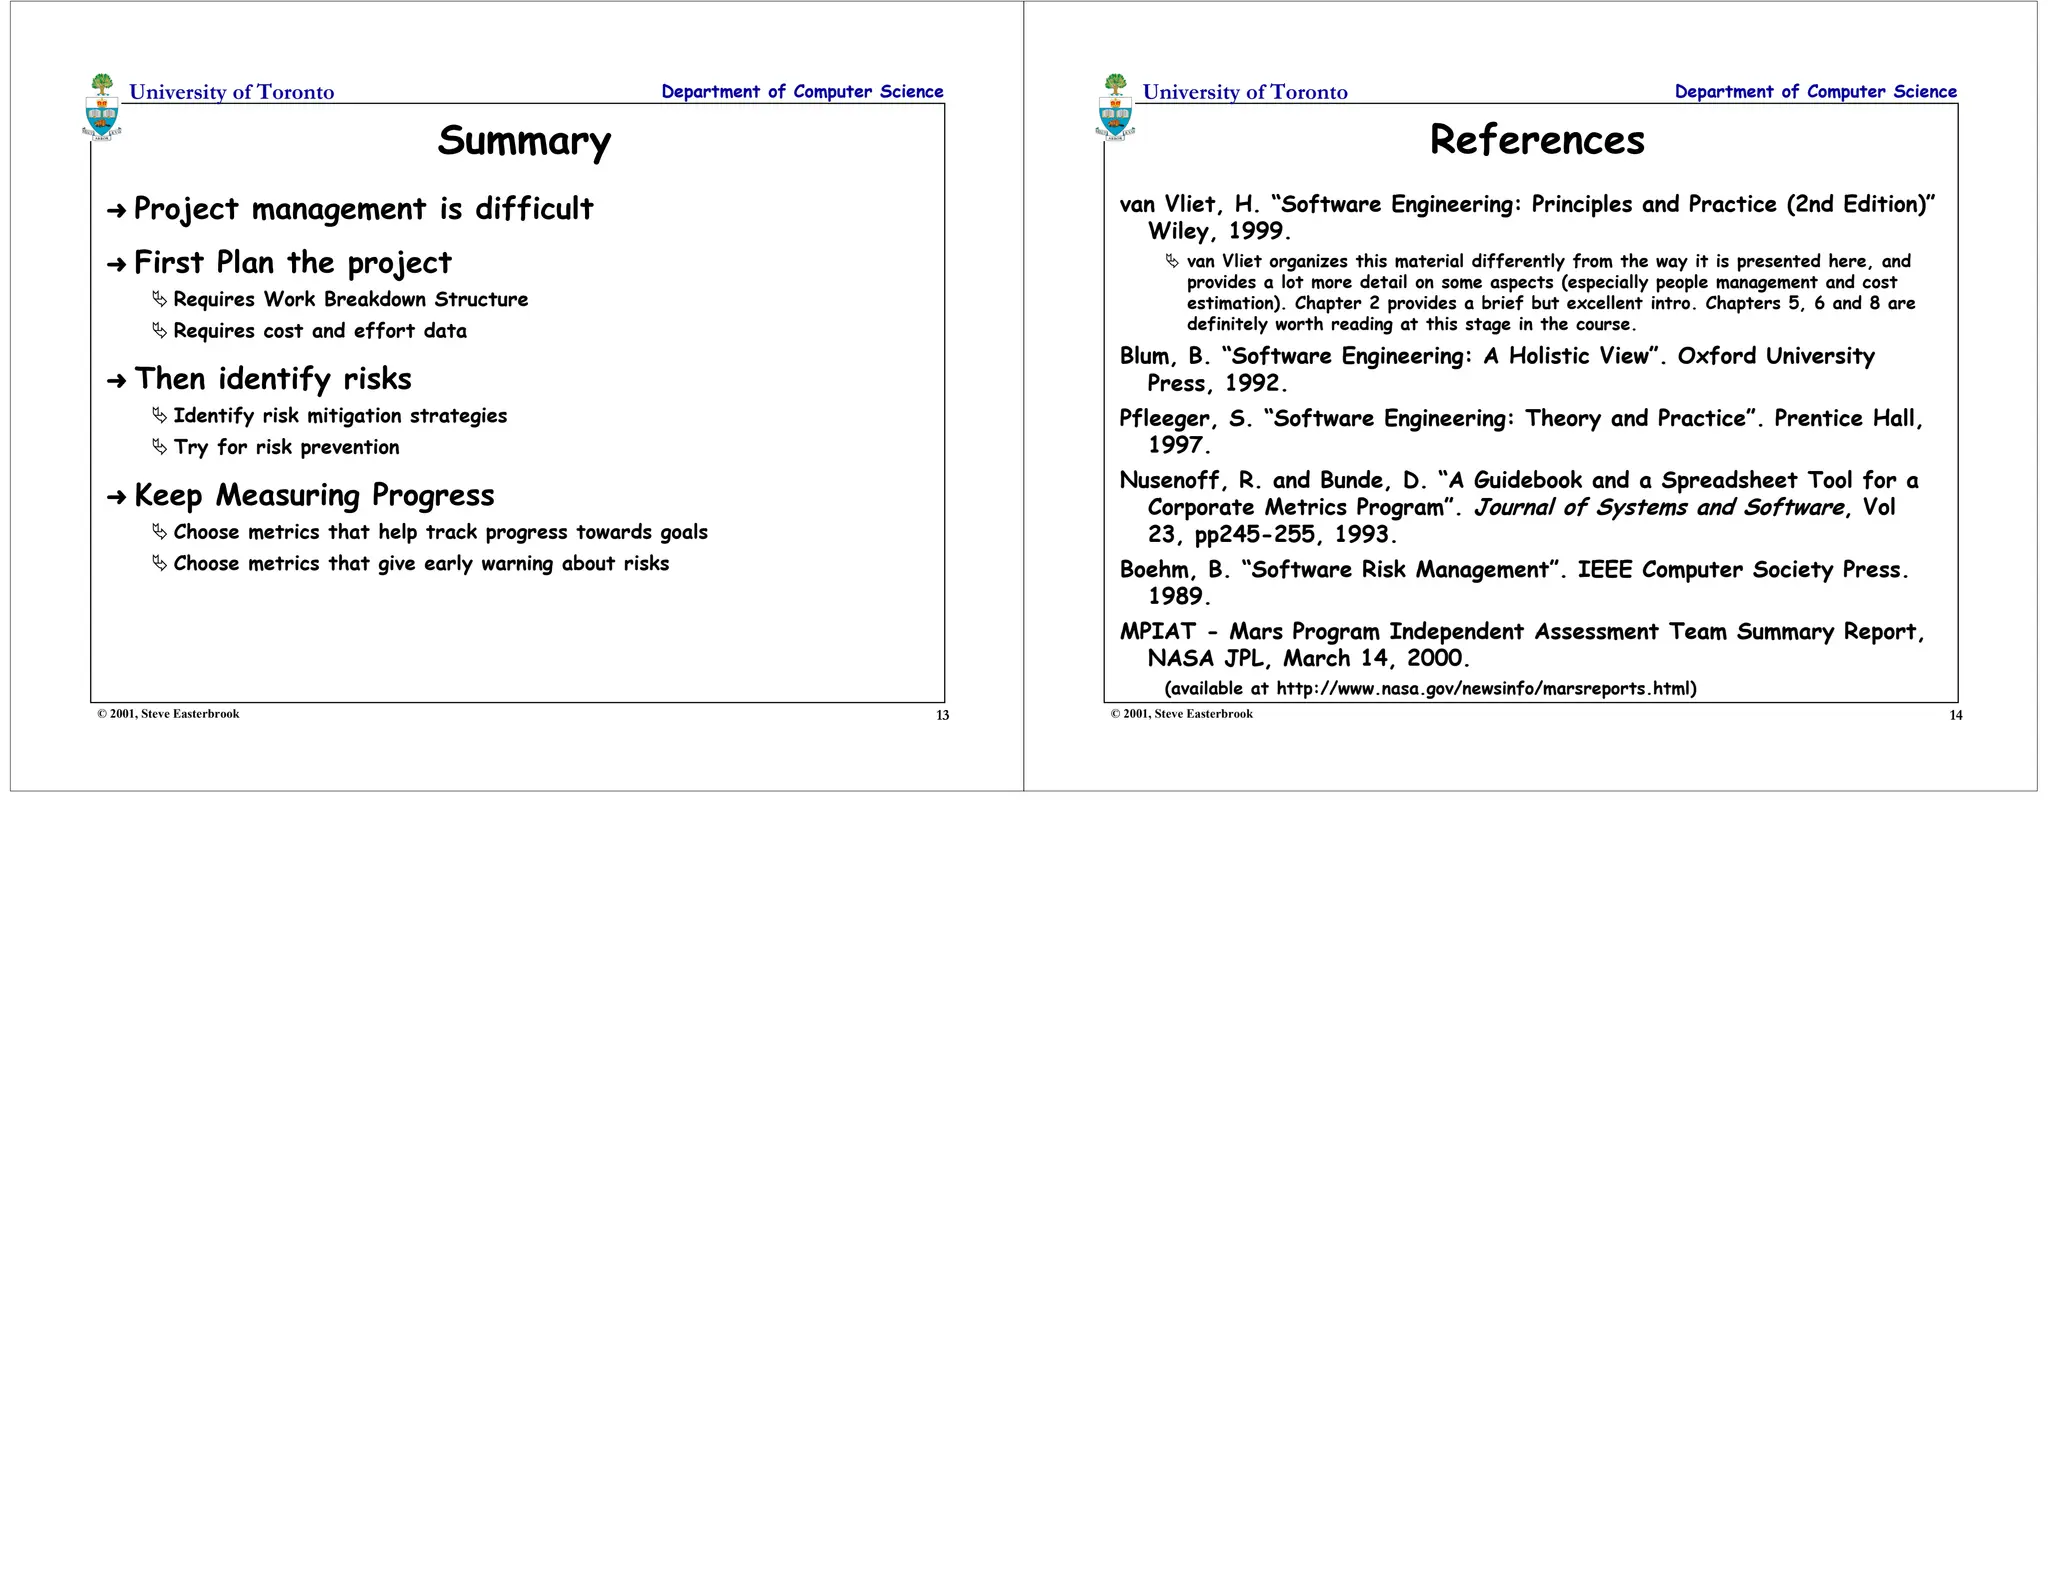
Department of Computer Science © 2001, Steve Easterbrook Summary ➜ Project management is difficult ➜ First Plan the project Requires Work Breakdown Structure Requires cost and effort data ➜ Then identify risks Identify risk mitigation strategies Try for risk prevention ➜ Keep Measuring Progress Choose metrics that help track progress towards goals Choose metrics that give early warning about risks 14 University of Toronto Department of Computer Science © 2001, Steve Easterbrook References van Vliet, H. “Software Engineering: Principles and Practice (2nd Edition)” Wiley, 1999. van Vliet organizes this material differently from the way it is presented here, and provides a lot more detail on some aspects (especially people management and cost estimation). Chapter 2 provides a brief but excellent intro. Chapters 5, 6 and 8 are definitely worth reading at this stage in the course. Blum, B. “Software Engineering: A Holistic View”. Oxford University Press, 1992. Pfleeger, S. “Software Engineering: Theory and Practice”. Prentice Hall, 1997. Nusenoff, R. and Bunde, D. “A Guidebook and a Spreadsheet Tool for a Corporate Metrics Program”. Journal of Systems and Software, Vol 23, pp245-255, 1993. Boehm, B. “Software Risk Management”. IEEE Computer Society Press. 1989. MPIAT - Mars Program Independent Assessment Team Summary Report, NASA JPL, March 14, 2000. (available at http://www.nasa.gov/newsinfo/marsreports.html)
Download
![9
University of Toronto Department of Computer Science
© 2001, Steve Easterbrook
Risk Management
➜ Two Parts:
Risk Assessment
Risk Control
➜ Definitions
Risk Exposure (RE) = p(unsat. outcome) X loss(unsat. outcome)
Risk Reduction Leverage (RRL) = (REbefore - REafter) / cost of intervention
➜ Principles
If you don’t actively attack risks, they will attack you
Risk prevention is cheaper than risk detection
Degree and Cause of Risk must never be hidden from decision makers
“The real professional … knows the risks, their degree, their causes, and the
action necessary to counter them, and shares this knowledge with [her]
colleagues and clients” (Tom Gilb)
Source: Adapted from Blum, 1992, p441-447
see also: van Vliet pp189-191
10
University of Toronto Department of Computer Science
© 2001, Steve Easterbrook
Top Ten Risks (with Countermeasures)
Personnel Shortfalls
use top talent
team building
training
Unrealistic schedules and budgets
multisource estimation
designing to cost
requirements scrubbing
Developing the wrong Software
functions
better requirements analysis
organizational/operational analysis
Developing the wrong User
Interface
prototypes, scenarios, task analysis
Gold Plating
requirements scrubbing
cost benefit analysis
designing to cost
Source: Adapted from Boehm, 1989
see also: van Vliet p192
Continuing stream of requirements
changes
high change threshold
information hiding
incremental development
Shortfalls in externally furnished
components
early benchmarking
inspections, compatibility analysis
Shortfalls in externally performed
tasks
pre-award audits
competitive designs
Real-time performance shortfalls
targeted analysis
simulations, benchmarks, models
Straining computer science
capabilities
technical analysis
checking scientific literature
11
University of Toronto Department of Computer Science
© 2001, Steve Easterbrook
Principles of Measurement
“You Cannot Control What You Cannot Measure”
➜ Types of Metric
algorithmic vs. subjective
process vs. product
➜ Good metrics are:
simple (to collect and interpret)
valid (measure what they purport to measure)
robust (insensitive to manipulation)
prescriptive
analyzable
➜ 5 types of scale
nominal (=, ≠
≠
≠
≠ make sense; discrete categories)
ordinal (, , =, make sense; e.g. oven temps: cool, warm, hot, very hot)
interval (+, -, , , = make sense; e.g. temperature in centigrade)
ratio (x, ÷, +, -, , , = make sense; e.g. temperature in Kelvin)
absolute (a natural number count)
Source: Adapted from Blum, 1992, p457-458
see also: van Vliet pp104-9
12
University of Toronto Department of Computer Science
© 2001, Steve Easterbrook
Some suggested metrics
Plot planned and actual staffing levels over time
Record number type of code and test errors
Plot number of resolved unresolved problem reports over time
Plot planned actual number of units whose VV is completed over time:
a) design reviews completed
b) unit tests completed
c) integration tests completed
Plot software build size over time
Plot average complexity for the 10% most complex units over time
(using some suitable measure of complexity)
Plot new, modified and reused SLOCs for each CSCI over time
SLOC = Source Lines Of Code (decide how to count this!)
Plot estimated schedule to completion based on deliveries achieved
(needs a detailed WBS and PERT or GANTT chart)
Source: Adapted from Nusenoff Bunde, 1993](https://image.slidesharecdn.com/l03-projectmanagement-250830182812-b46bf5e5/75/L03-ProjectManagement-ProjectManagement-pdf-3-2048.jpg)