Interface Management An Emerging Project Management Discipline
1.
The Knowledge Leaderfor Project Success
Owners ■Contractors • Academics
Interface Management
An Emerging Project Management Discipline
Justin Goodman, Jacobs
SangHyun Lee, University of Michigan
Todd LaBar, Air Products
2014 Cll Annual Conference July 21-23 • Indianapolis, Indiana
2.
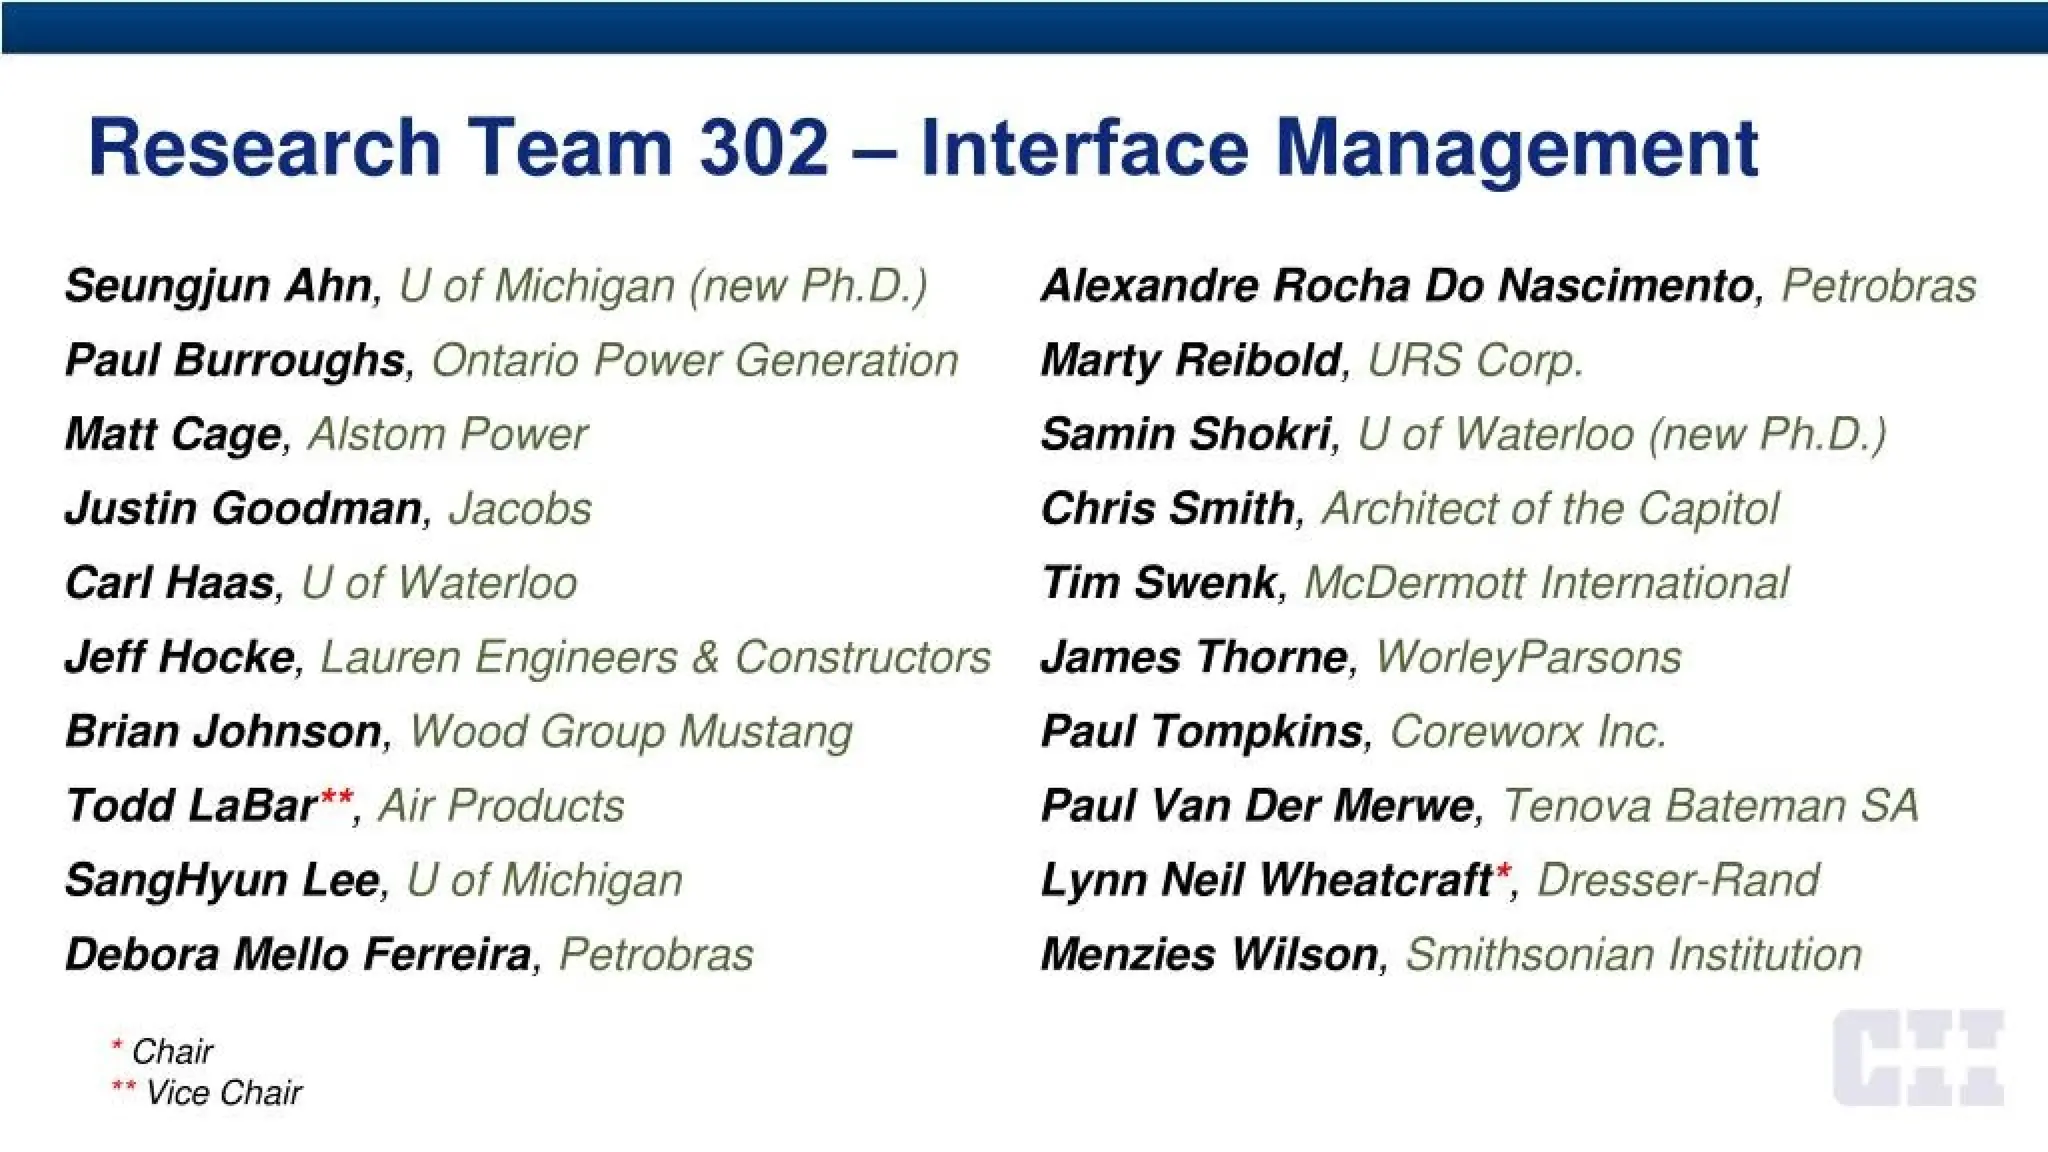
Research Team 302- Interface Management
Seungjun Ahn, U of Michigan (new Ph.D.)
Paul Burroughs, Ontario Power Generation
Matt Cage, Alstom Power
Justin Goodman, Jacobs
Carl Haas, U of Waterloo
Jeff Hocke, Lauren Engineers & Constructors
Brian Johnson, Wood Group Mustang
Todd LaBar**, Air Products
SangHyun Lee, U of Michigan
Debora Mello Ferreira, Petrobras
* Chair
** Vice Chair
Alexandre Rocha Do Nascimento, Petrobras
Marty Reibold, UPS Corp.
Samin Shokri, U of Waterloo (new Ph.D.)
Chris Smith, Architect of the Capitol
Tim Swenk, McDermott International
James Thorne, WorleyParsons
Paul Tompkins, Coreworx Inc.
Paul Van DerMerwe, Tenova Bateman SA
Lynn Neil Wheatcraft*, Dresser-Rand
Menzies Wilson, Smithsonian Institution
3.
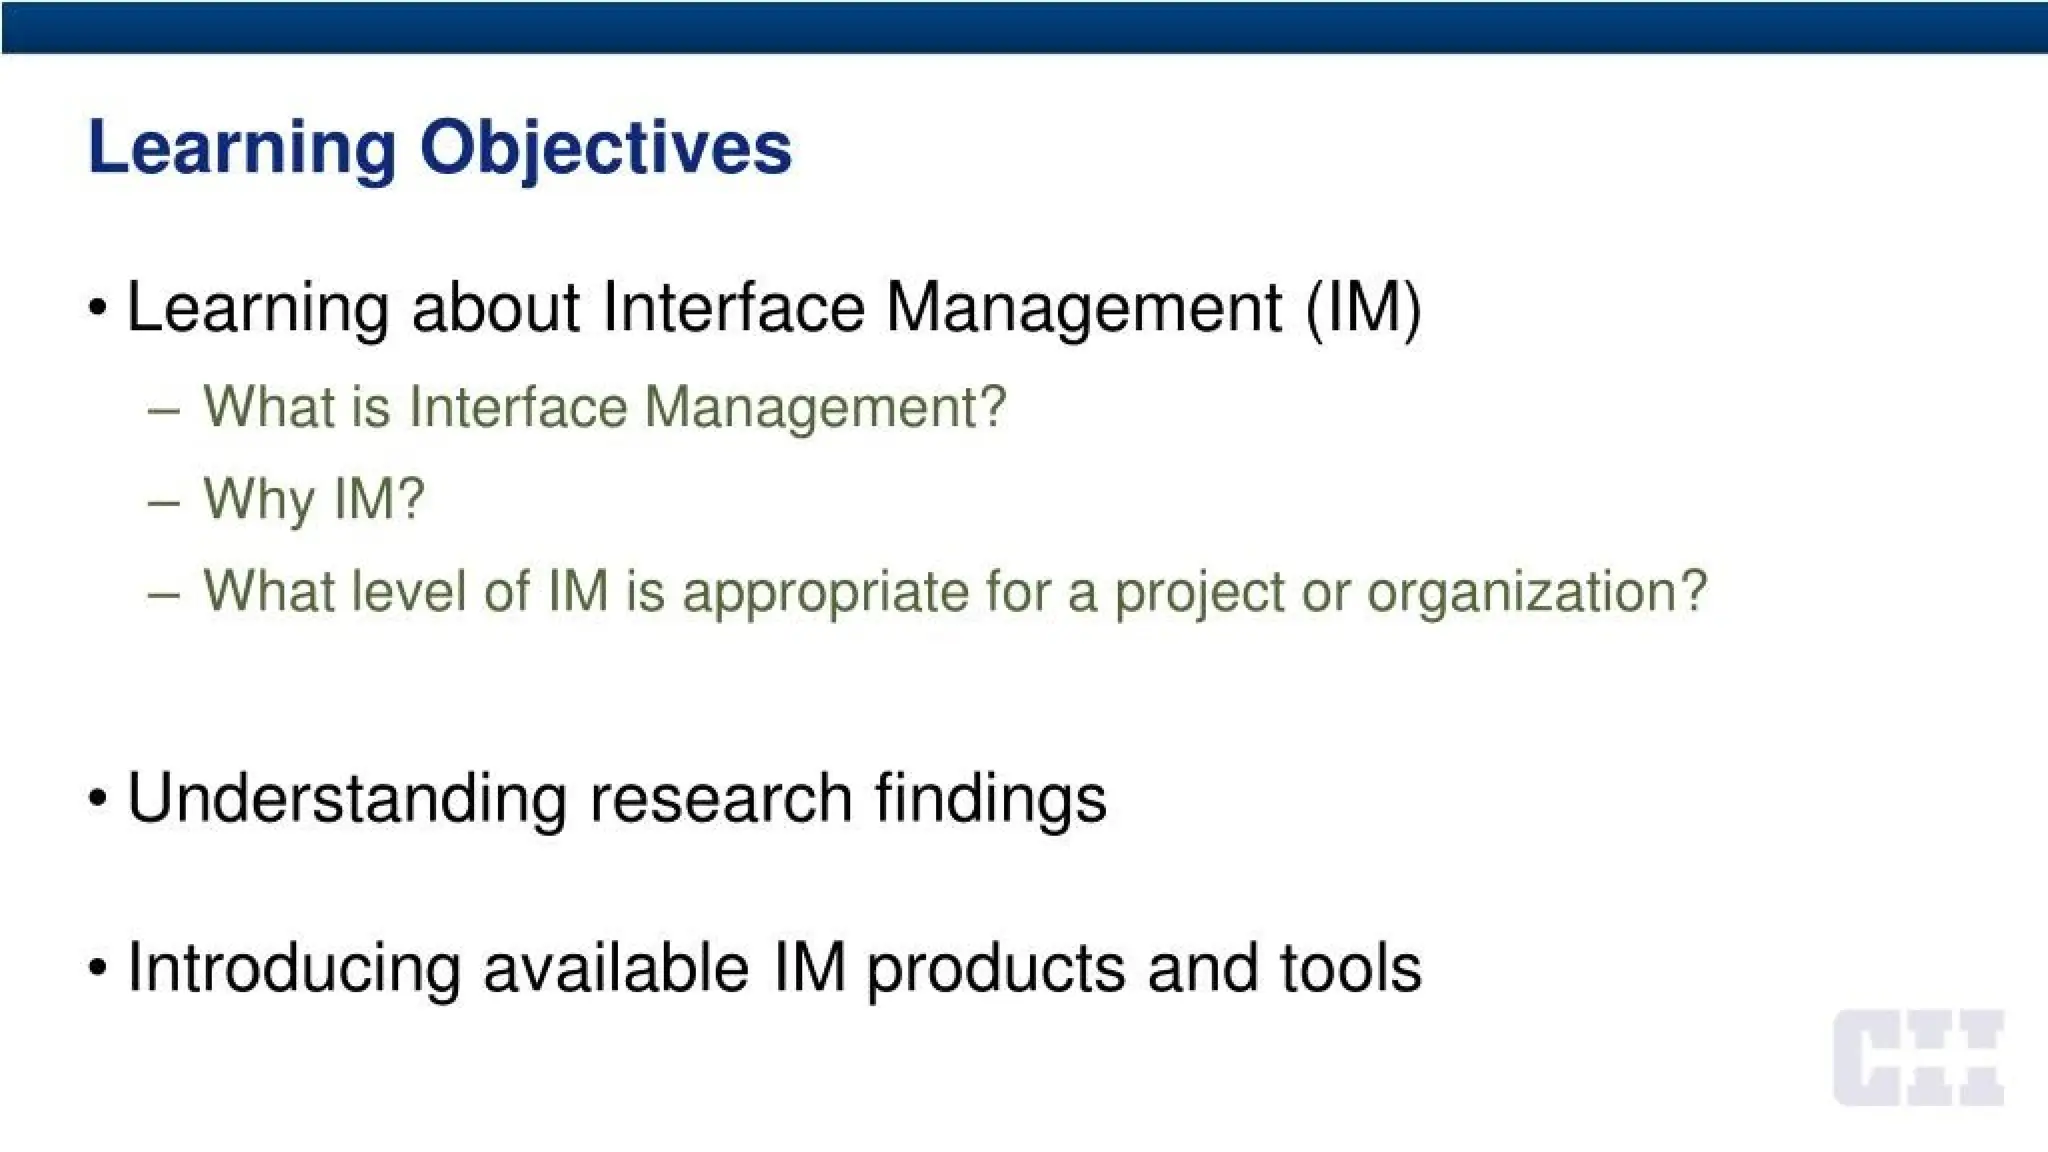
Learning Objectives
• Learningabout Interface Management (IM)
- What is Interface Management?
- Why IM?
- What level of IM is appropriate for a project or organization?
• Understanding research findings
Introducing available IM products and tools
4.
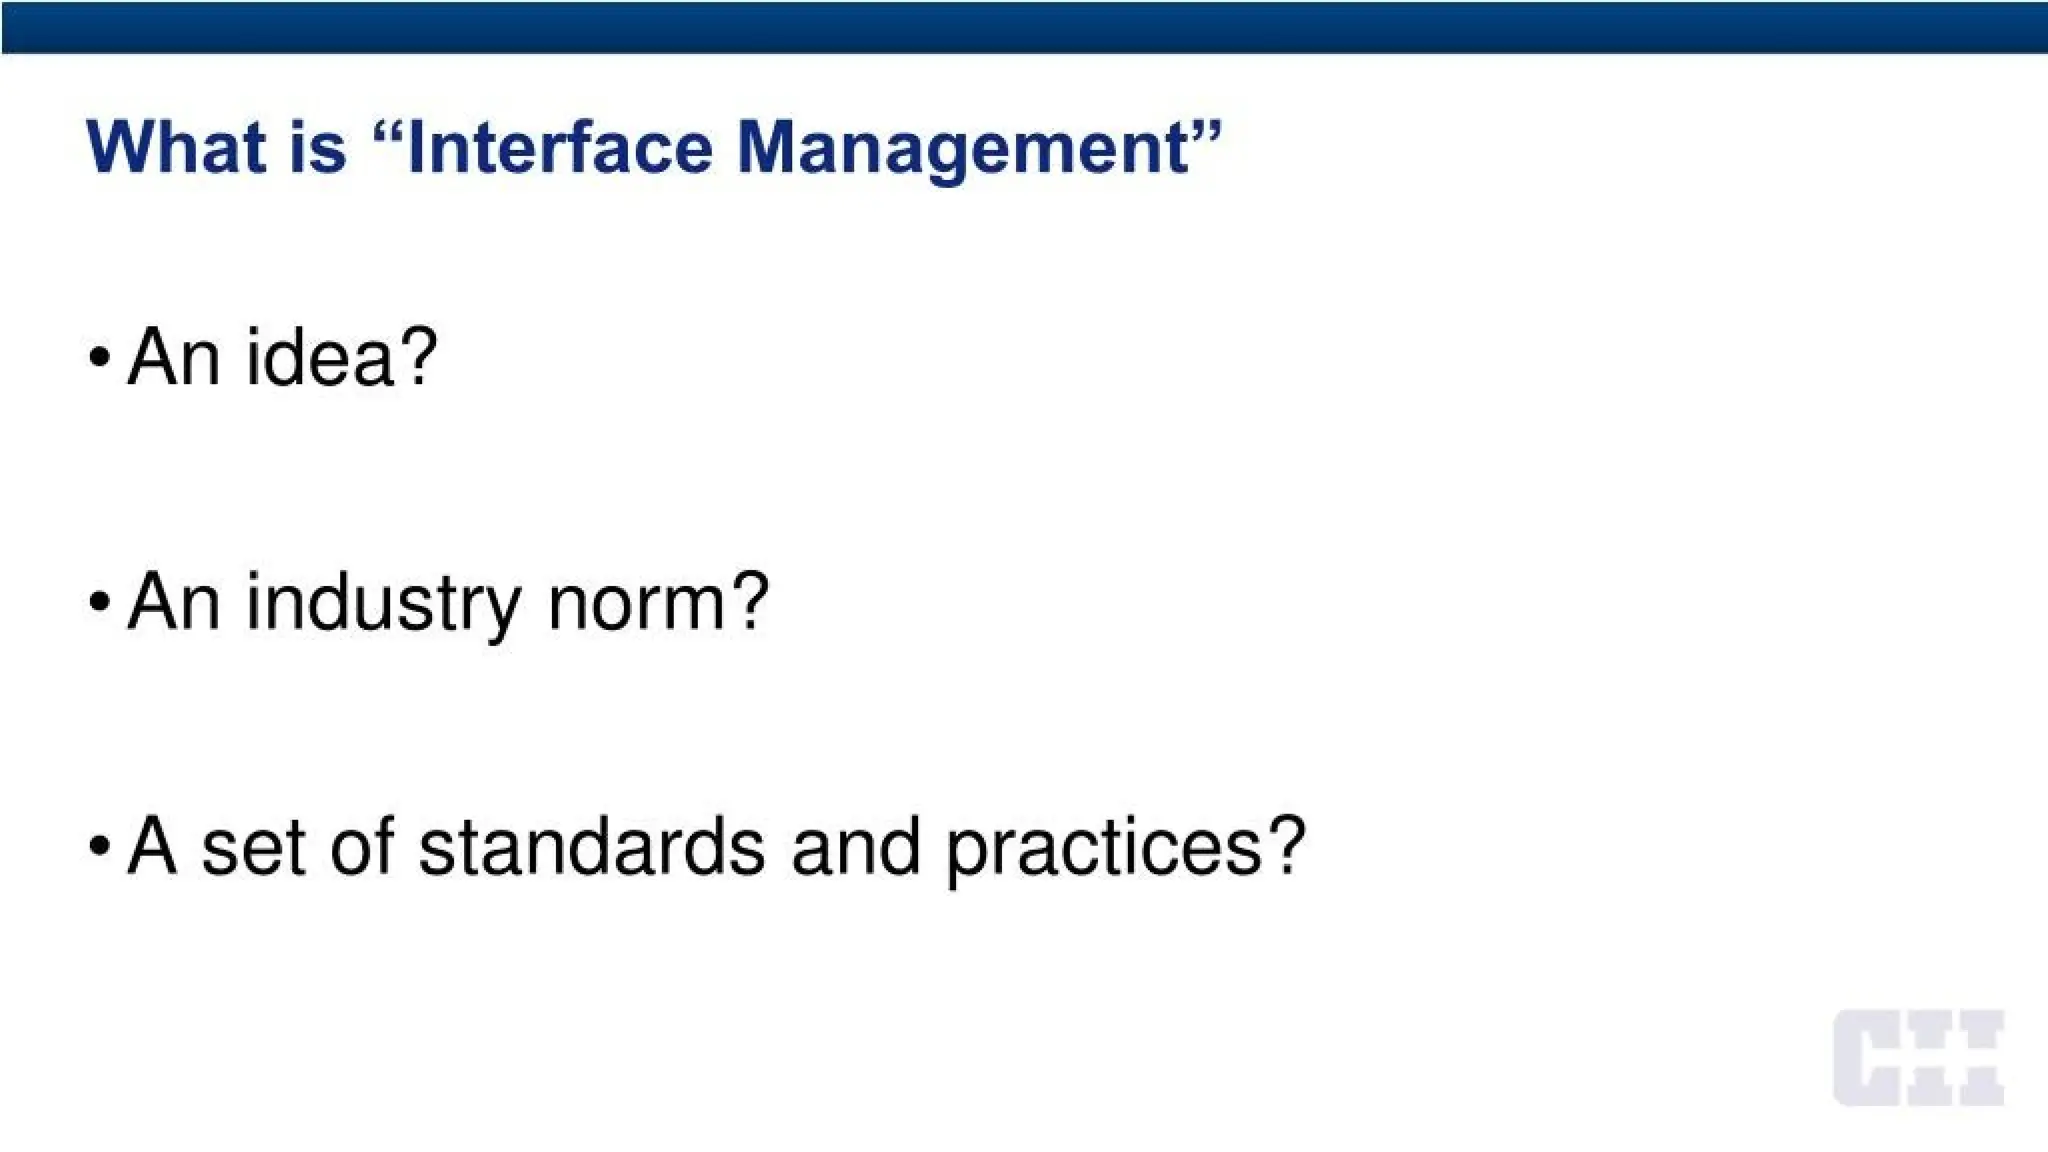
What is “InterfaceManagement”
•An idea?
•An industry norm?
A set of standards and practices?
5.
Have you heardof Interface
Management or its practice?
A. Yes
B. No
0% 0%
6.
Does your knowledgeof IM
align with that of your clients,
partners, contractors, and/or
competitors?
0%
A. Yes
B. No
C. Not Sure
7.
Does your companyemploy
formal Interface Management
practices and procedures?
0% 0% 0%
A. Yes
B. No
C. Not Sure
8.
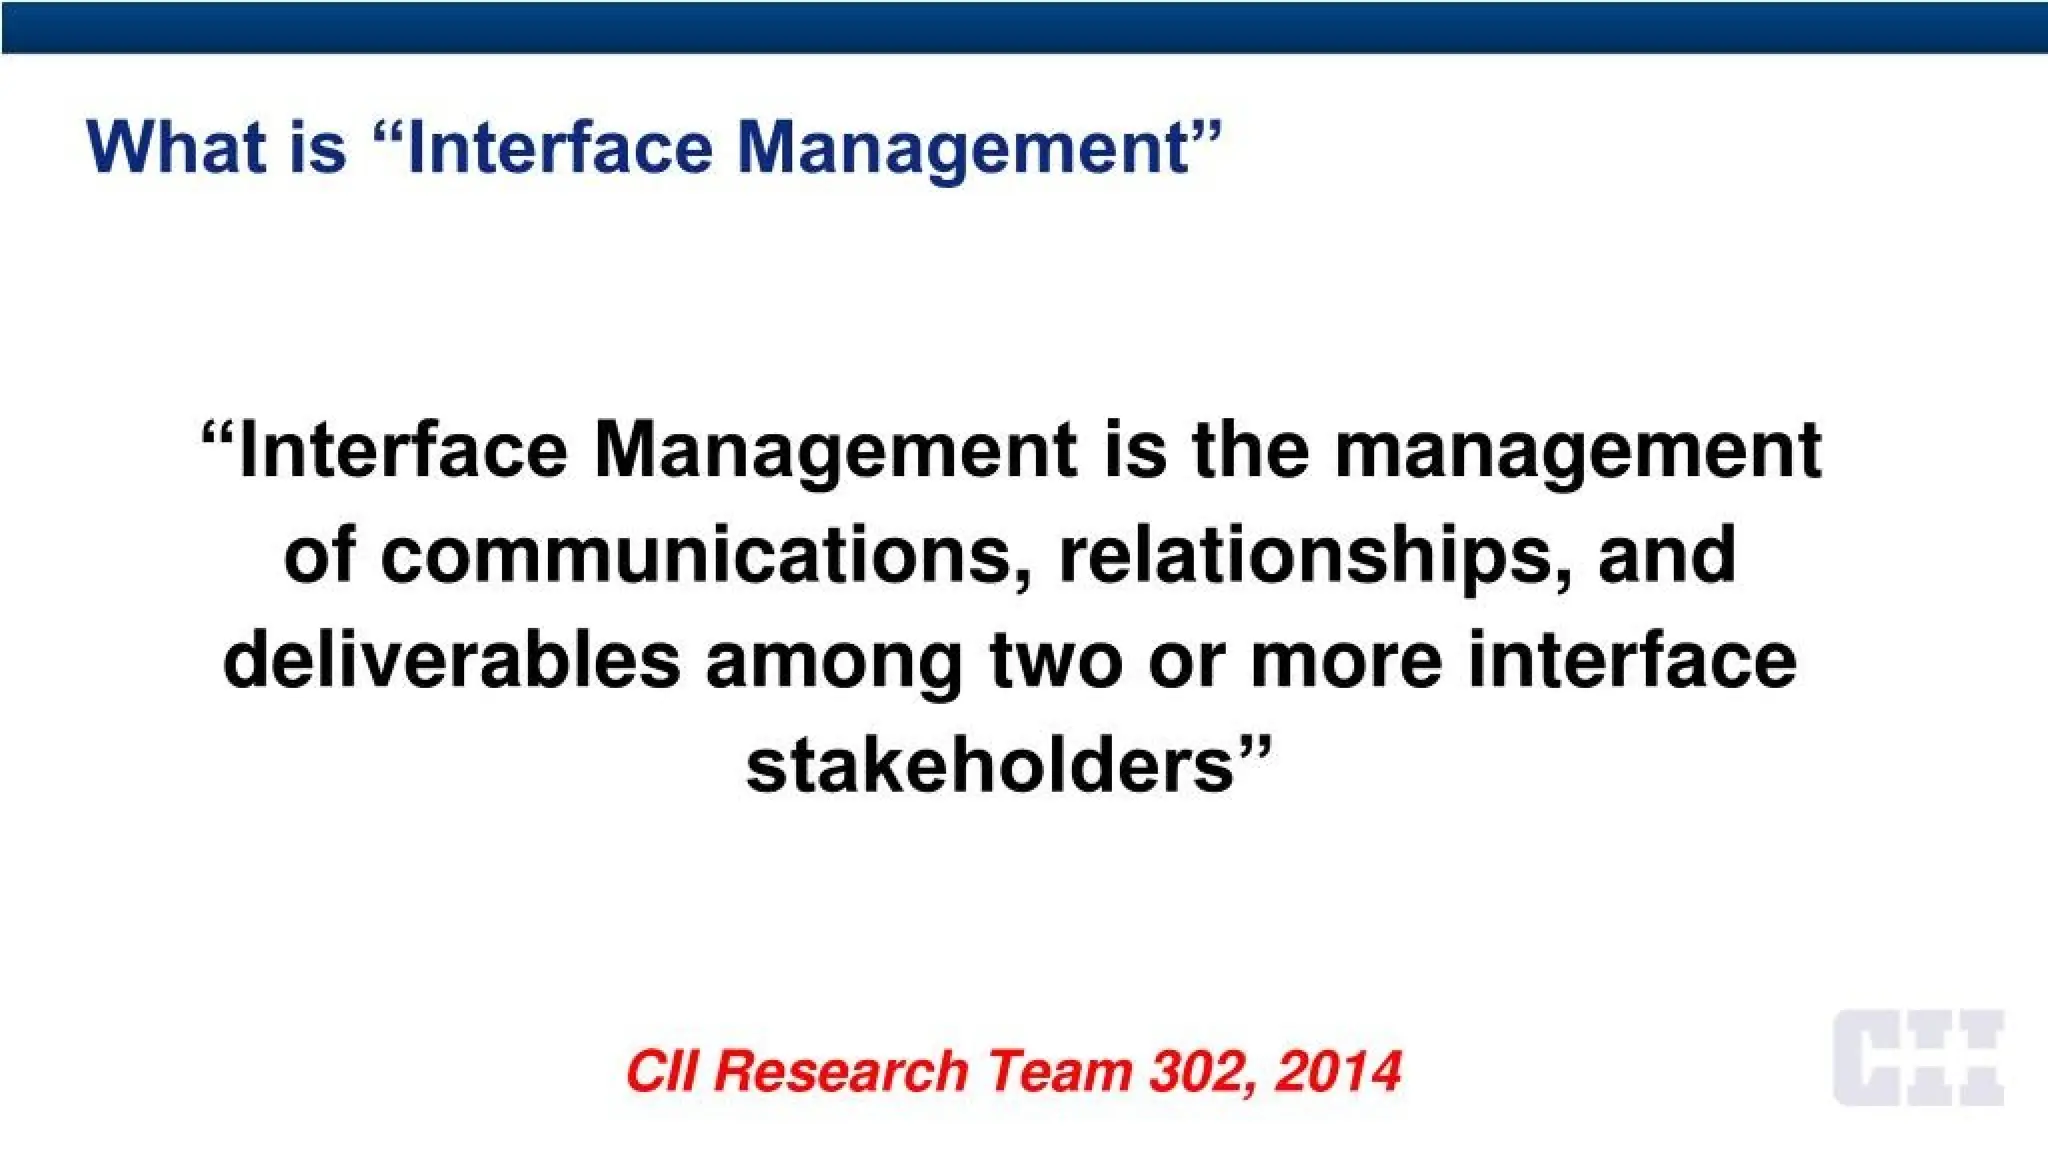
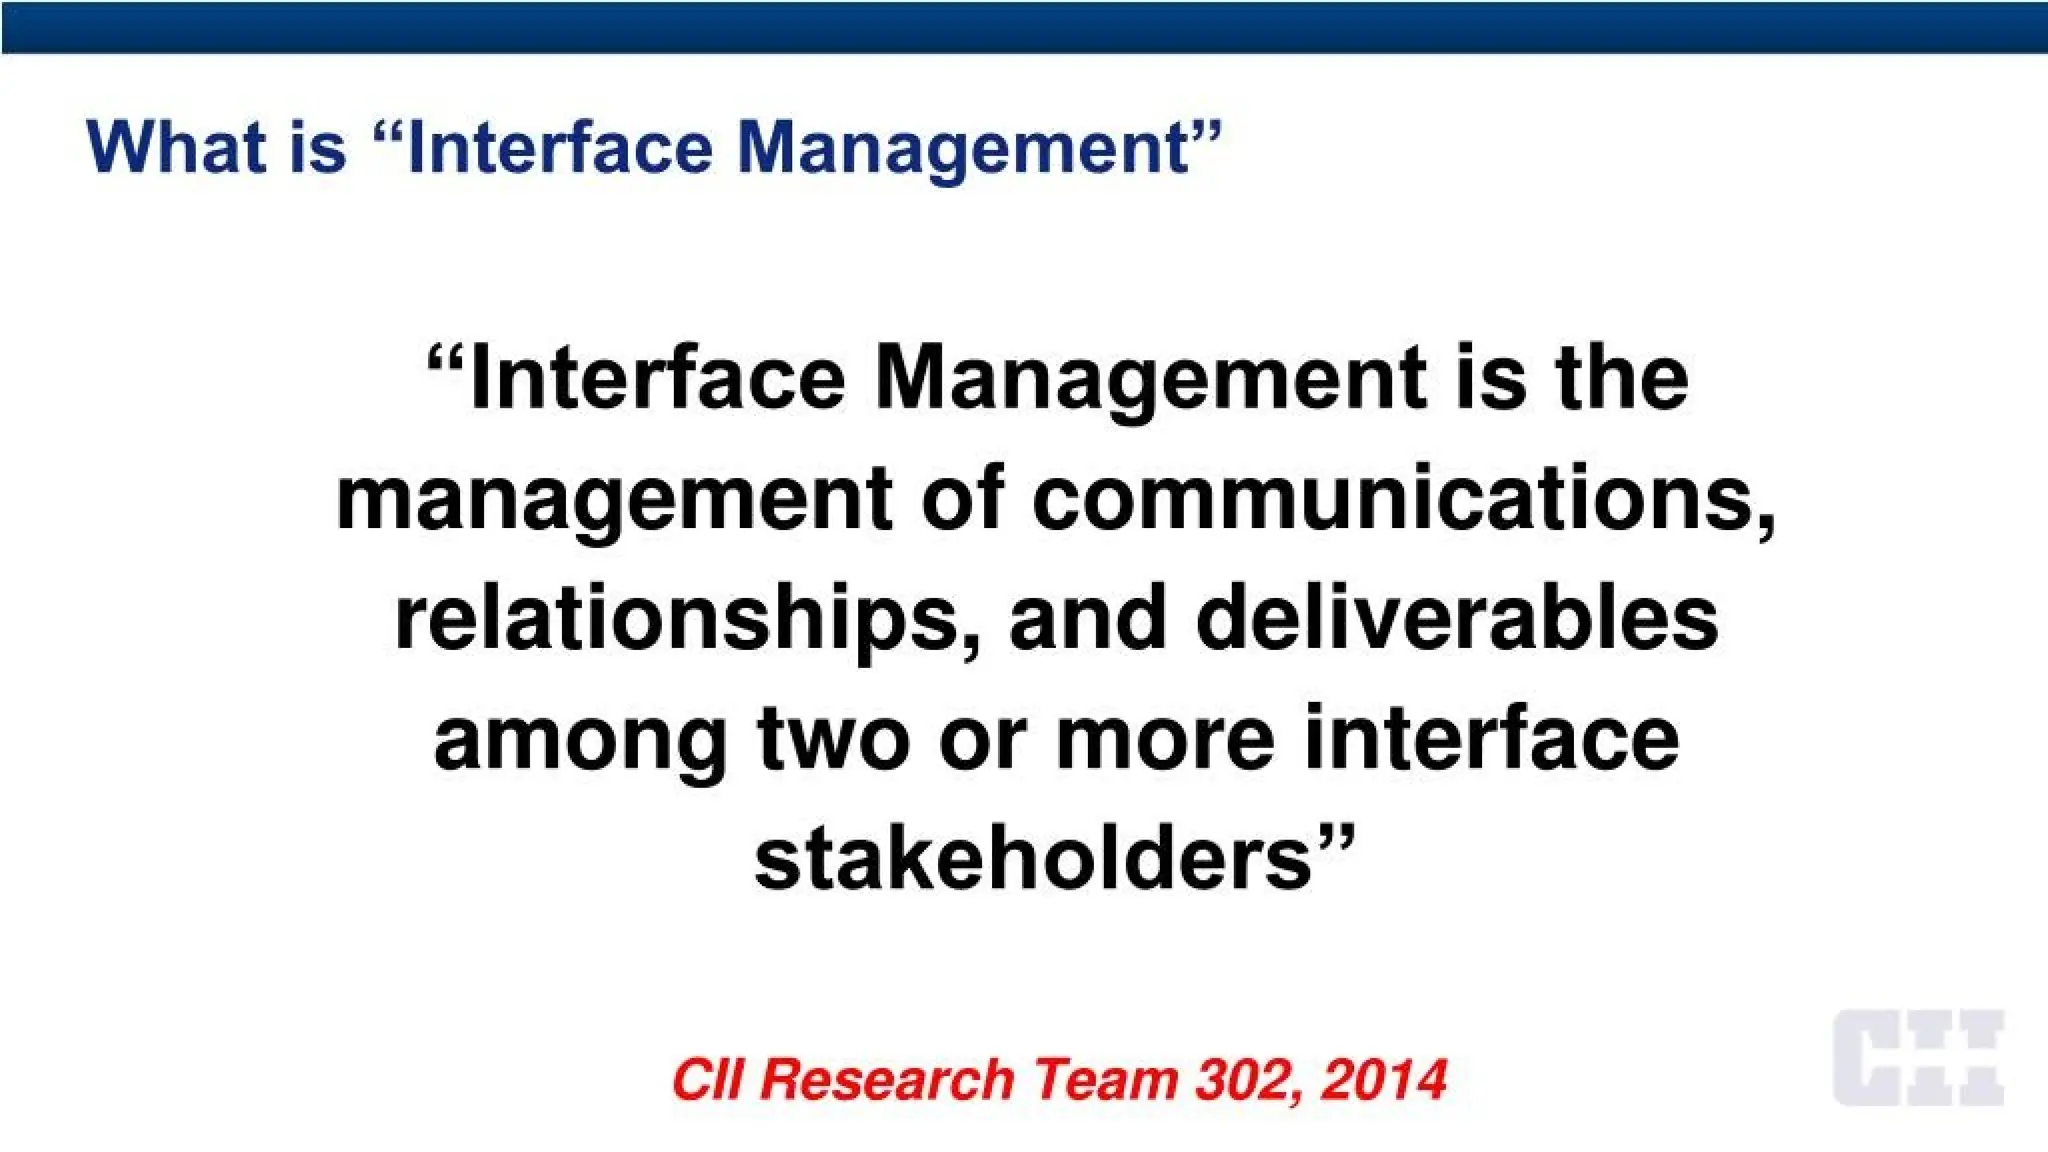
What is “InterfaceManagement”
“Interface Management is the management
of communications, relationships, and
deliverables among two or more interface
stakeholders”
CH Research Team 302, 2014
9.
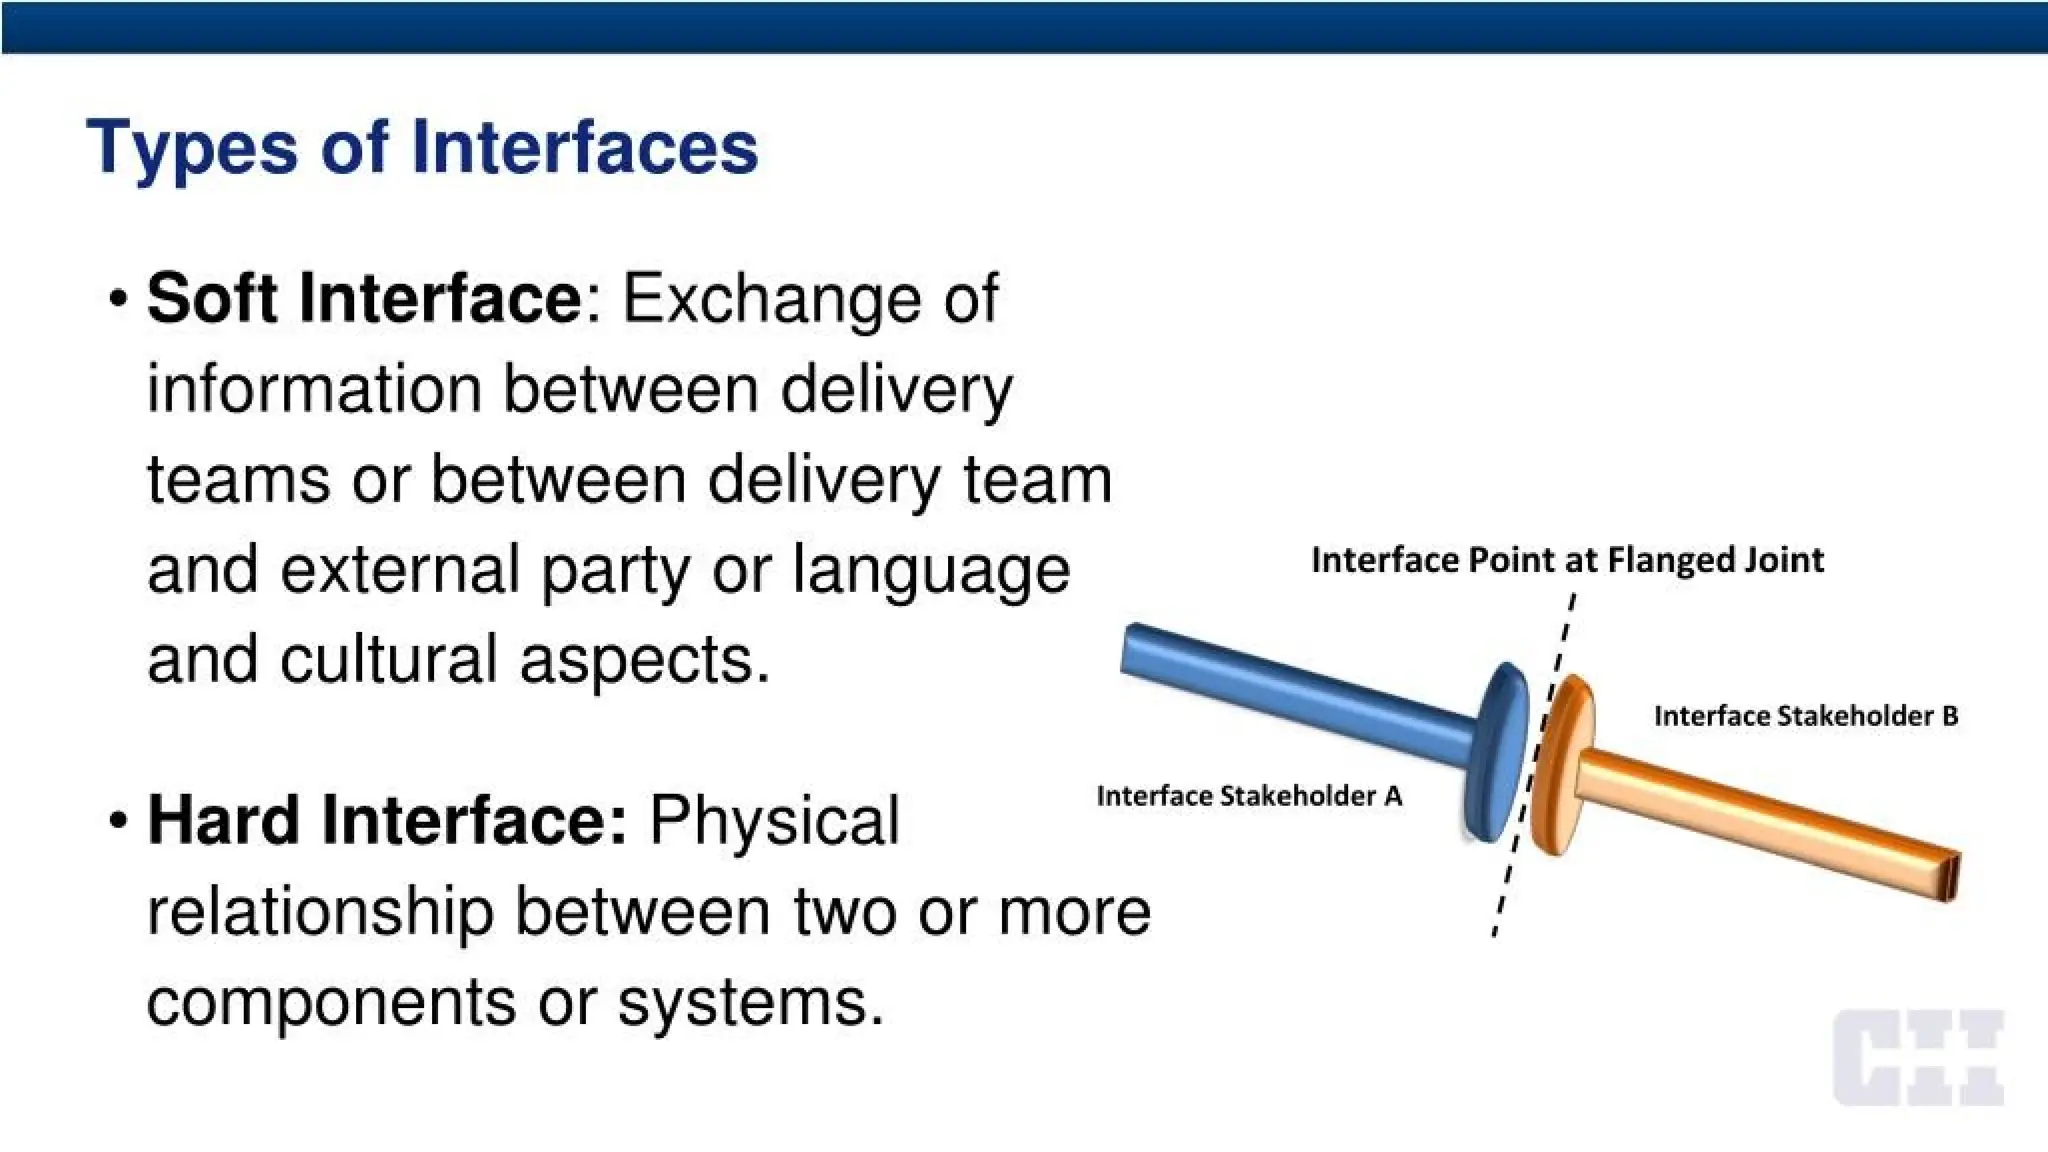
Types of Interfaces
•Soft Interface: Exchange of
information between delivery
teams or between delivery team
and external party or language
and cultural aspects.
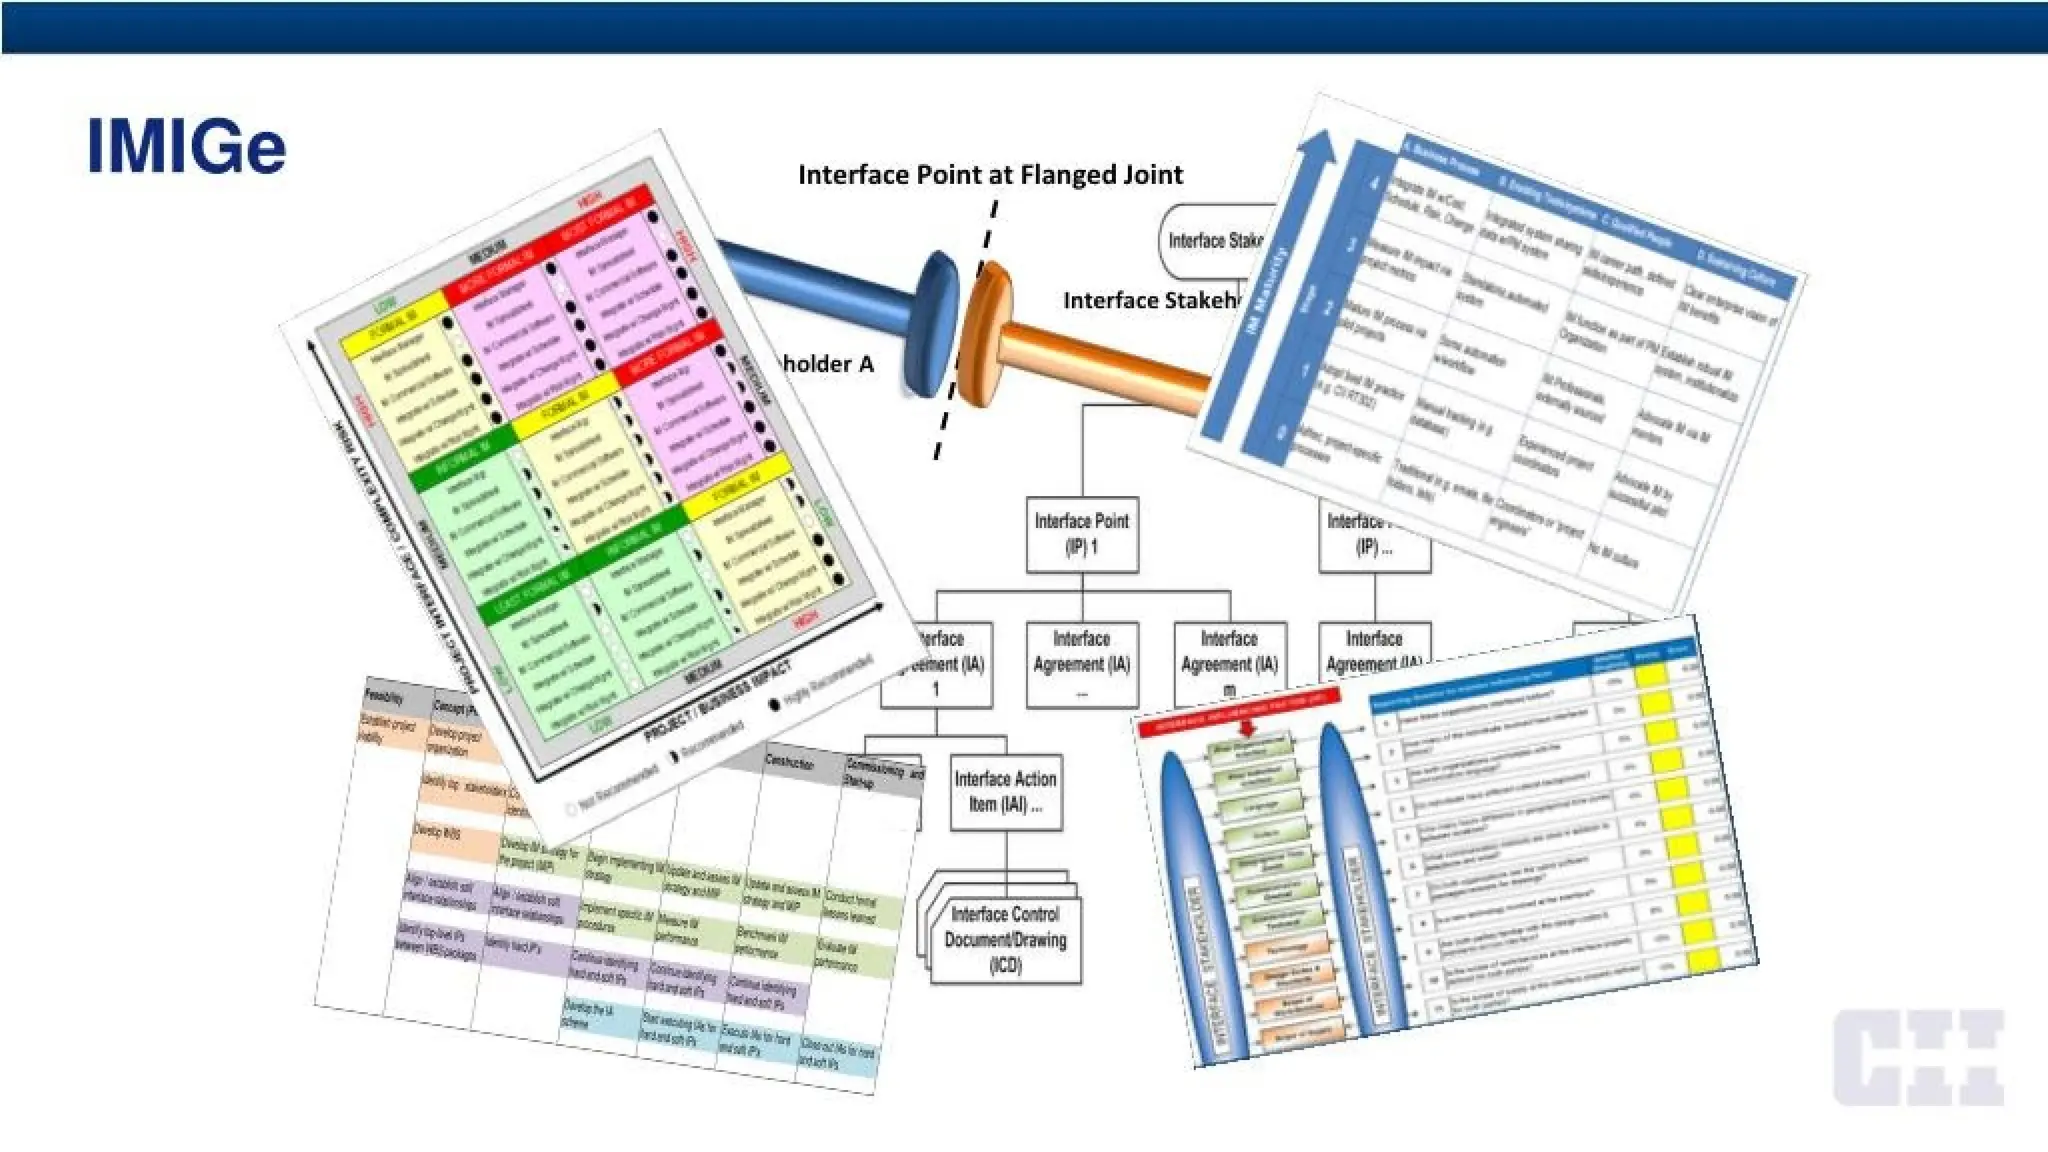
Interface Point at Flanged Joint
Interface Stakeholder B
Interface Stakeholder A
relationship between two or more
components or systems.
Hard Interface: Physical
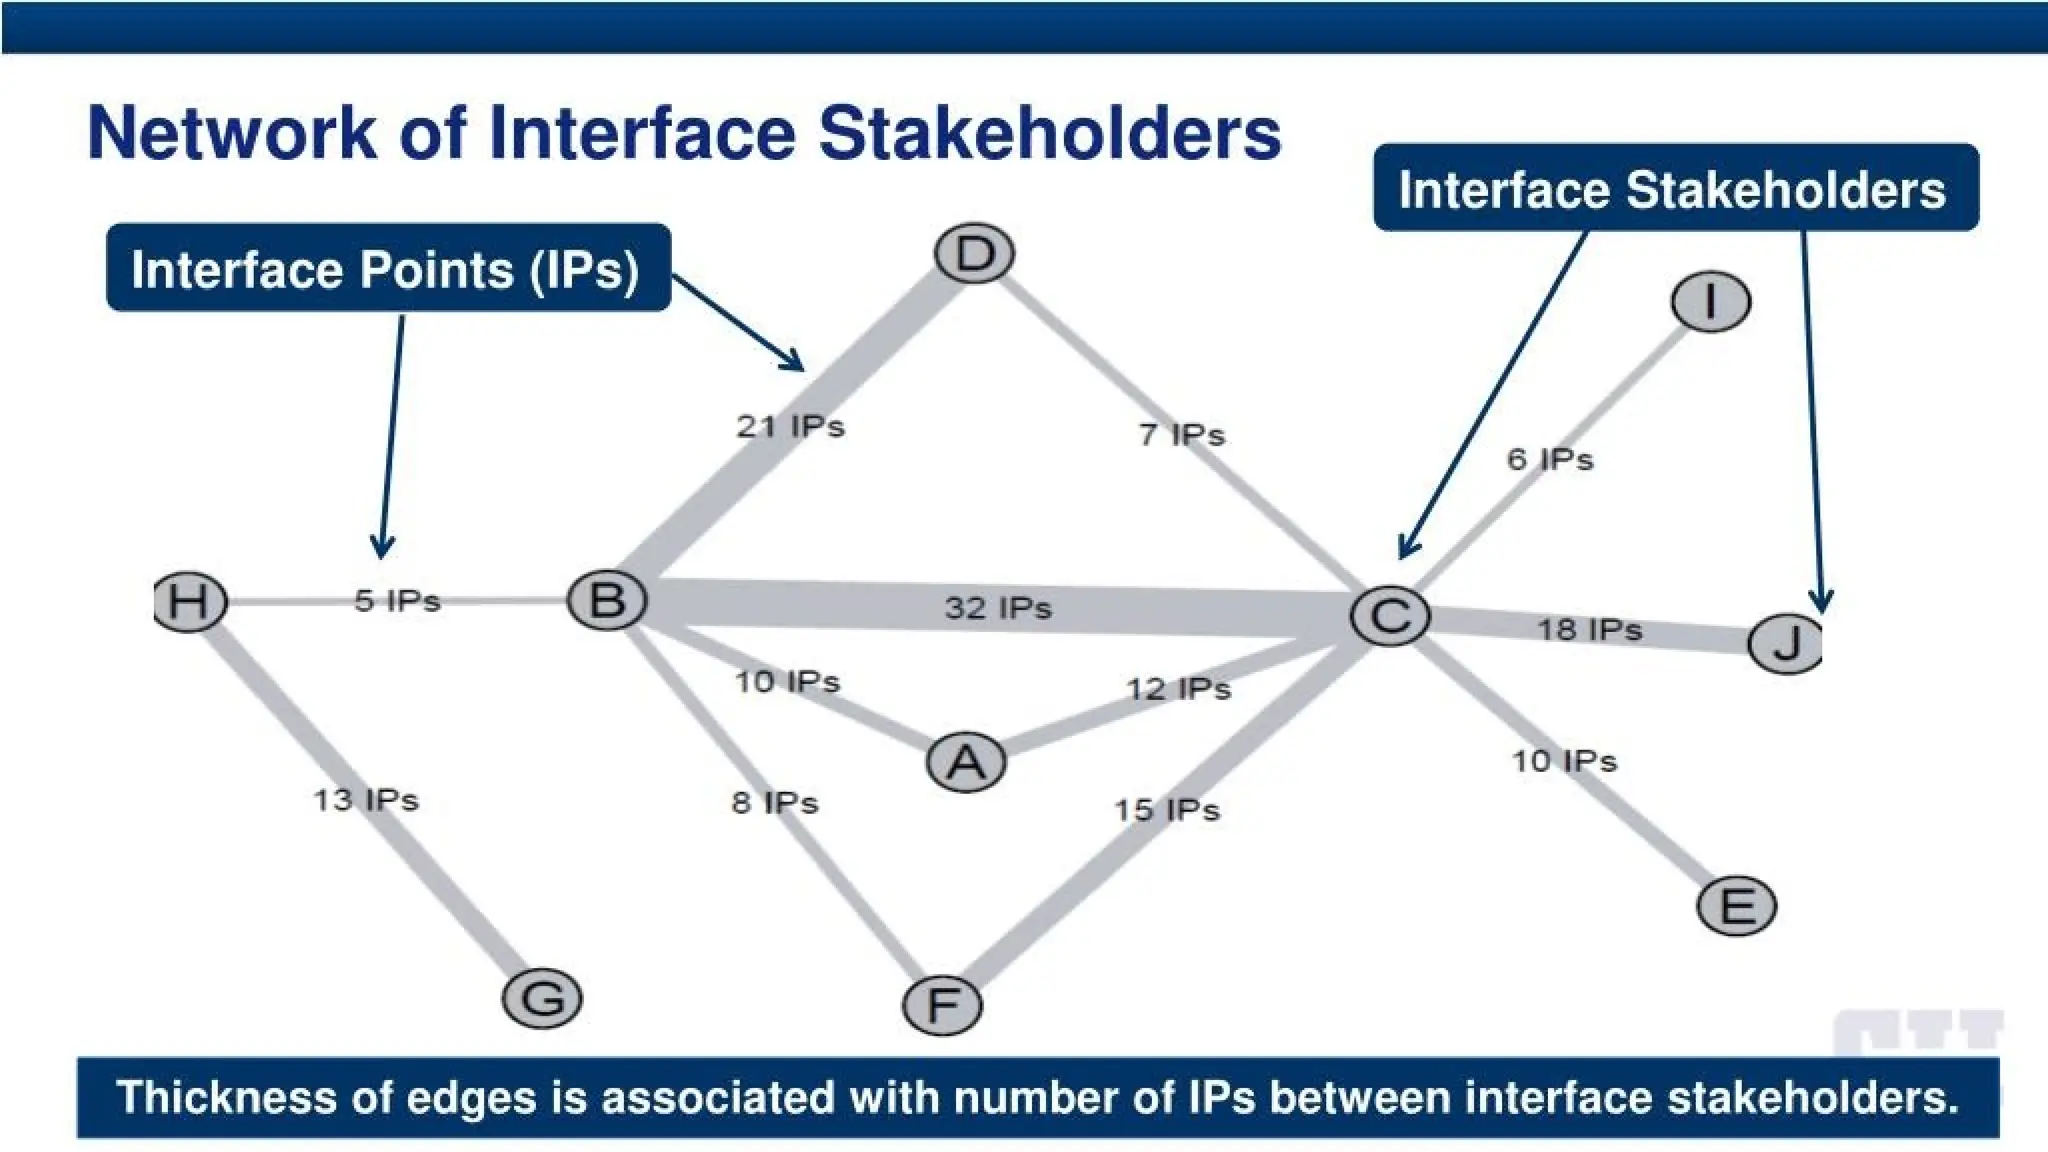
Network of InterfaceStakeholders
interface Stakeholders
Interface Points (IPs)
21 IPs
5 IPs 32 IPs
18 IPs
10 IPs 12 IPs
10 IPs
13 IPs 8 IPs
Thickness of edges is associated with number of IPs between interface stakeholders.
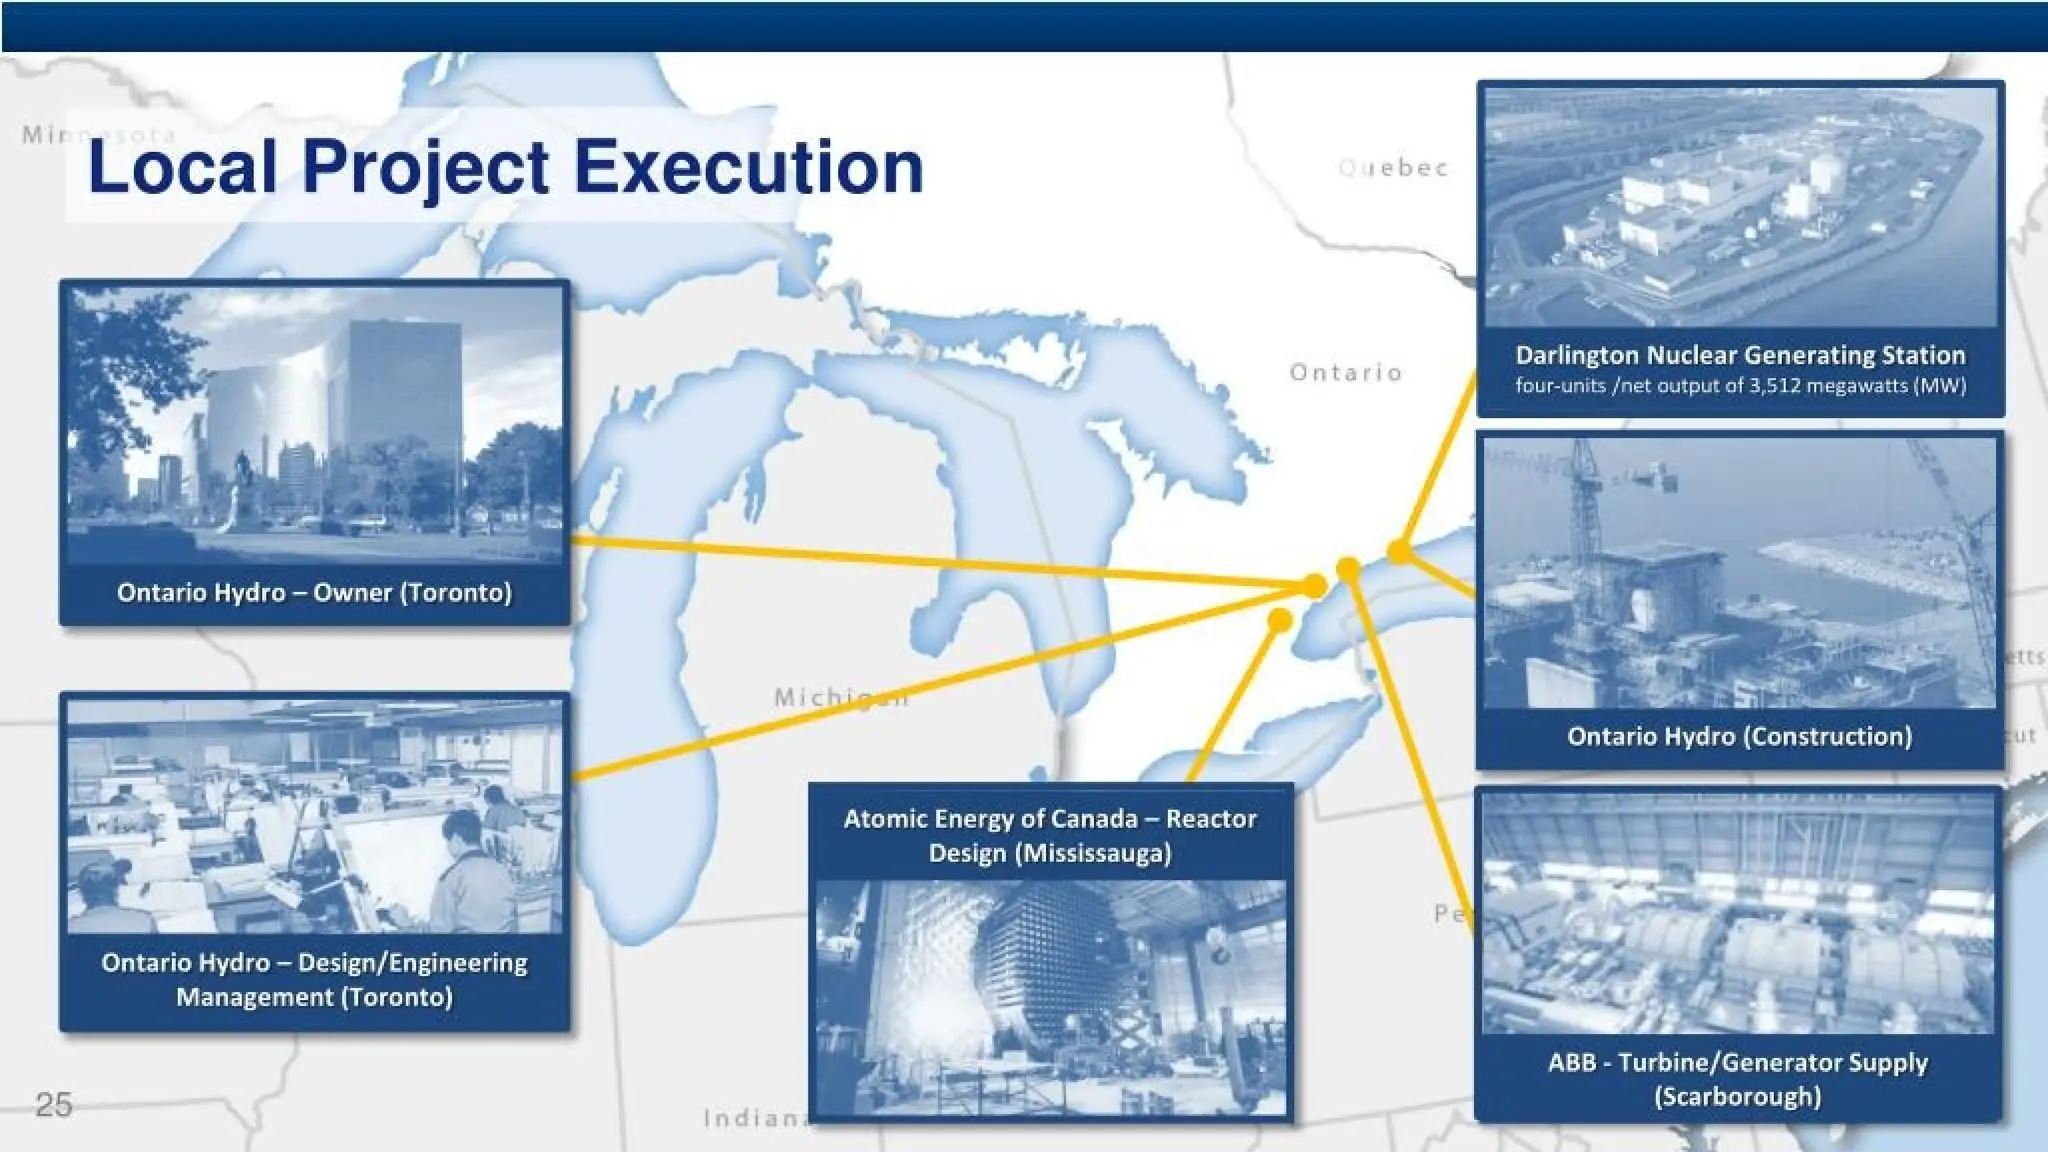
12.
What is “InterfaceManagement”
“Interface Management is the
management of communications,
relationships, and deliverables
among two or more interface
stakeholders”
CH Research Team 302, 2014
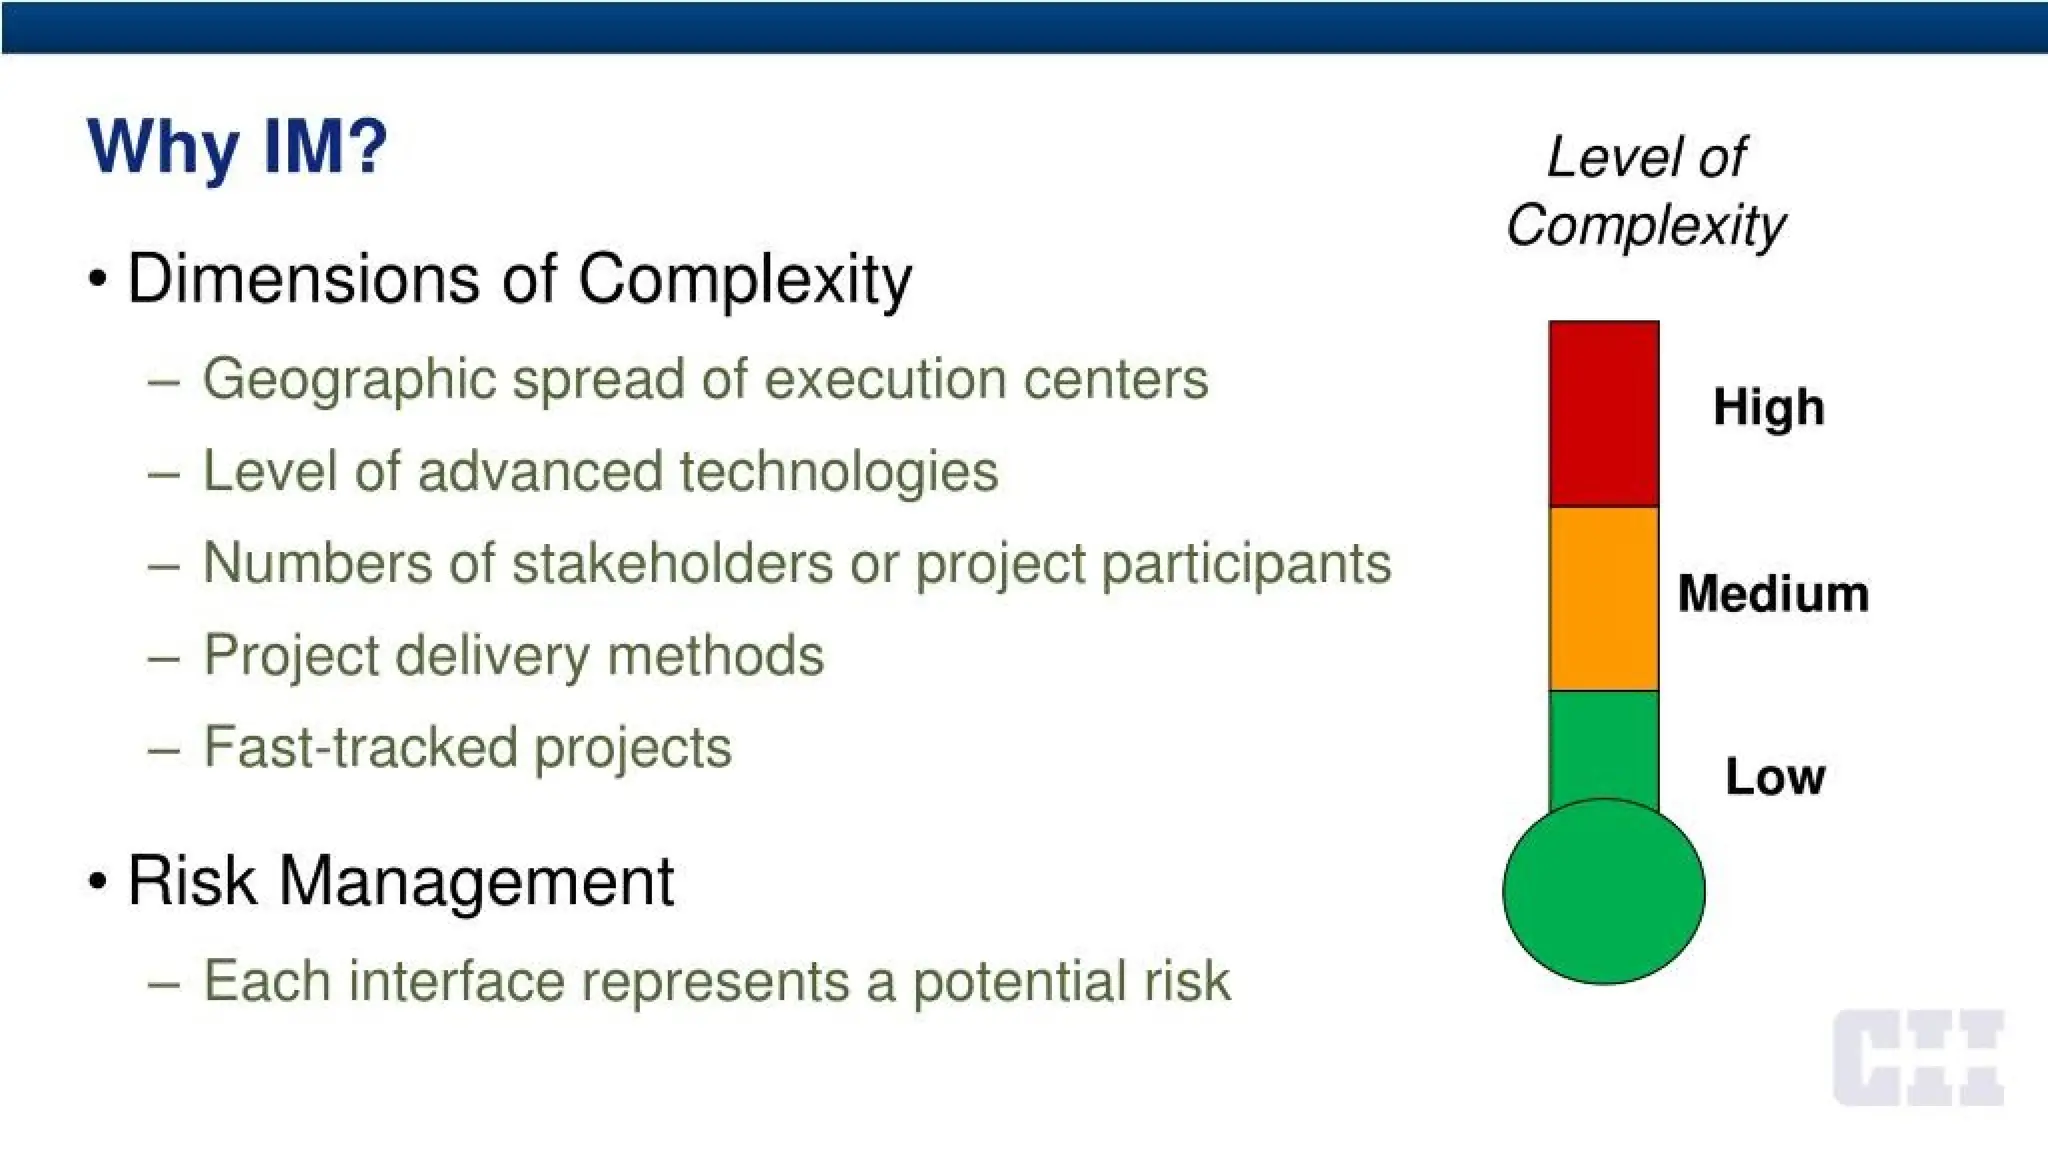
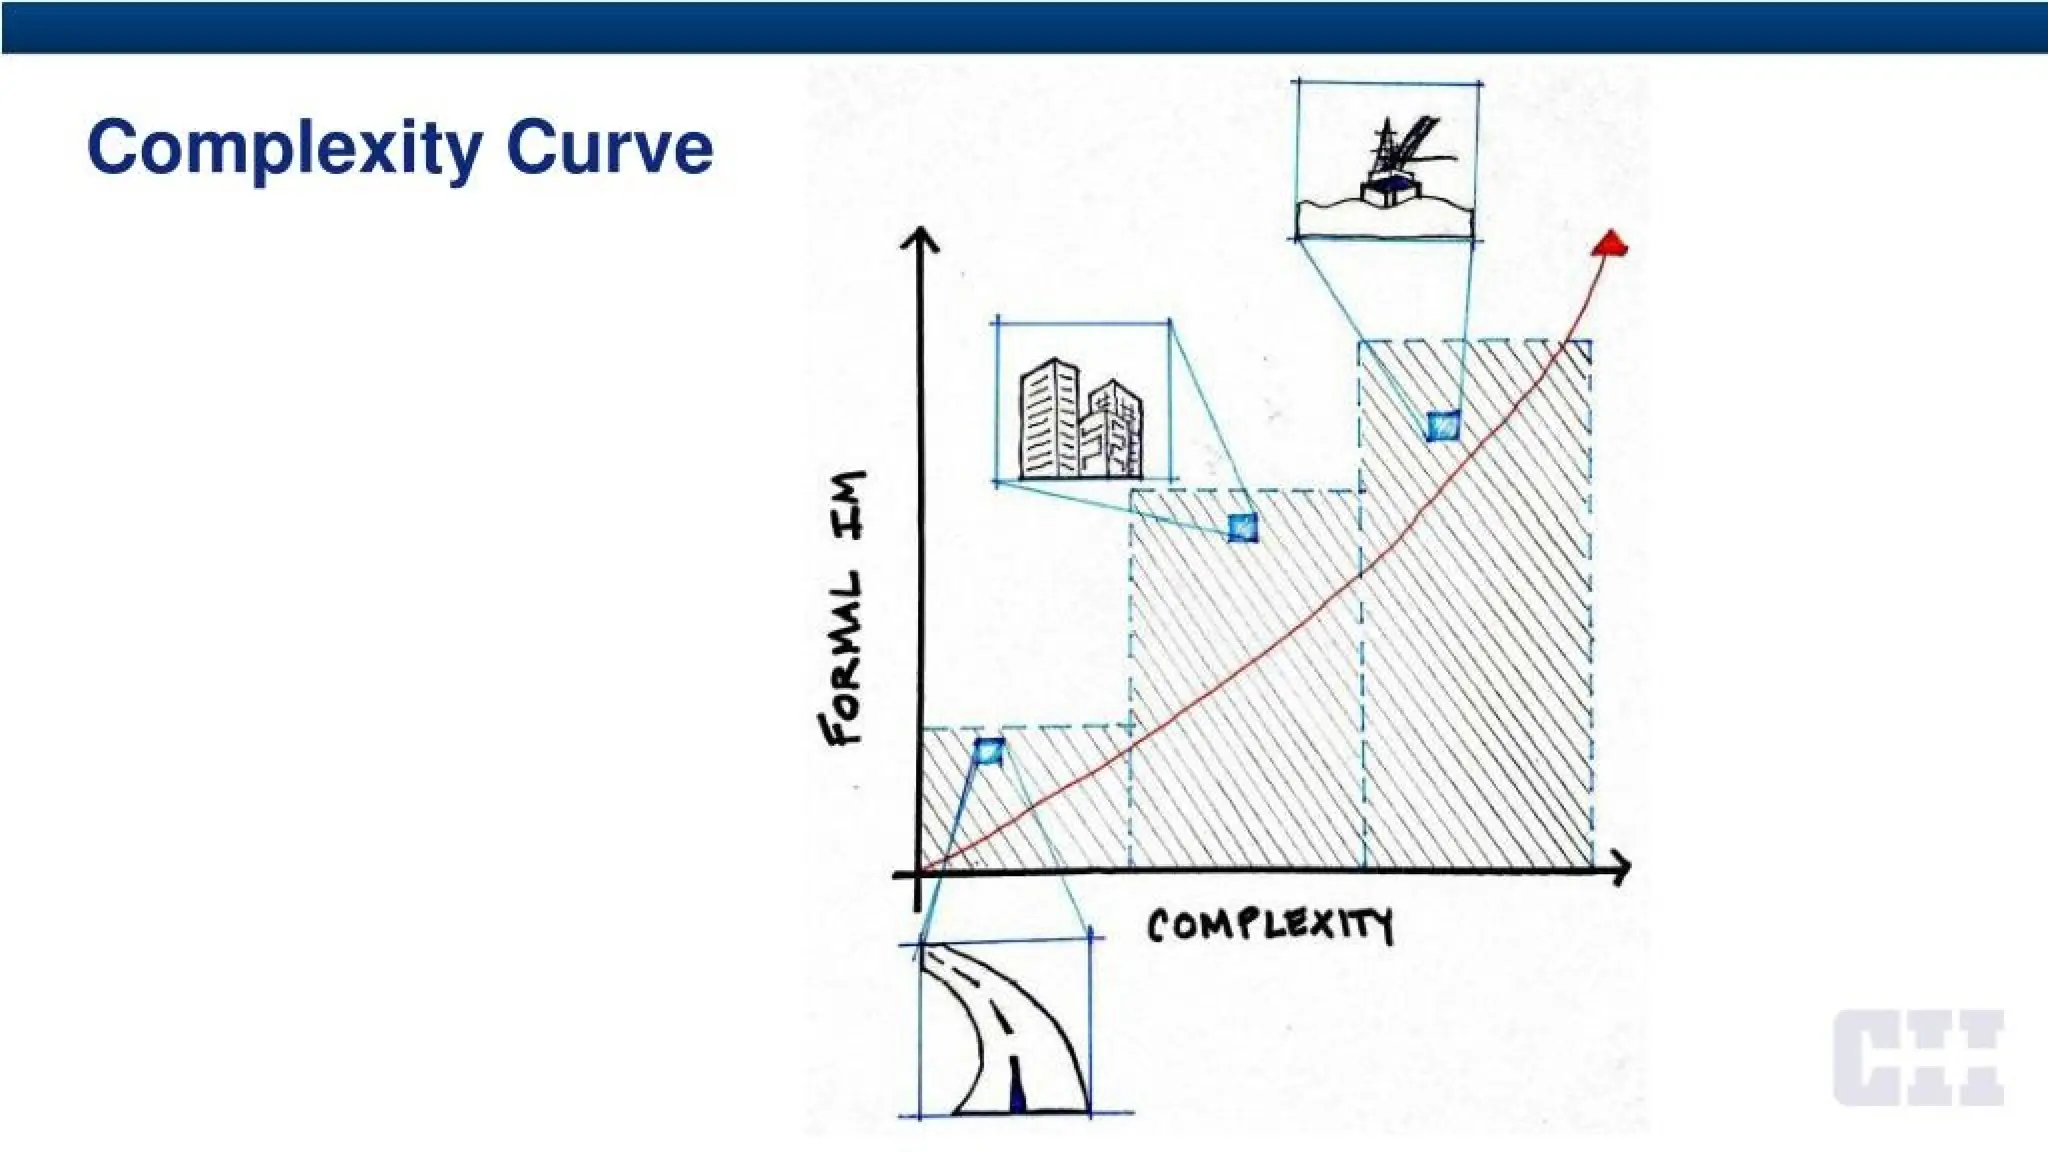
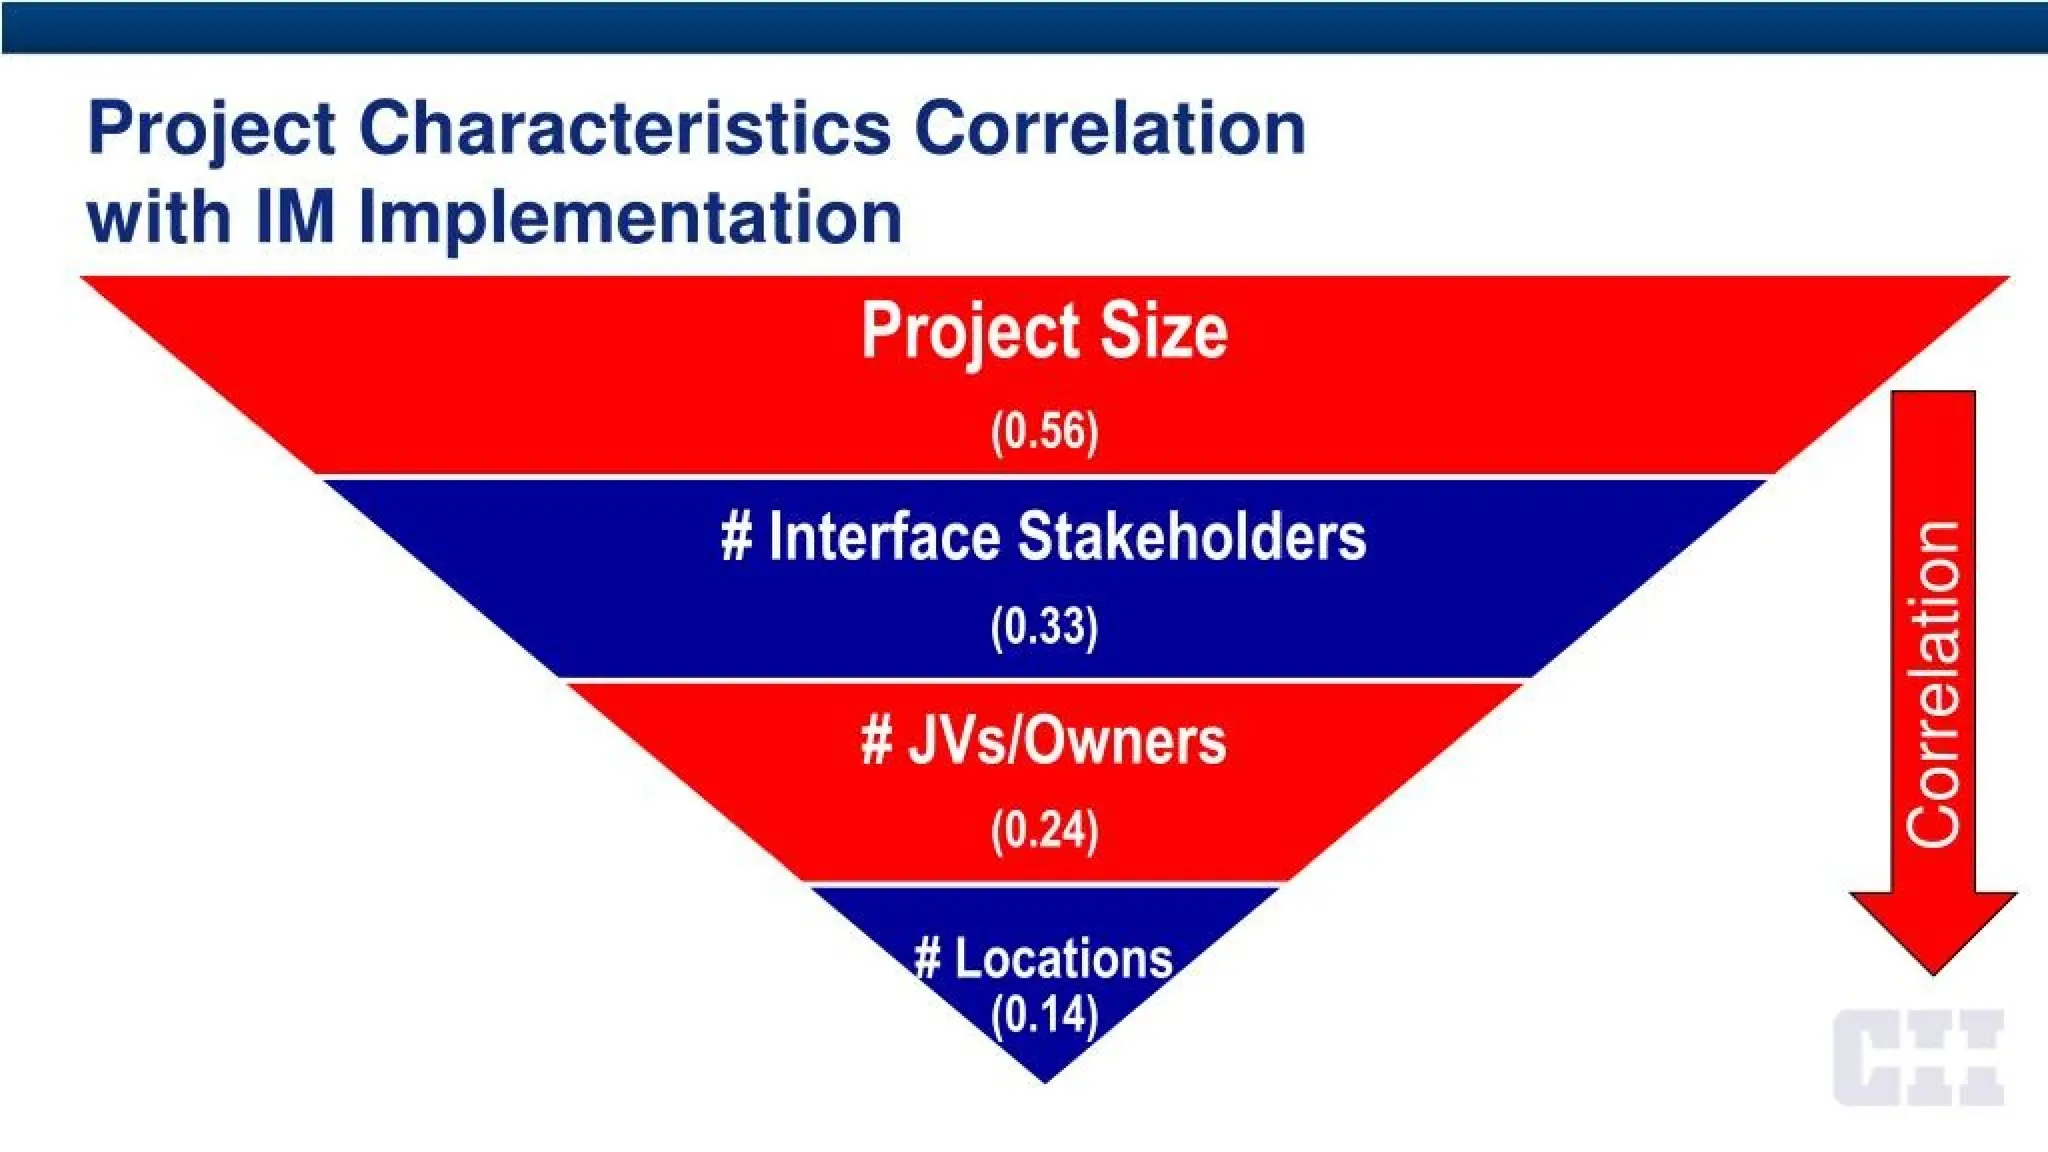
Why IM?
• Dimensionsof Complexity
- Geographic spread of execution centers
- Level of advanced technologies
- Numbers of stakeholders or project participants
- Project delivery methods
- Fast-tracked projects
• Risk Management
- Each interface represents a potential risk
Level of
Complexity
Medium
Low
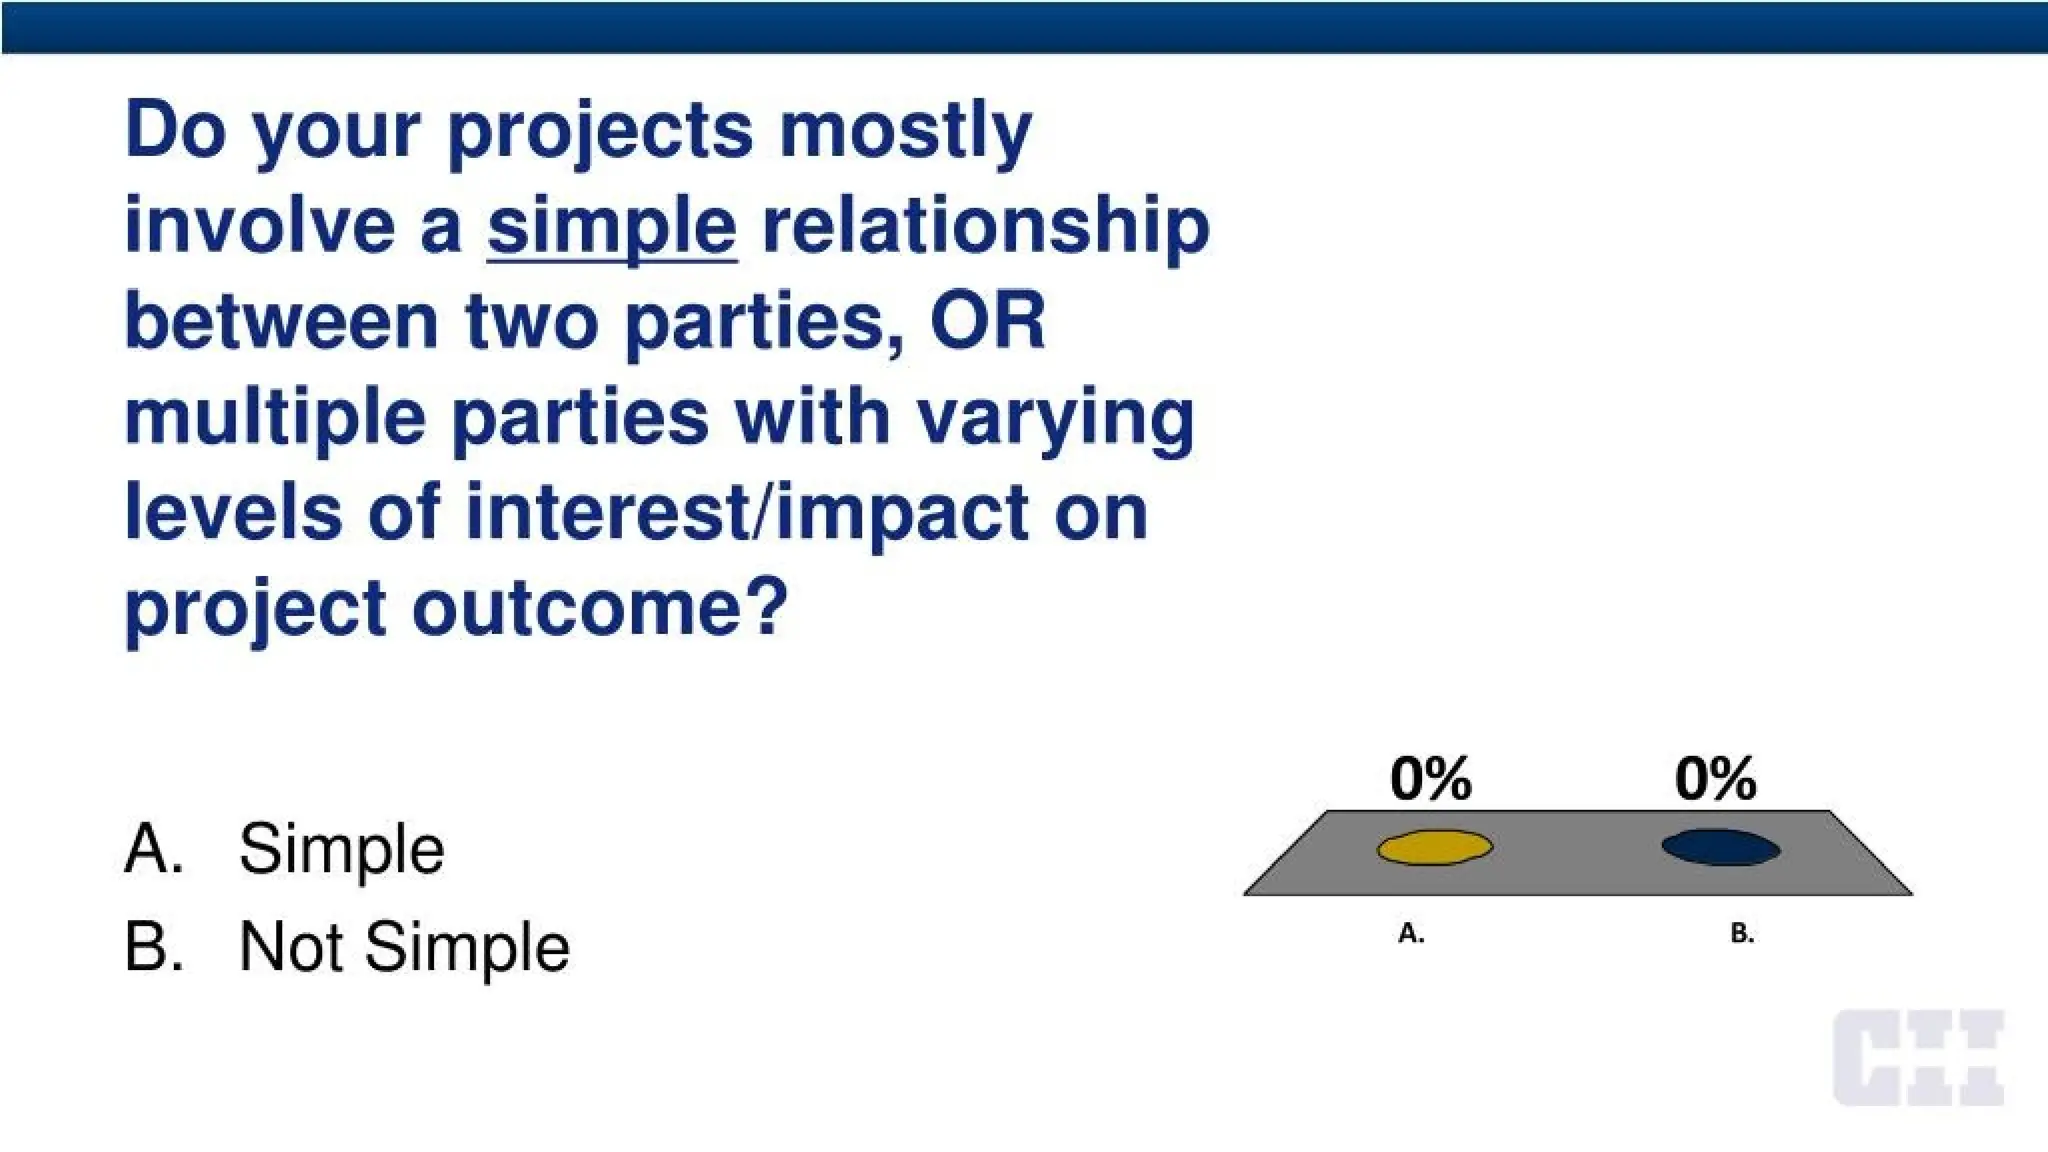
15.
Do your projectsmostly
involve a simple relationship
between two parties, OR
multiple parties with varying
levels of interest/impact on
project outcome?
o% 0%
A. Simple
B. Not Simple A. B.
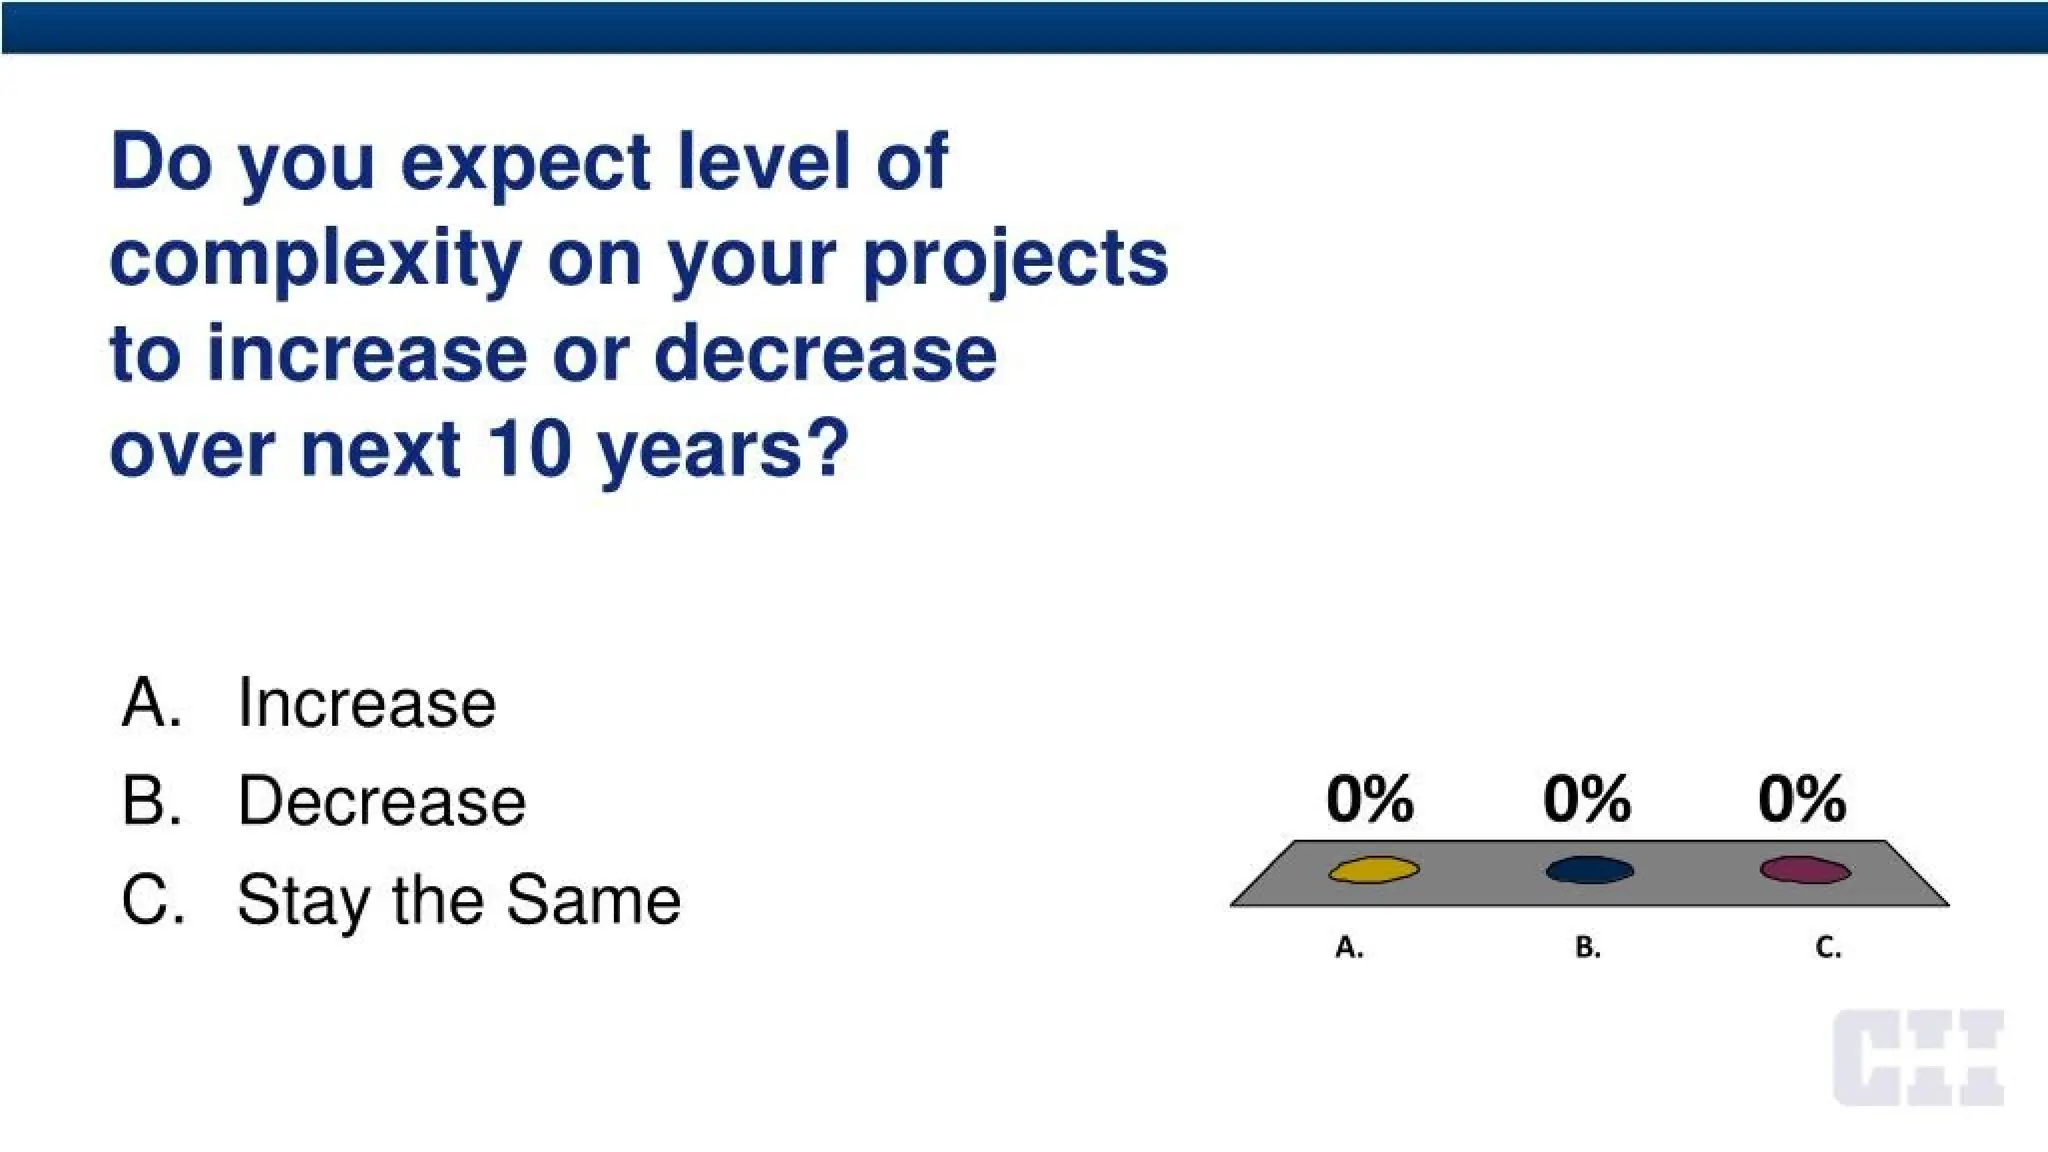
16.
Do you expectlevel of
complexity on your projects
to increase or decrease
over next 10 years?
A. Increase
B. Decrease
C. Stay the Same
0% 0% 0%
A, B,
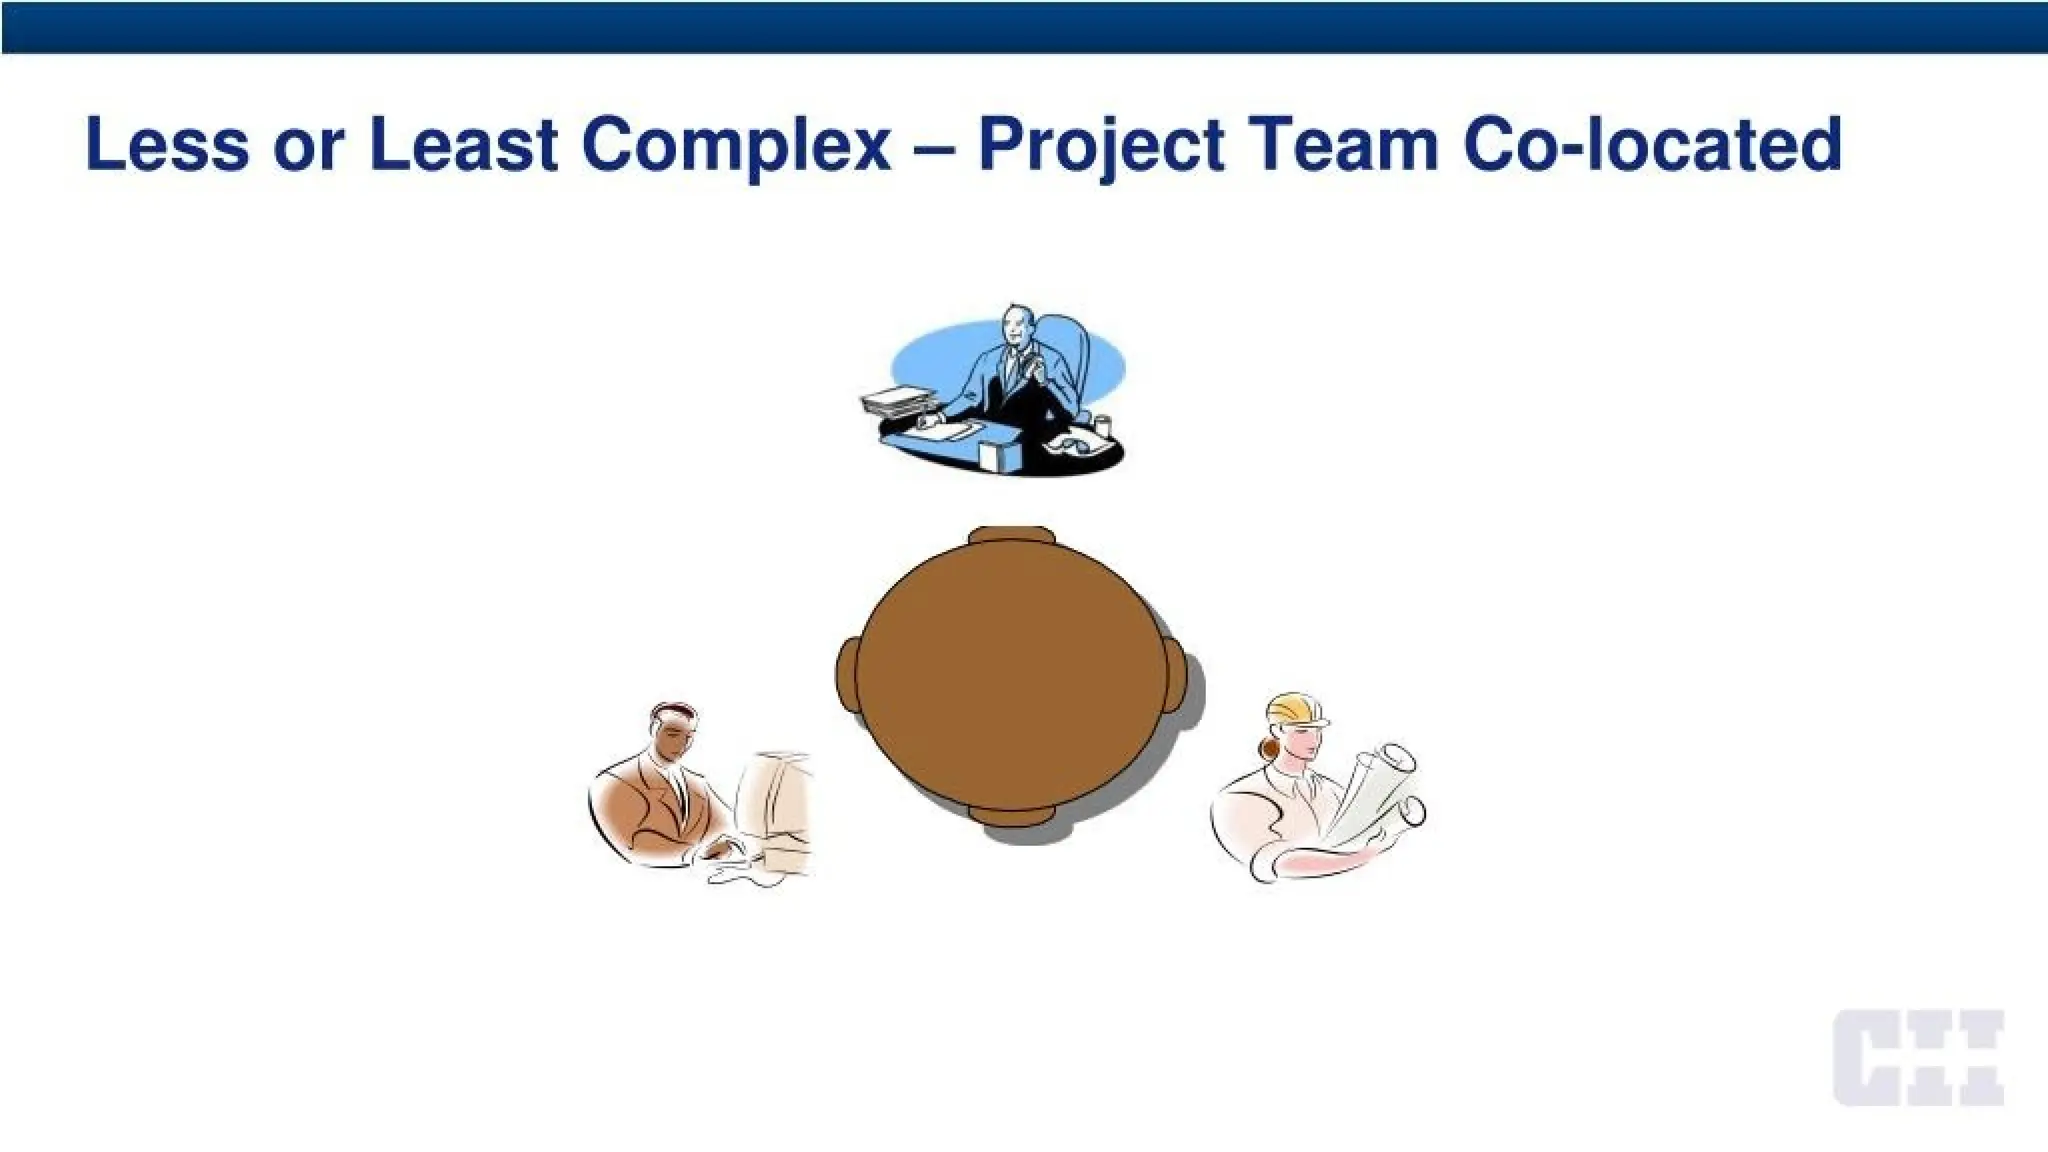
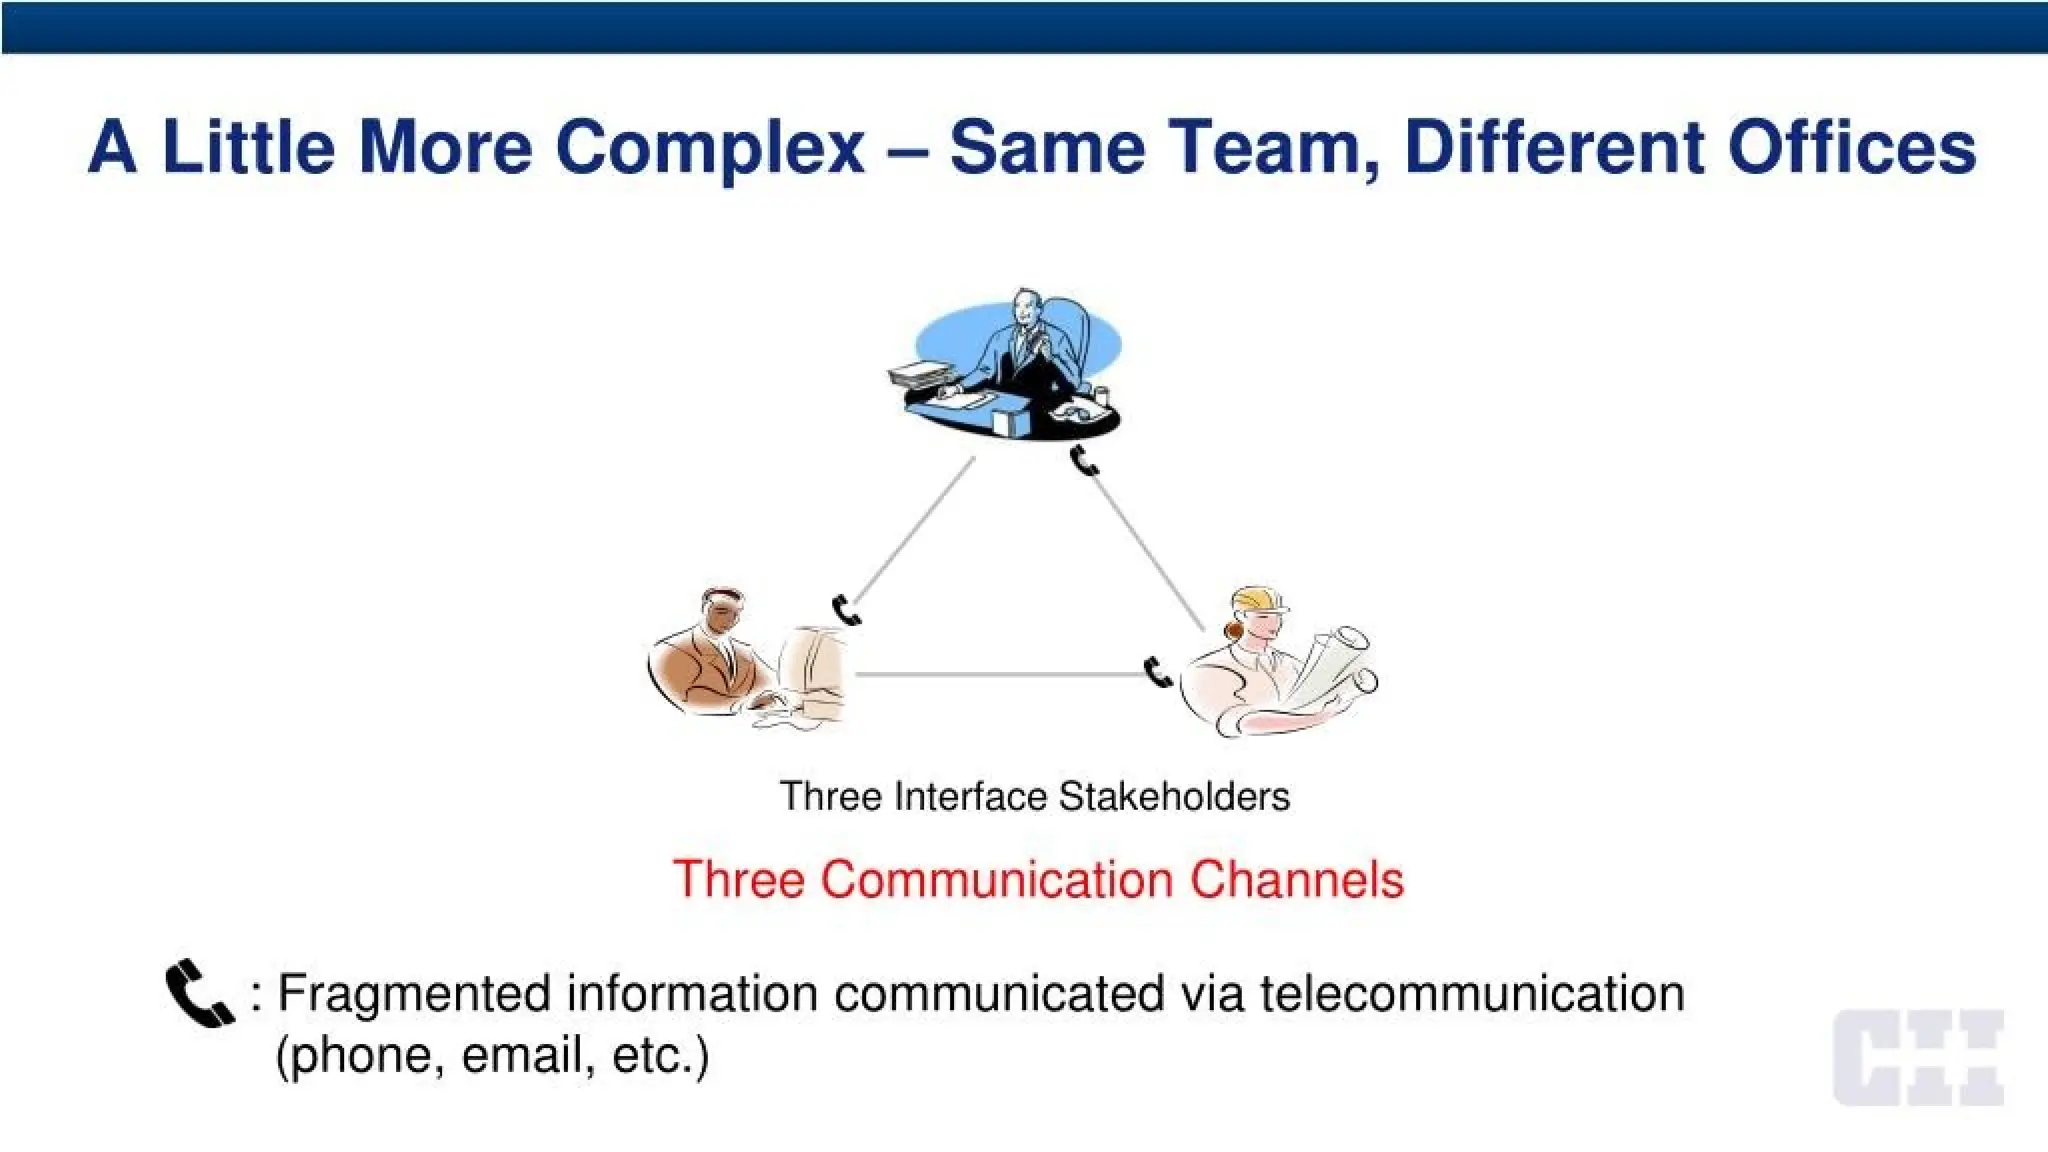
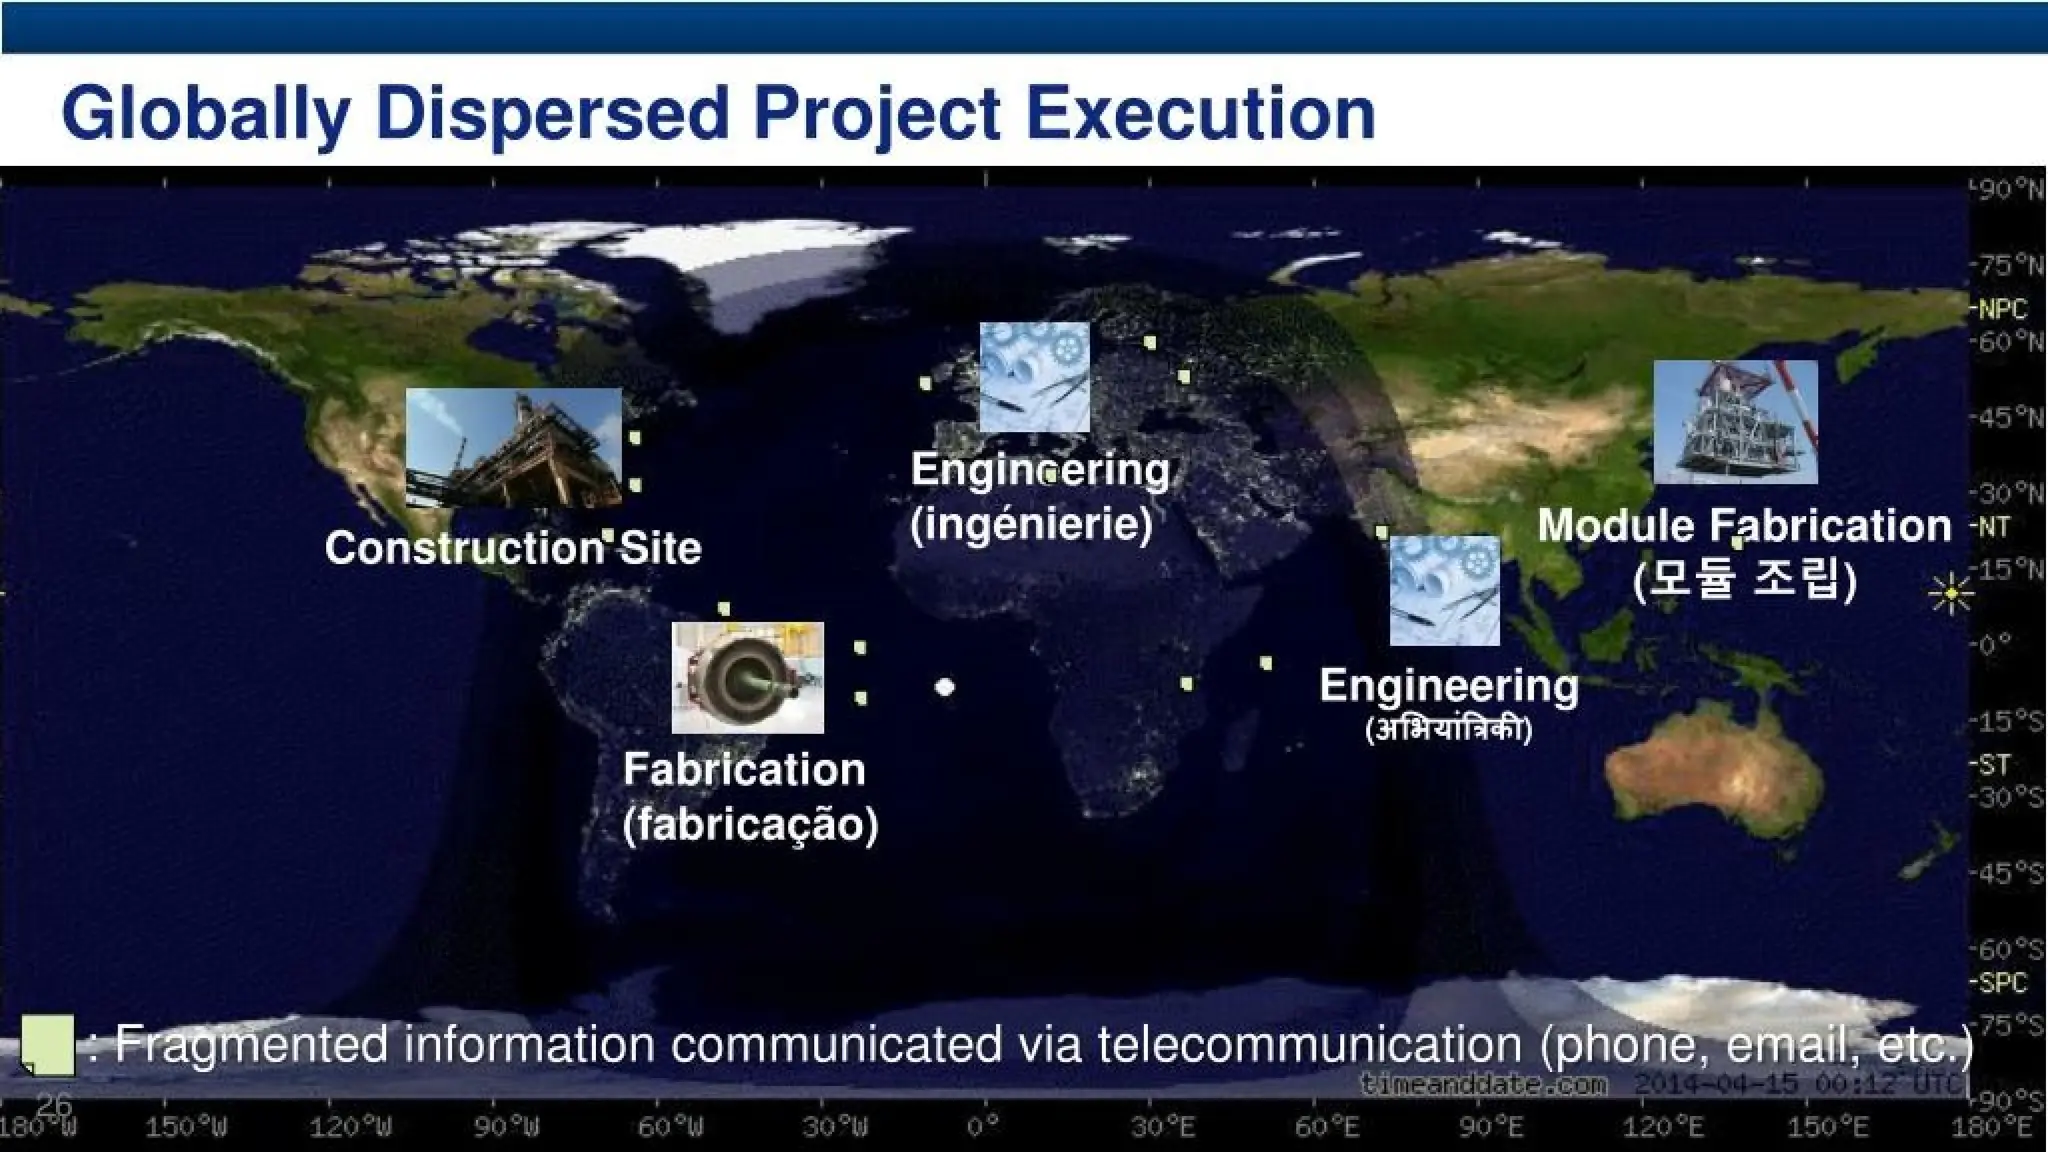
A Little MoreComplex - Same Team, Different Offices
Three Interface Stakeholders
Three Communication Channels
: Fragmented information communicated via telecommunication
(phone, email, etc.)
19.
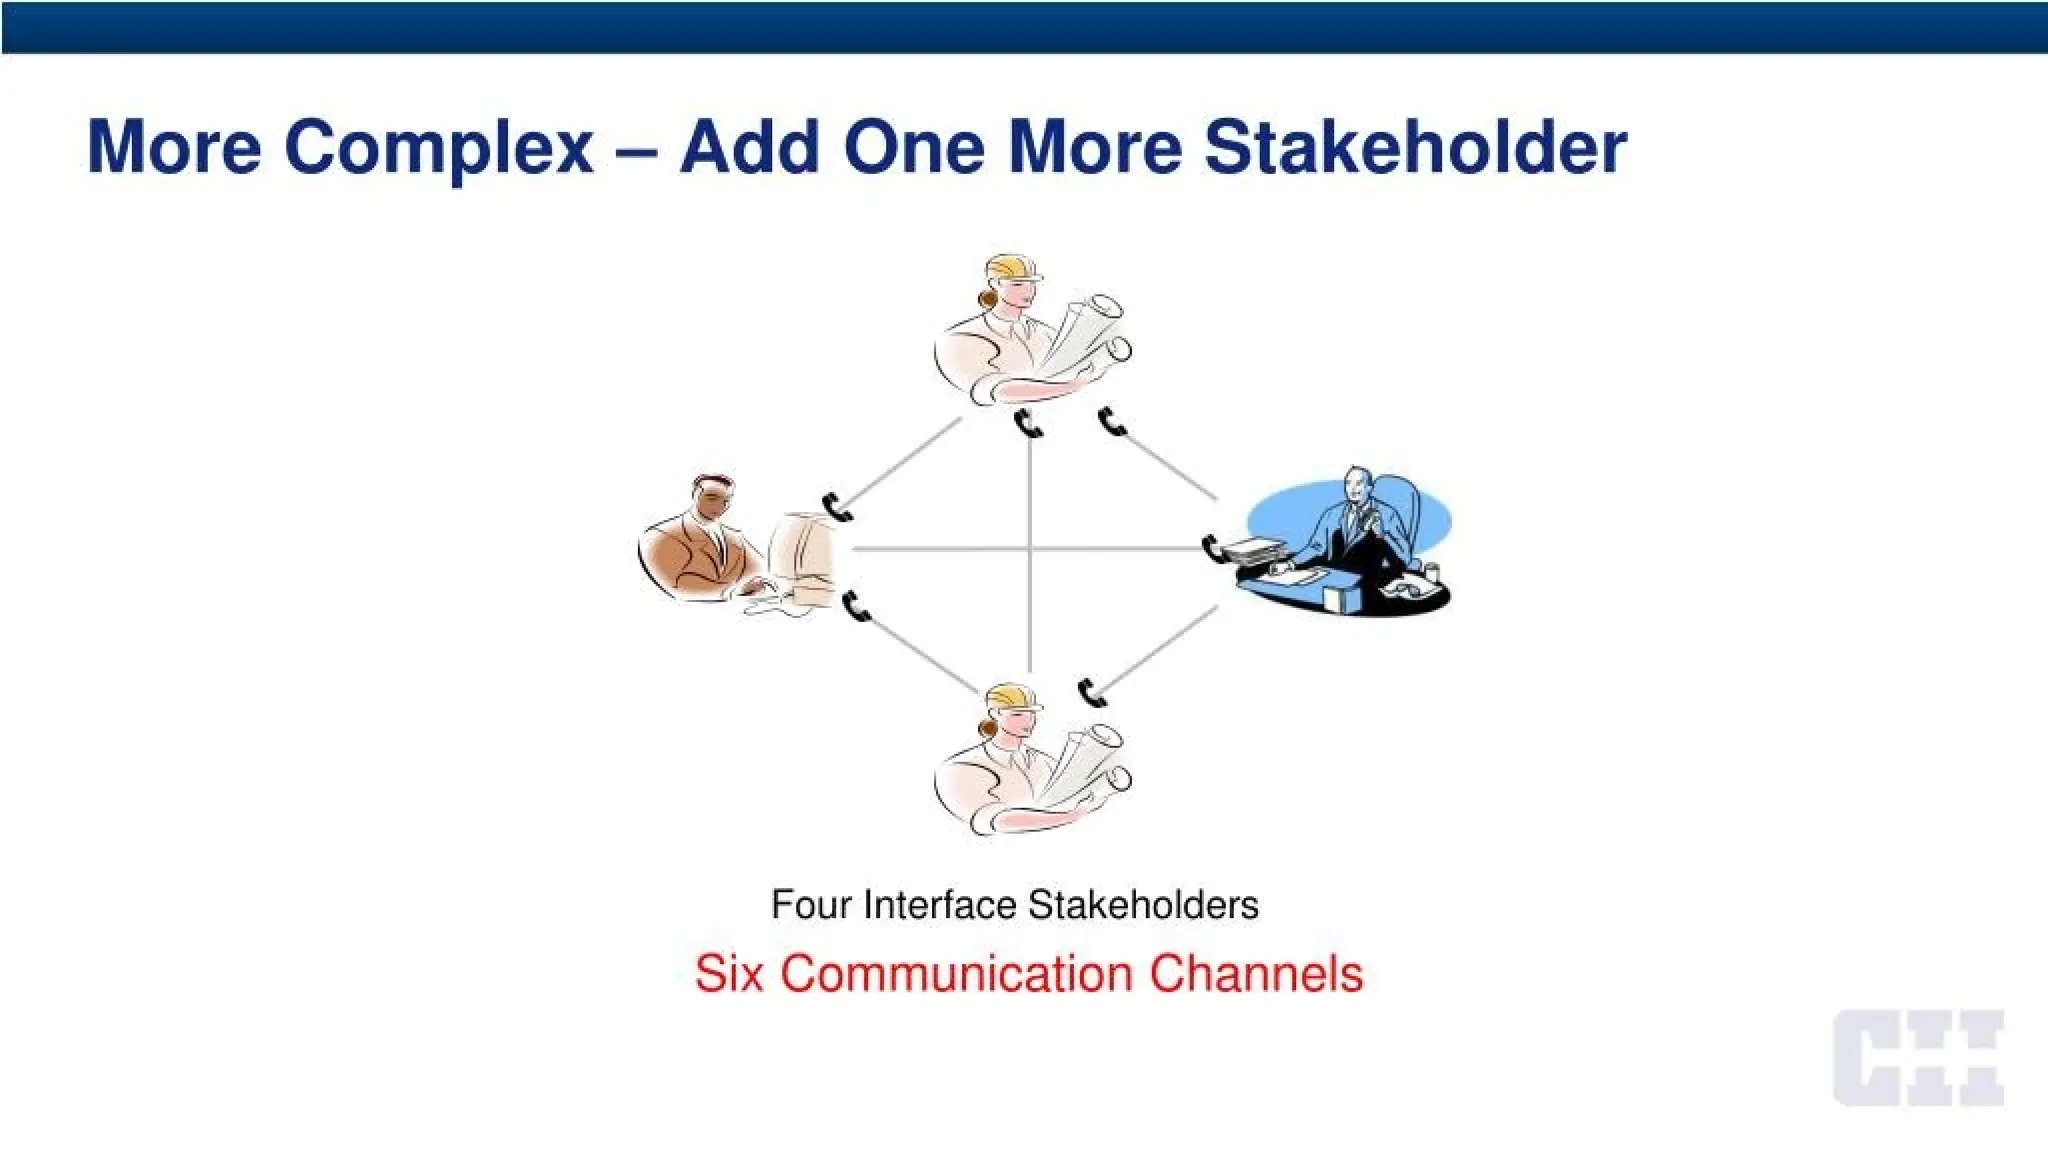
More Complex -Add One More Stakeholder
Four Interface Stakeholders
Six Communication Channels
20.
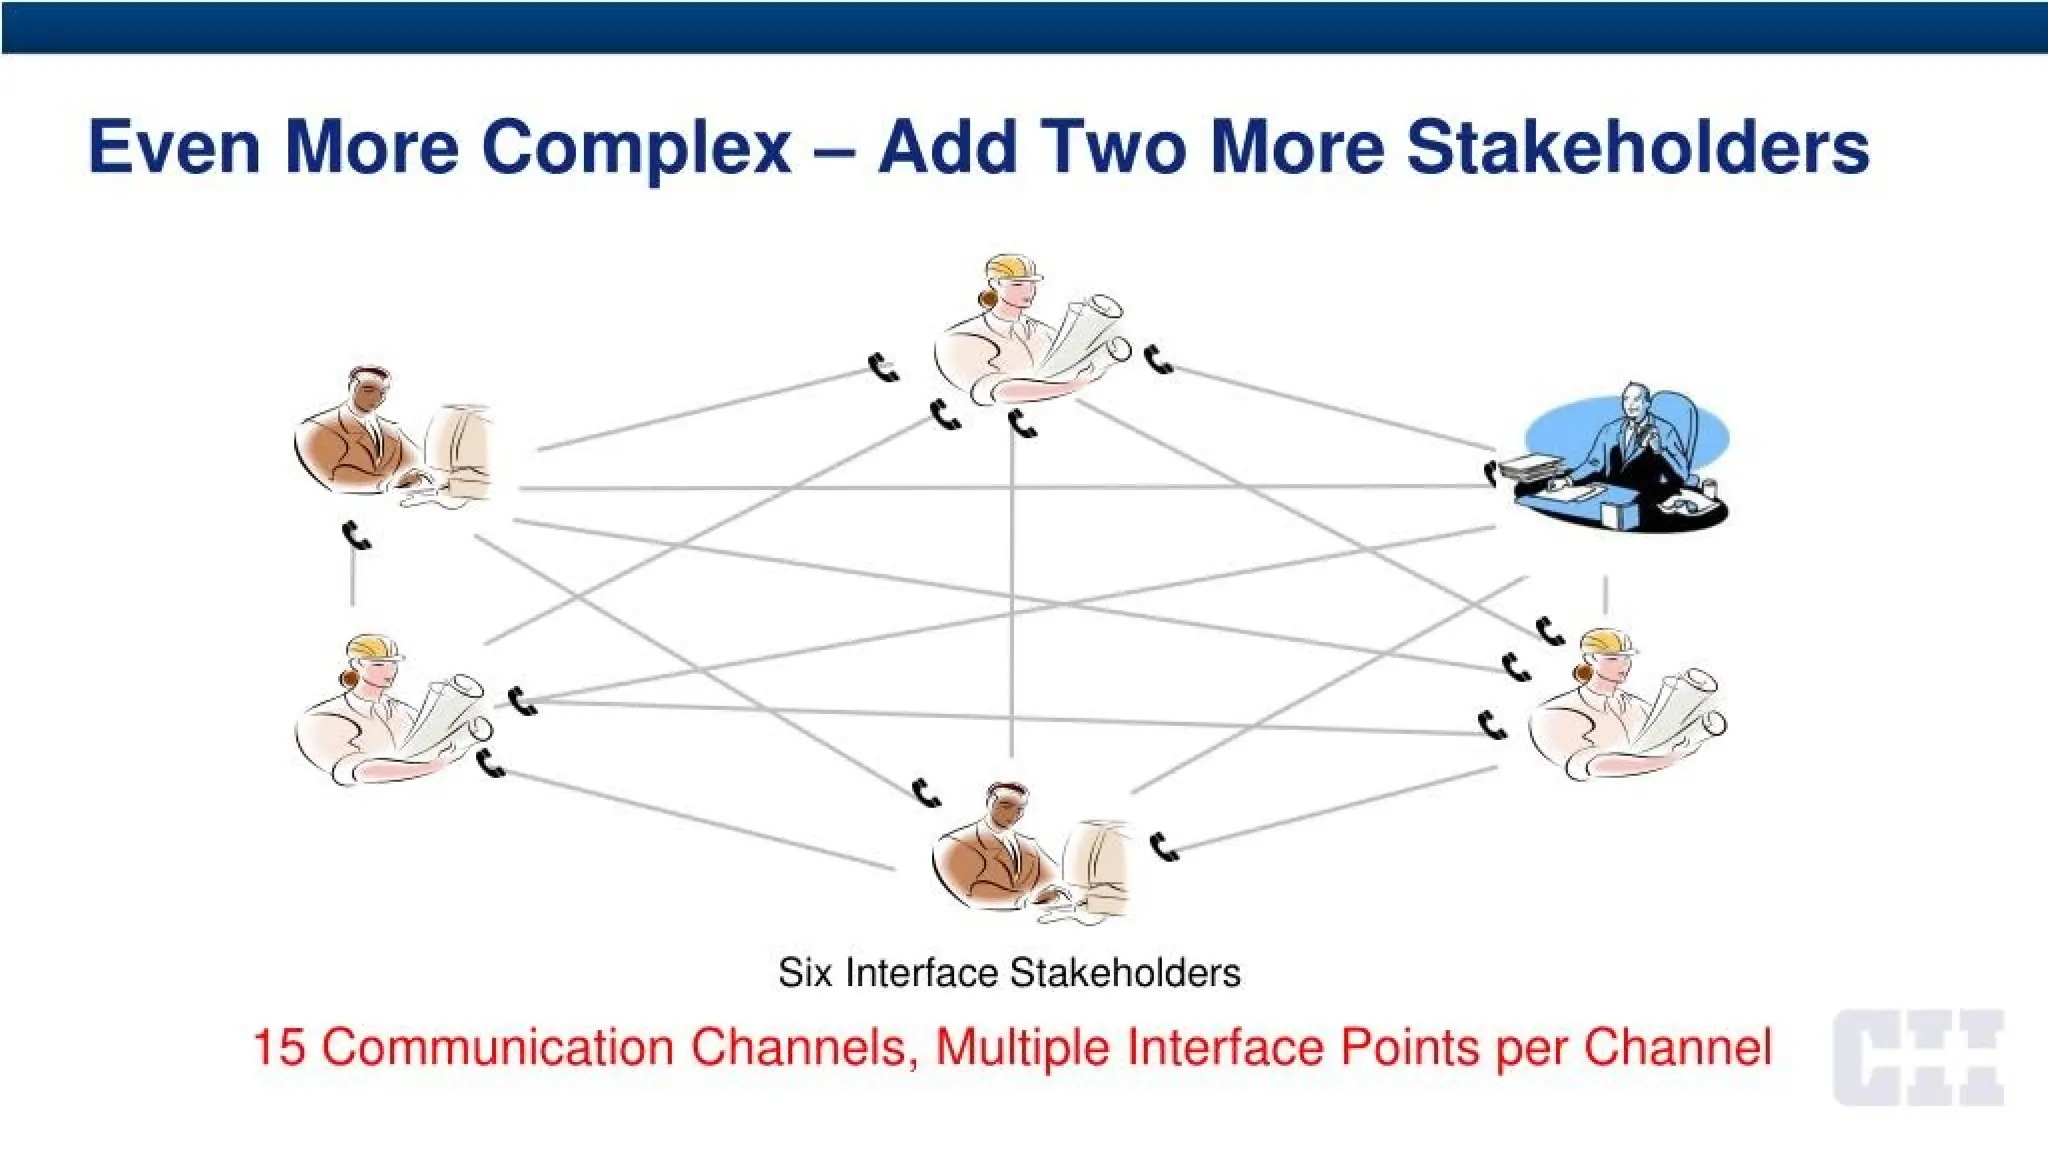
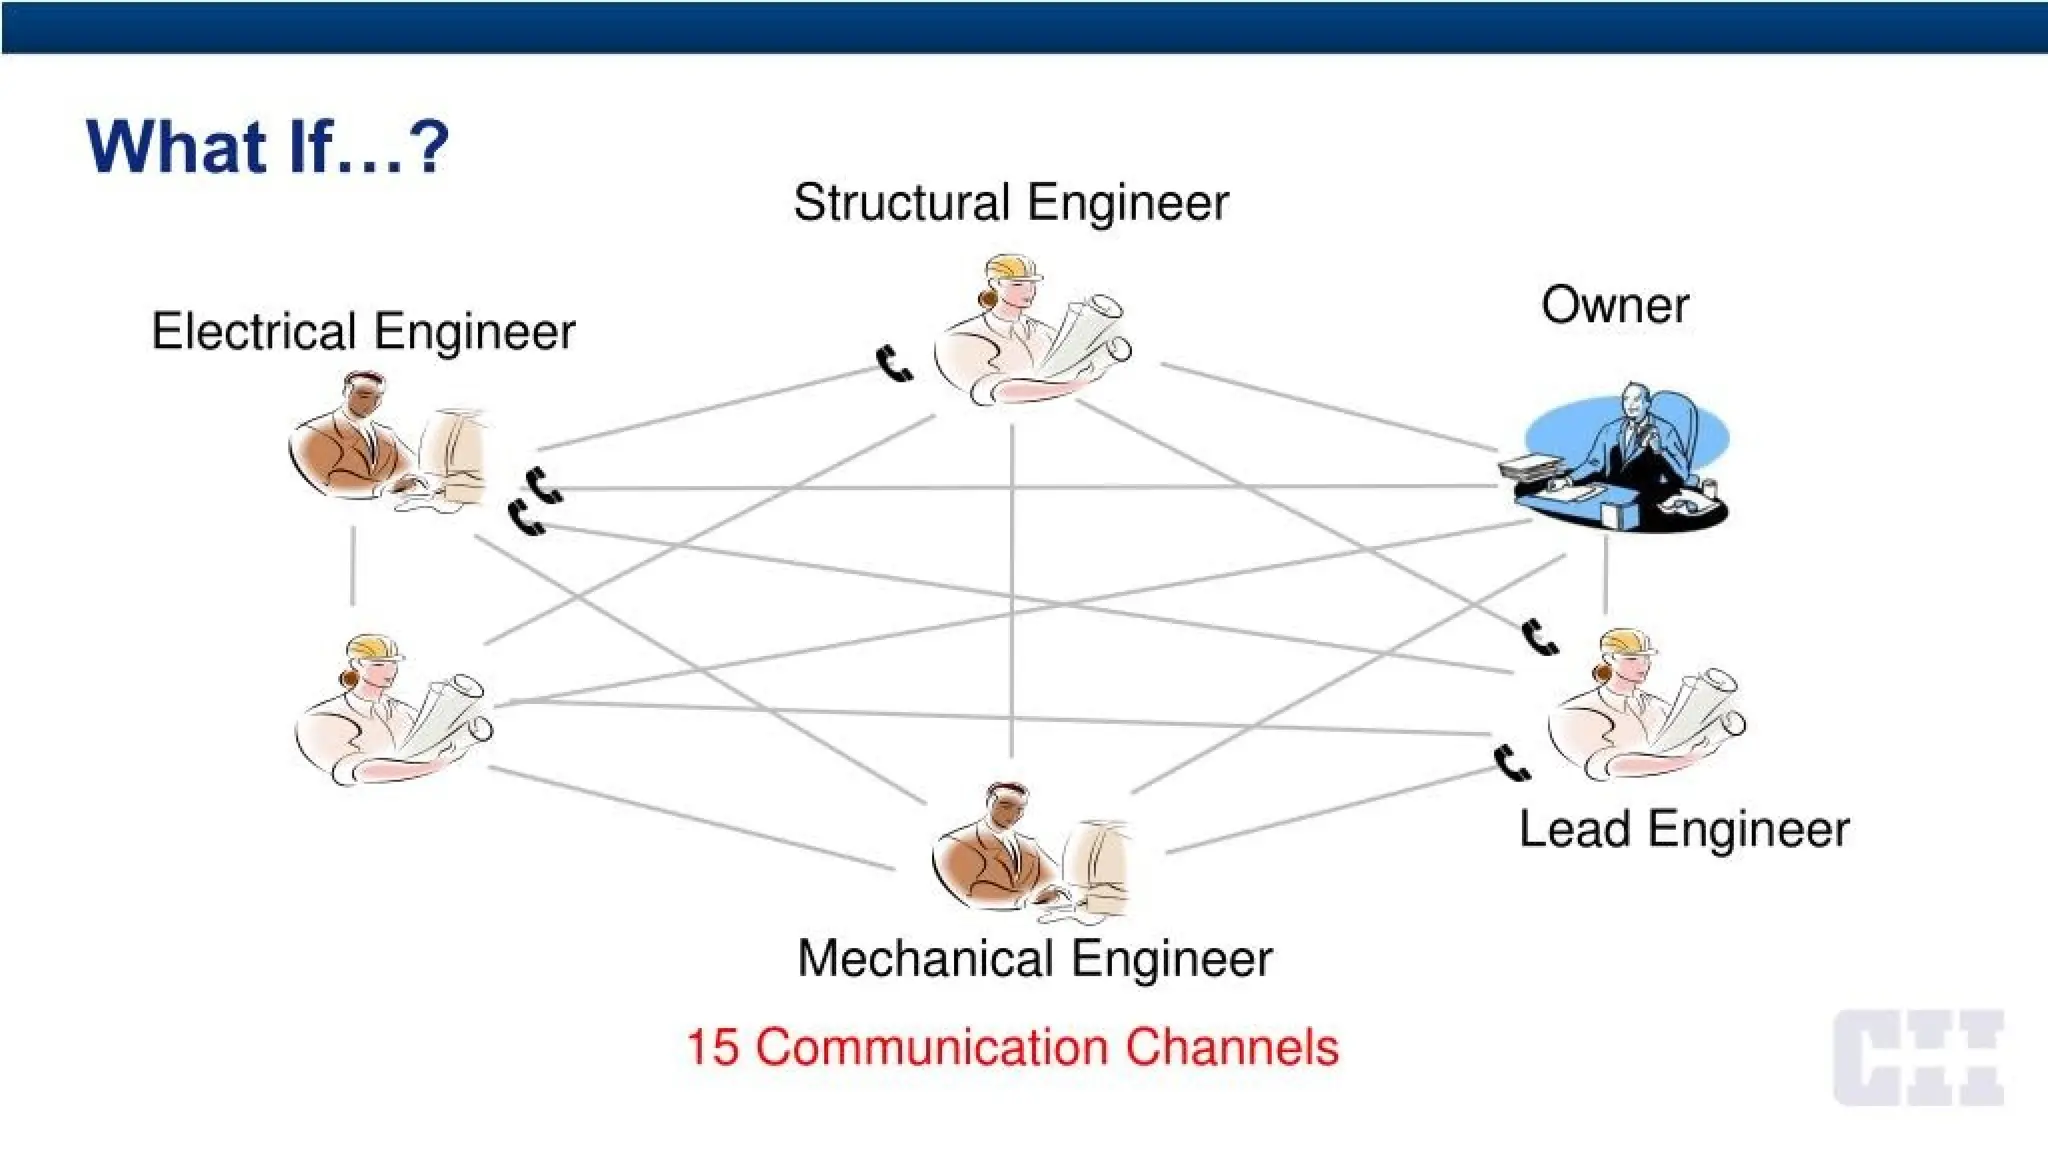
Even More Complex- Add Two More Stakeholders
Six Interface Stakeholders
15 Communication Channels, Multiple Interface Points per Channel
What complexity factor
mostwarrants FORMAL
IM practices?
A. Multiple geographic locations
B. New or advanced technologies
C. Multiple owners, contractors,
and/or sub-contractors
D. New geographic location
E. Fast track schedule
o%
0% o% o%
A, B, D.
28.
Which of theseis the best
means to communicate
critical interface information
with another stakeholder?
A. Fax
B. Phone call
C. Meeting where both took notes
D. Email exchange
o% o% o% o% o%
A. B. C. D. E.
E. Written agreement in standard form
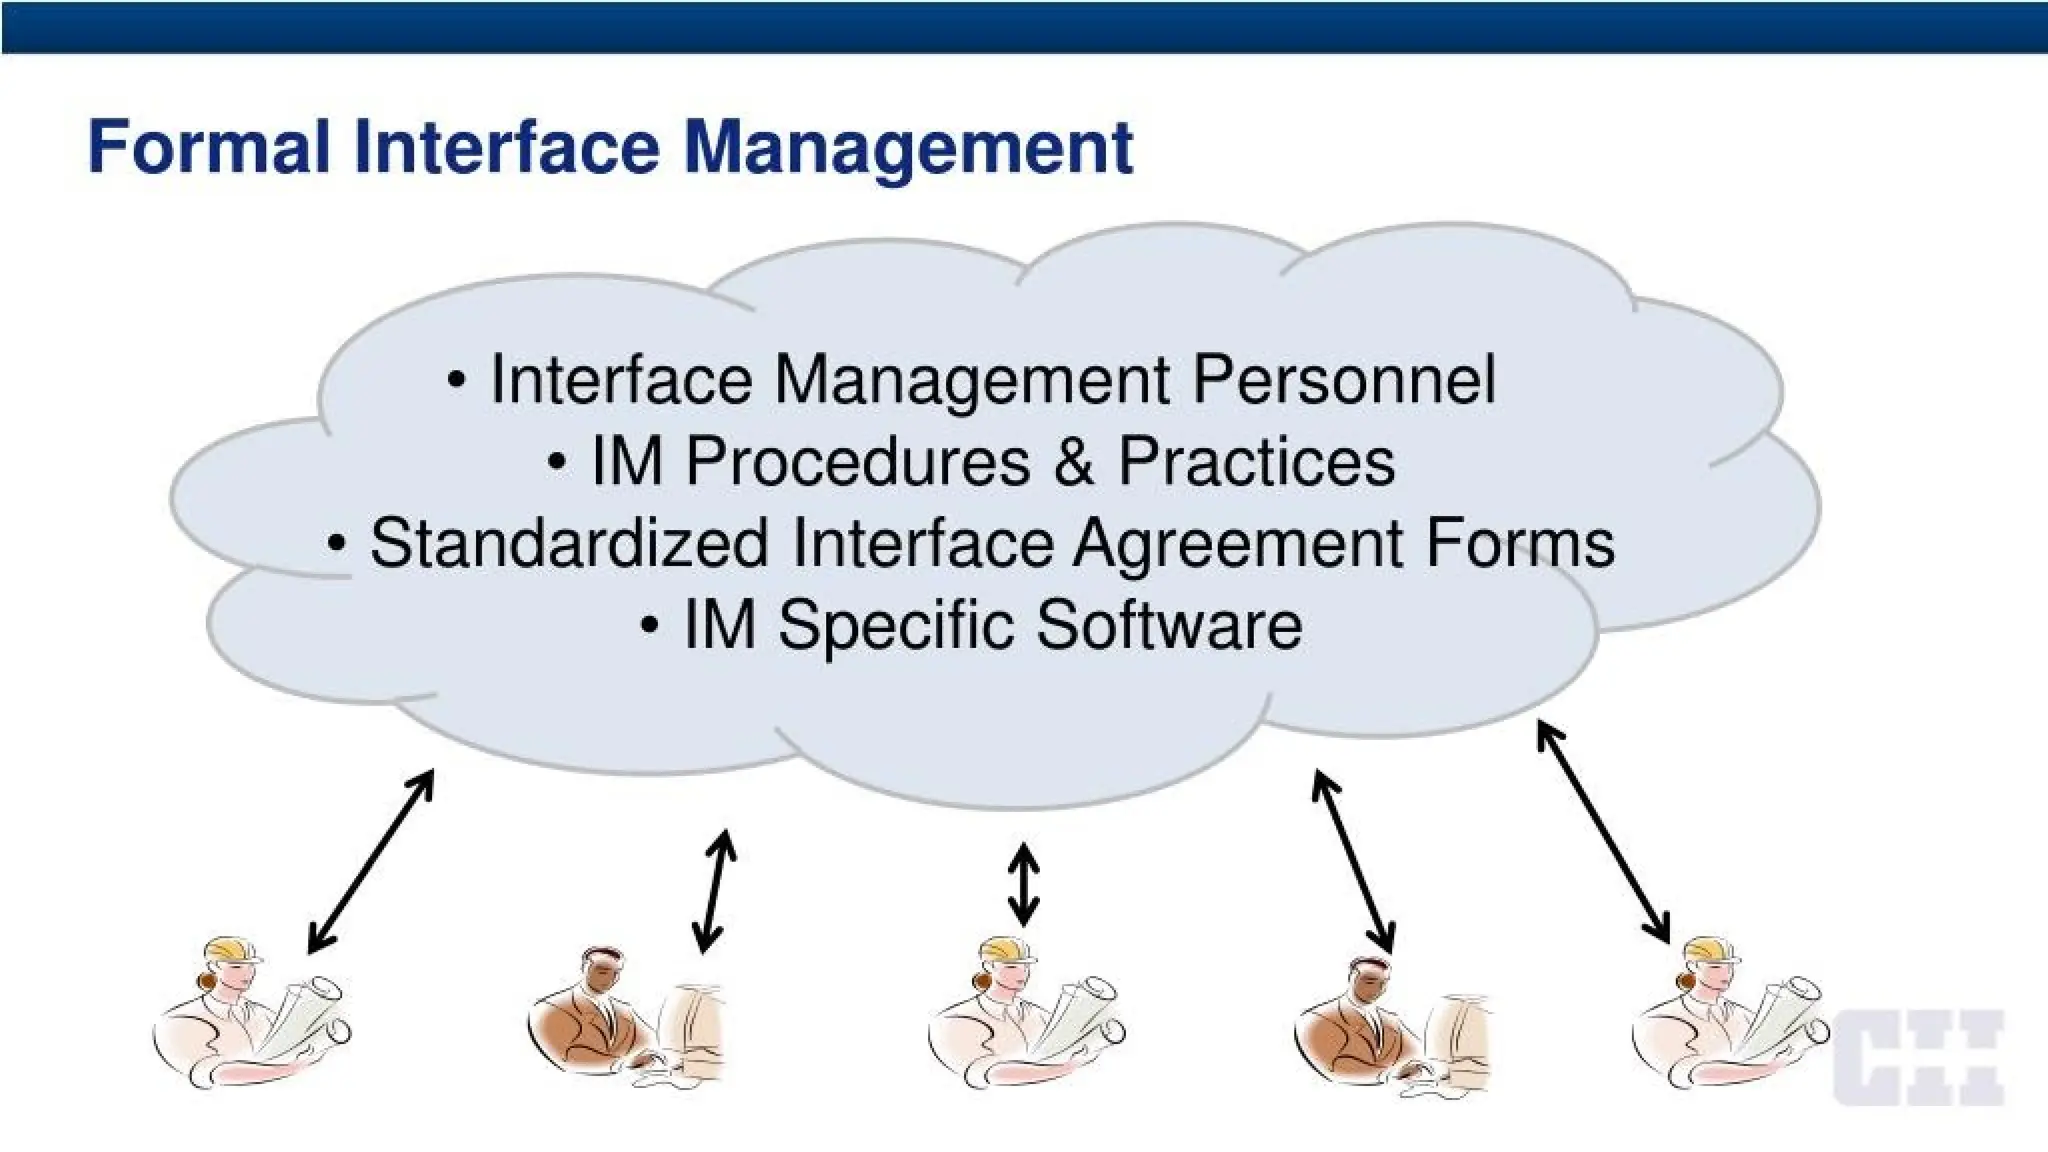
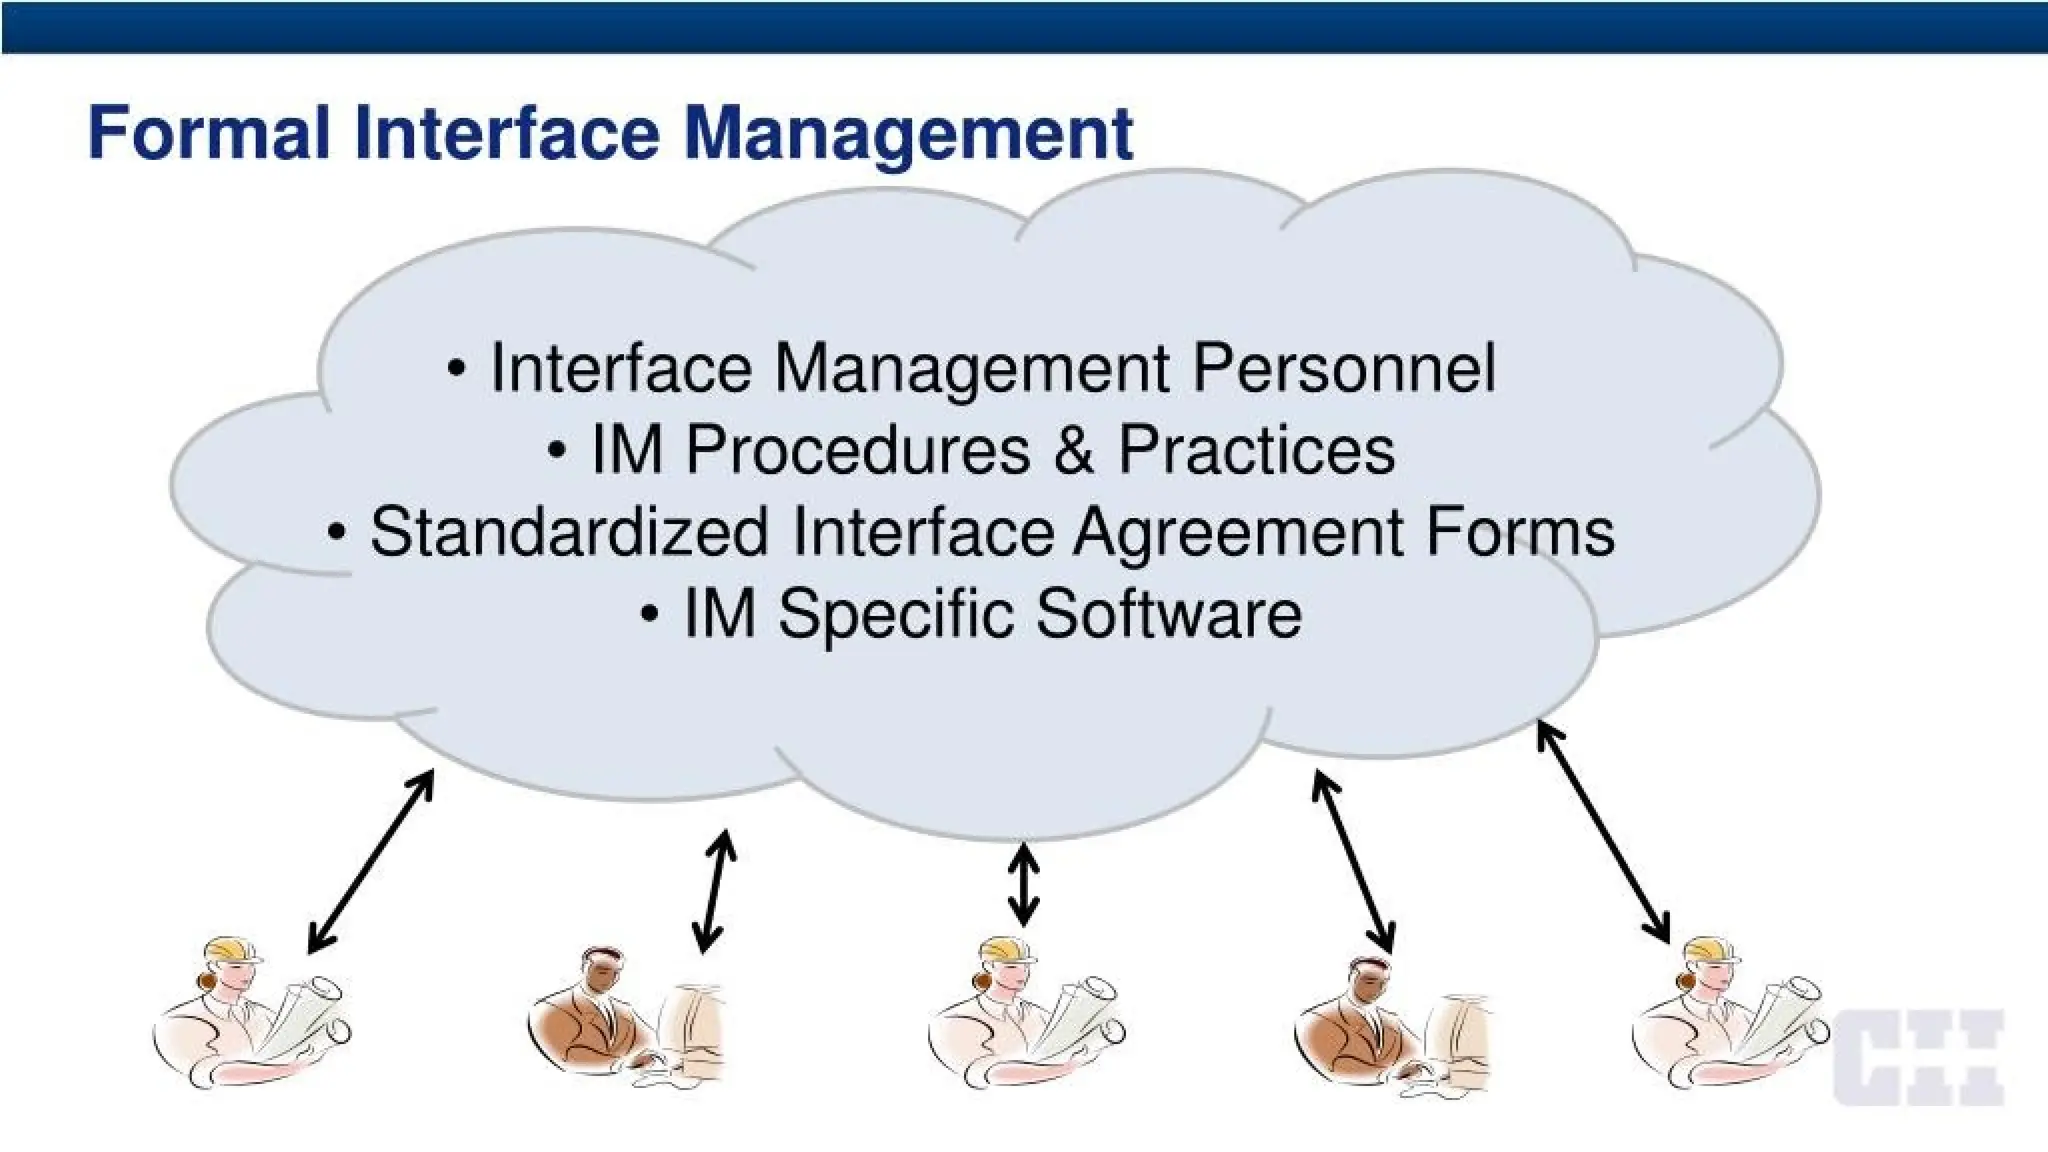
Formal Interface Management
•Interface Management Personnel
• IM Procedures & Practices
• Standardized Interface Agreement Forms
• IM Specific Software
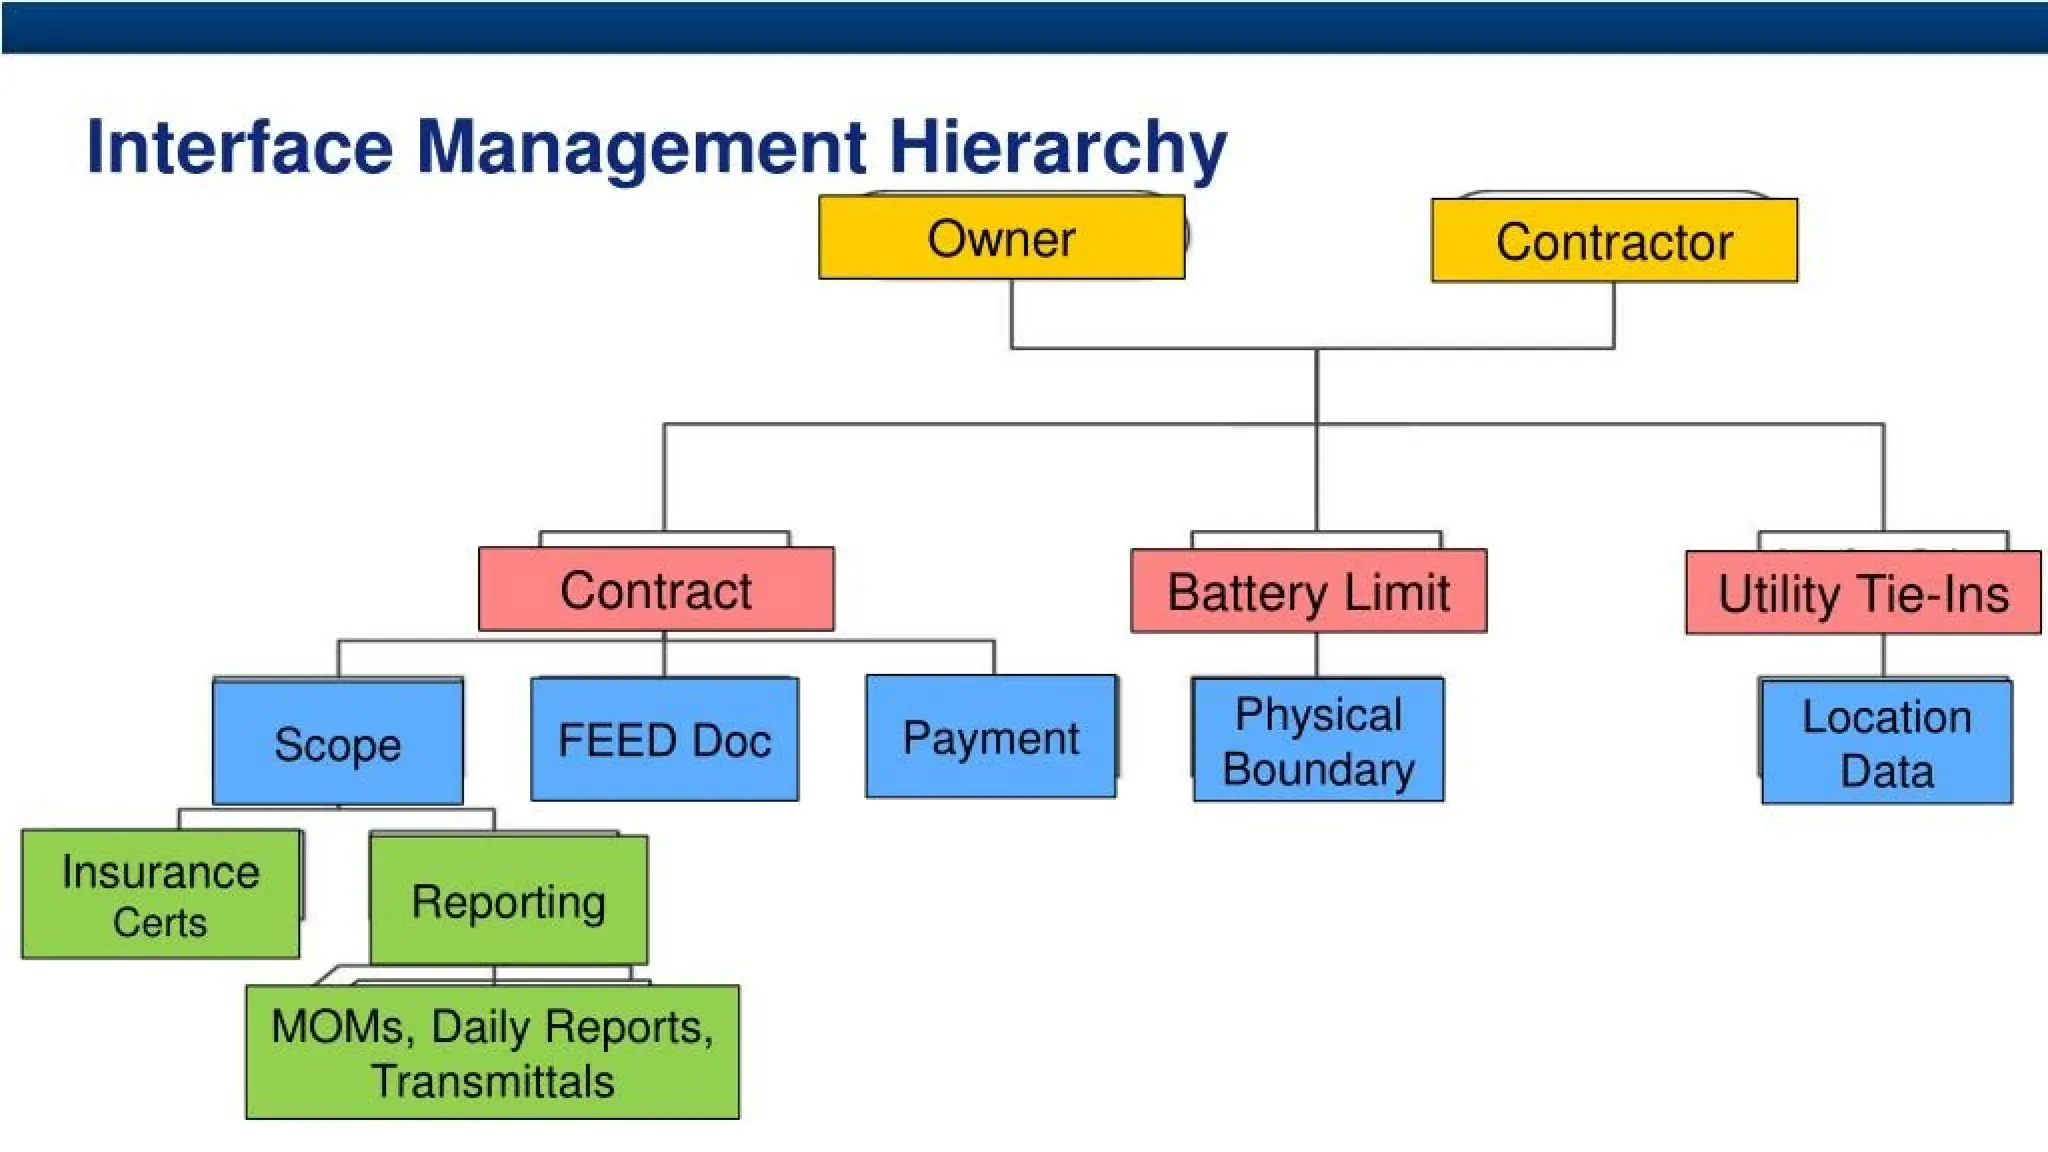
Research Methodology
Literature
Review
W Focus
■JGroup
Questionnaire Pi Pilot Pi Structured Pi Data Pi Tools &
Development M Survey M Interview M Analysis M Guide
• Literature Review
- Previous CH reports, Interface Management in construction & other disciplines.
• Structured Interview (facilitated with Survey Questionnaire)
- Use of face-to-face or phone interviews
- Total 46 Projects (representing over $150 Billion in CAPEX)
33.
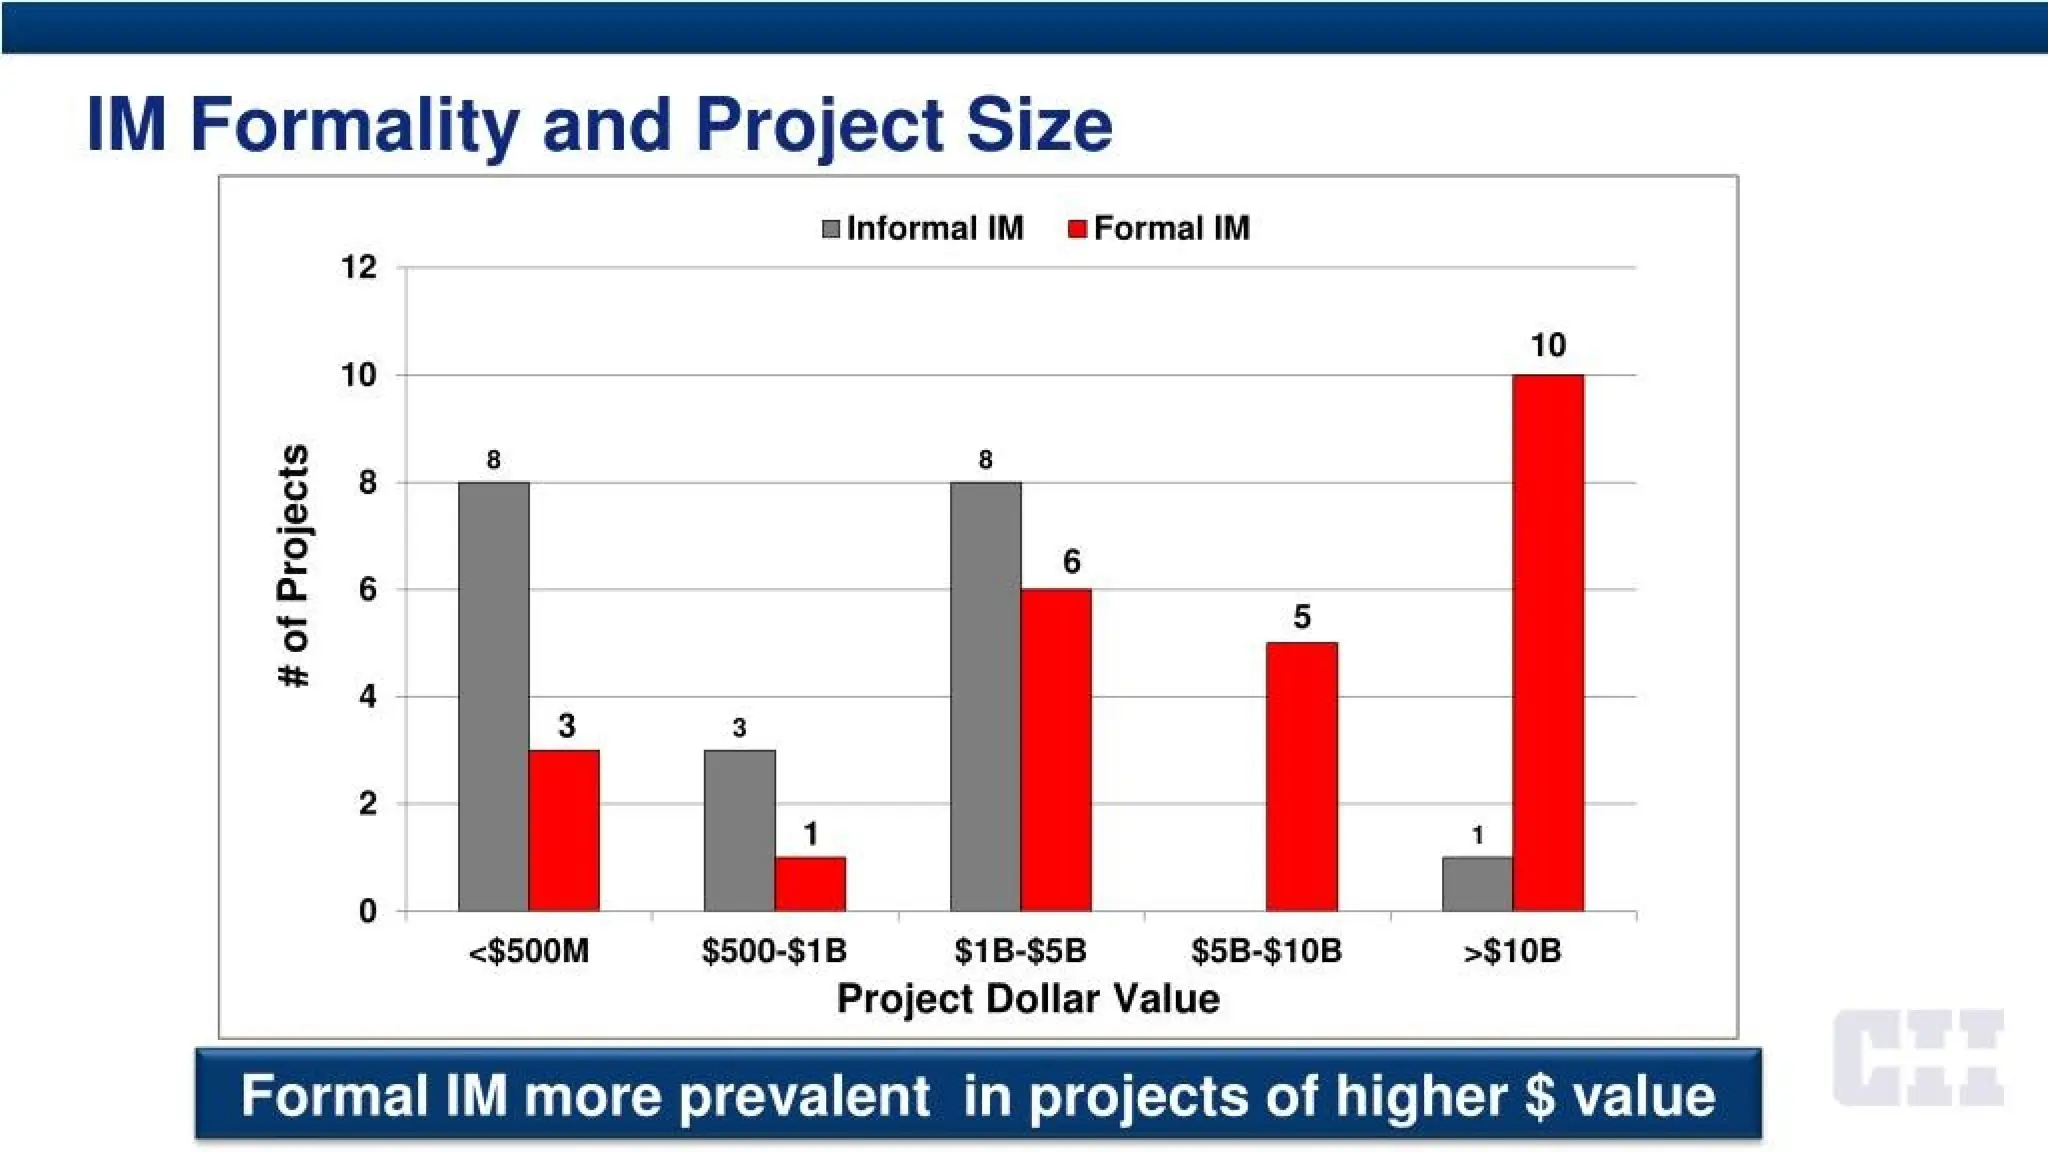
IM Formality andProject Size
□Informal IM ■ Formal IM
#
of
Projects
—L
—L
o
r
o
co
o
N>
10
<$500M $500-$1B $5B-$10B >$10B
S1B-$5B
Project Dollar Value
Formal IM more prevalent in projects of higher $ value
34.
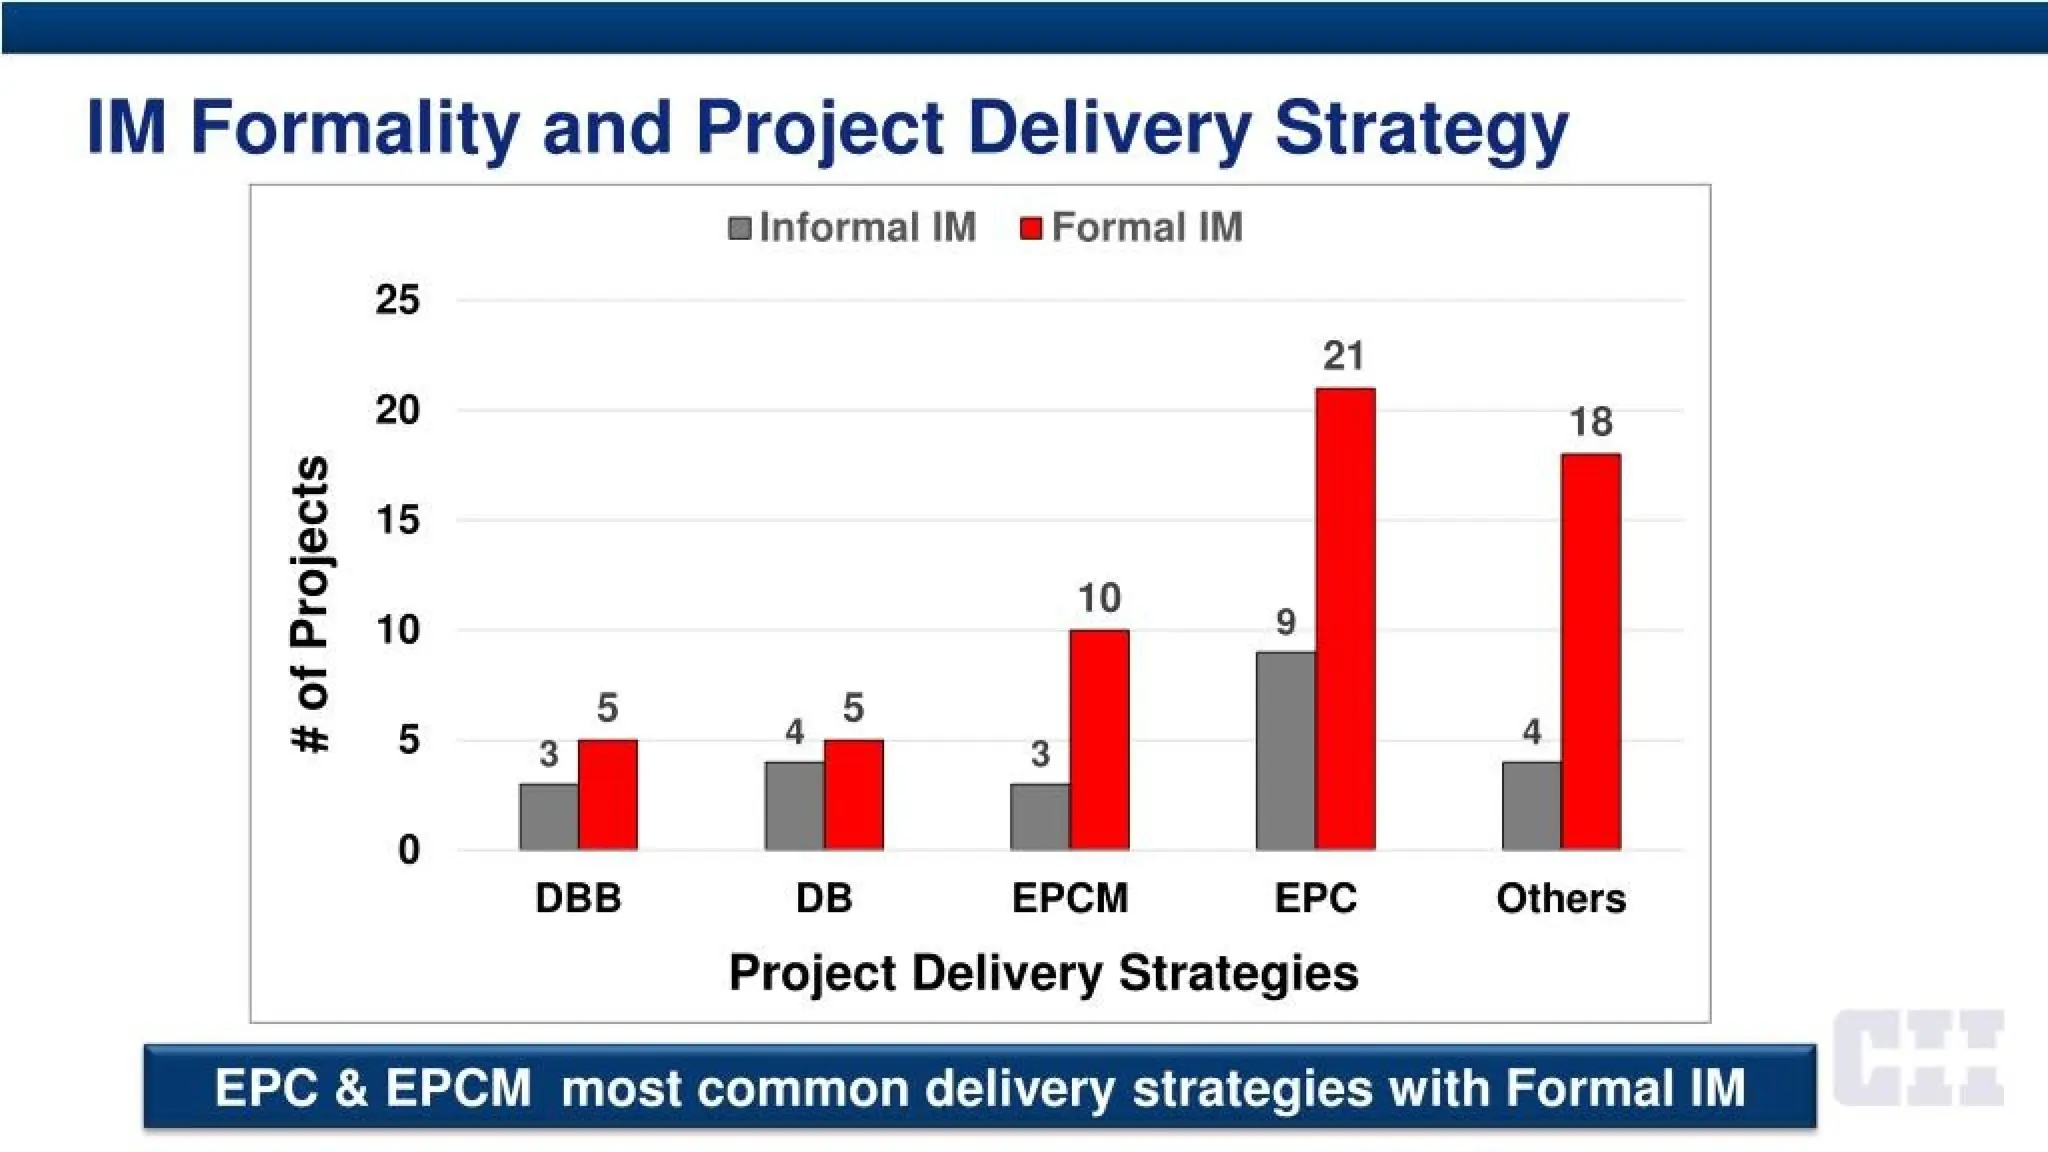
IM Formality andProject Delivery Strategy
□ Informal IM ■ Formal IM
#
of
Projects
-*■
t
o
t
o
O
O1
O
U1
O
U1
18
10
DBB DB EPCM EPC Others
Project Delivery Strategies
EPC & EPCM most common delivery strategies with Formal IM
35.
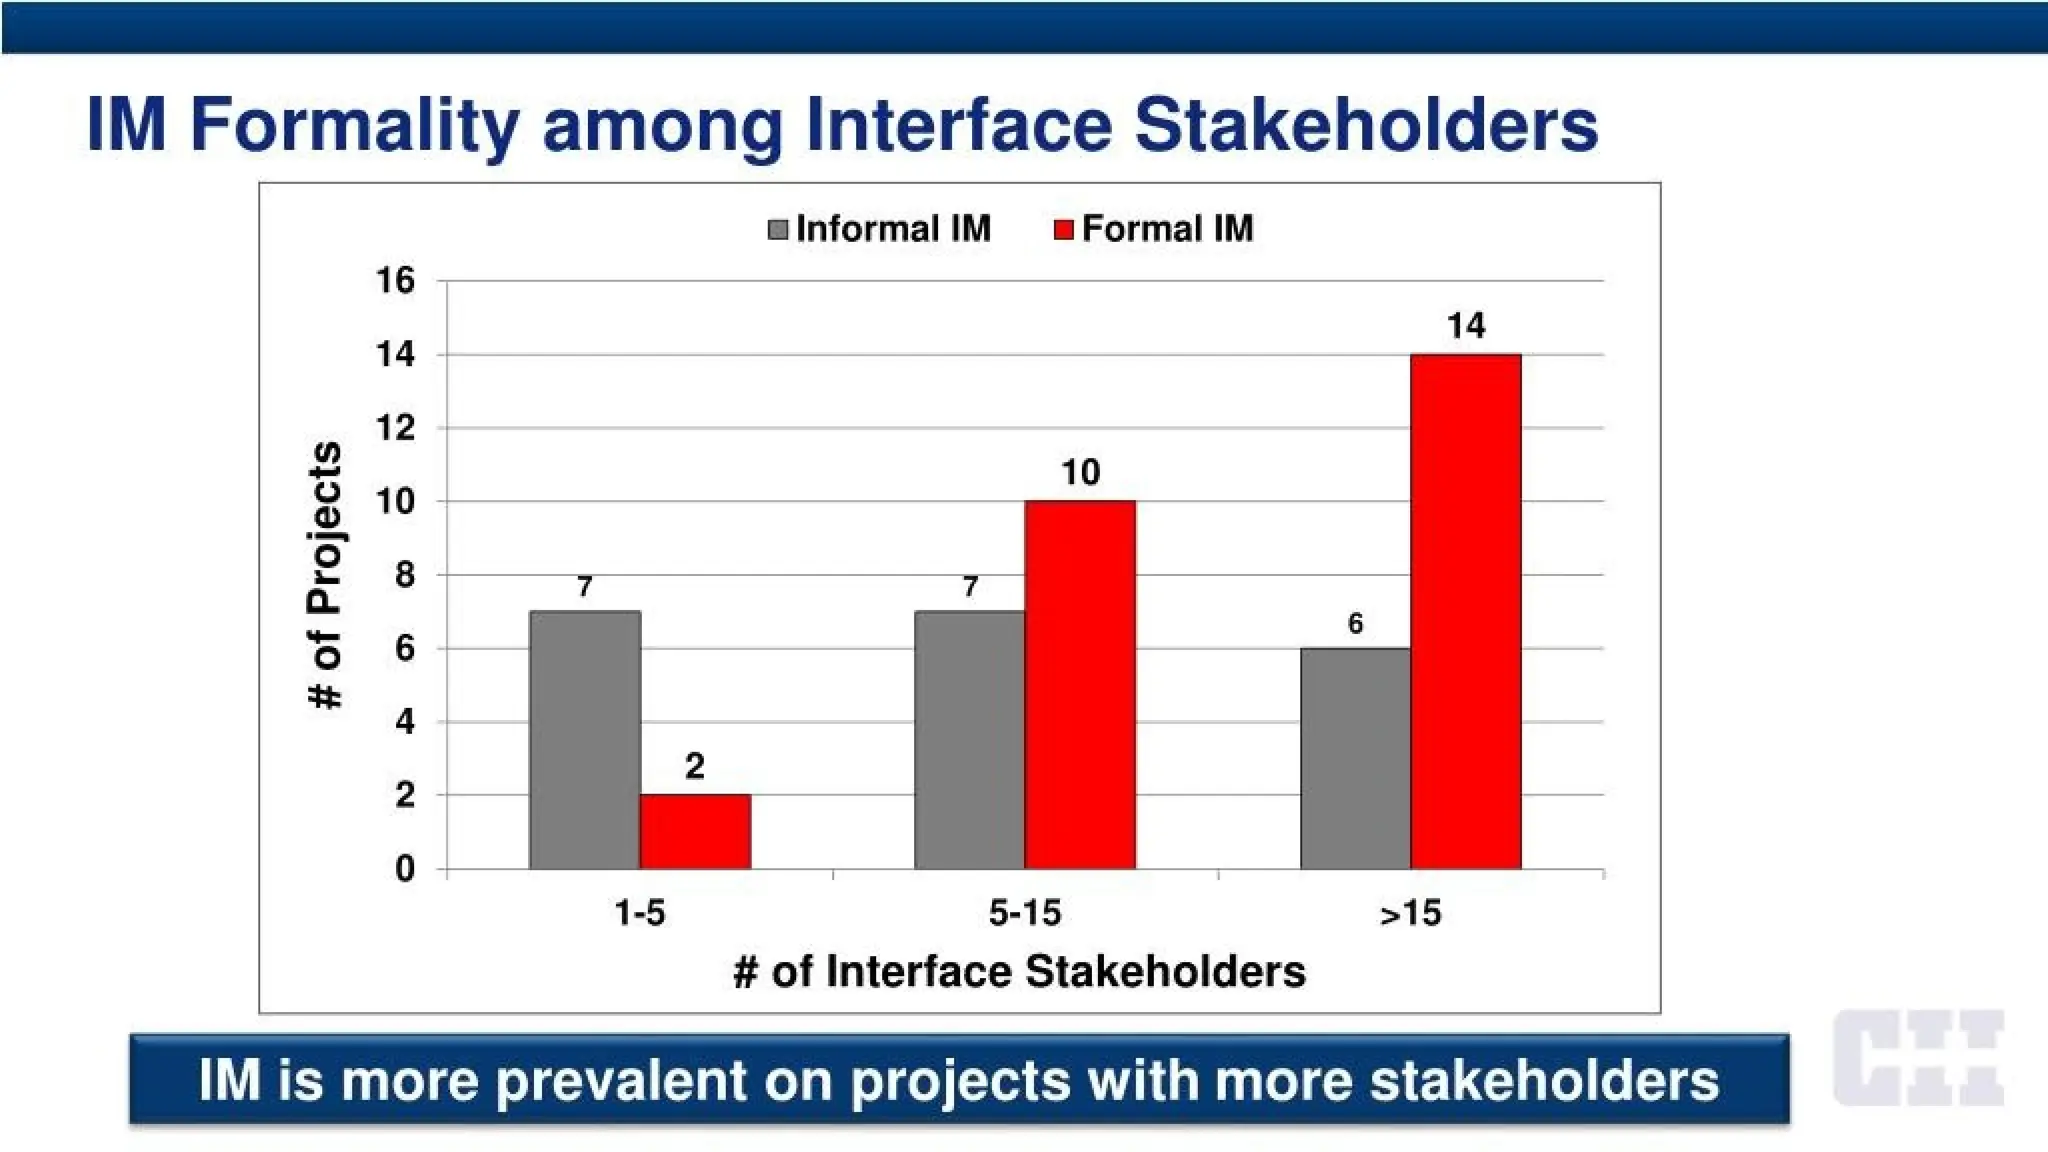
IM Formality amongInterface Stakeholders
□ Informal IM ■Formal IM
14
10
1-5 5-15 >15
# of Interface Stakeholders
IM is more prevalent on projects with more stakeholders
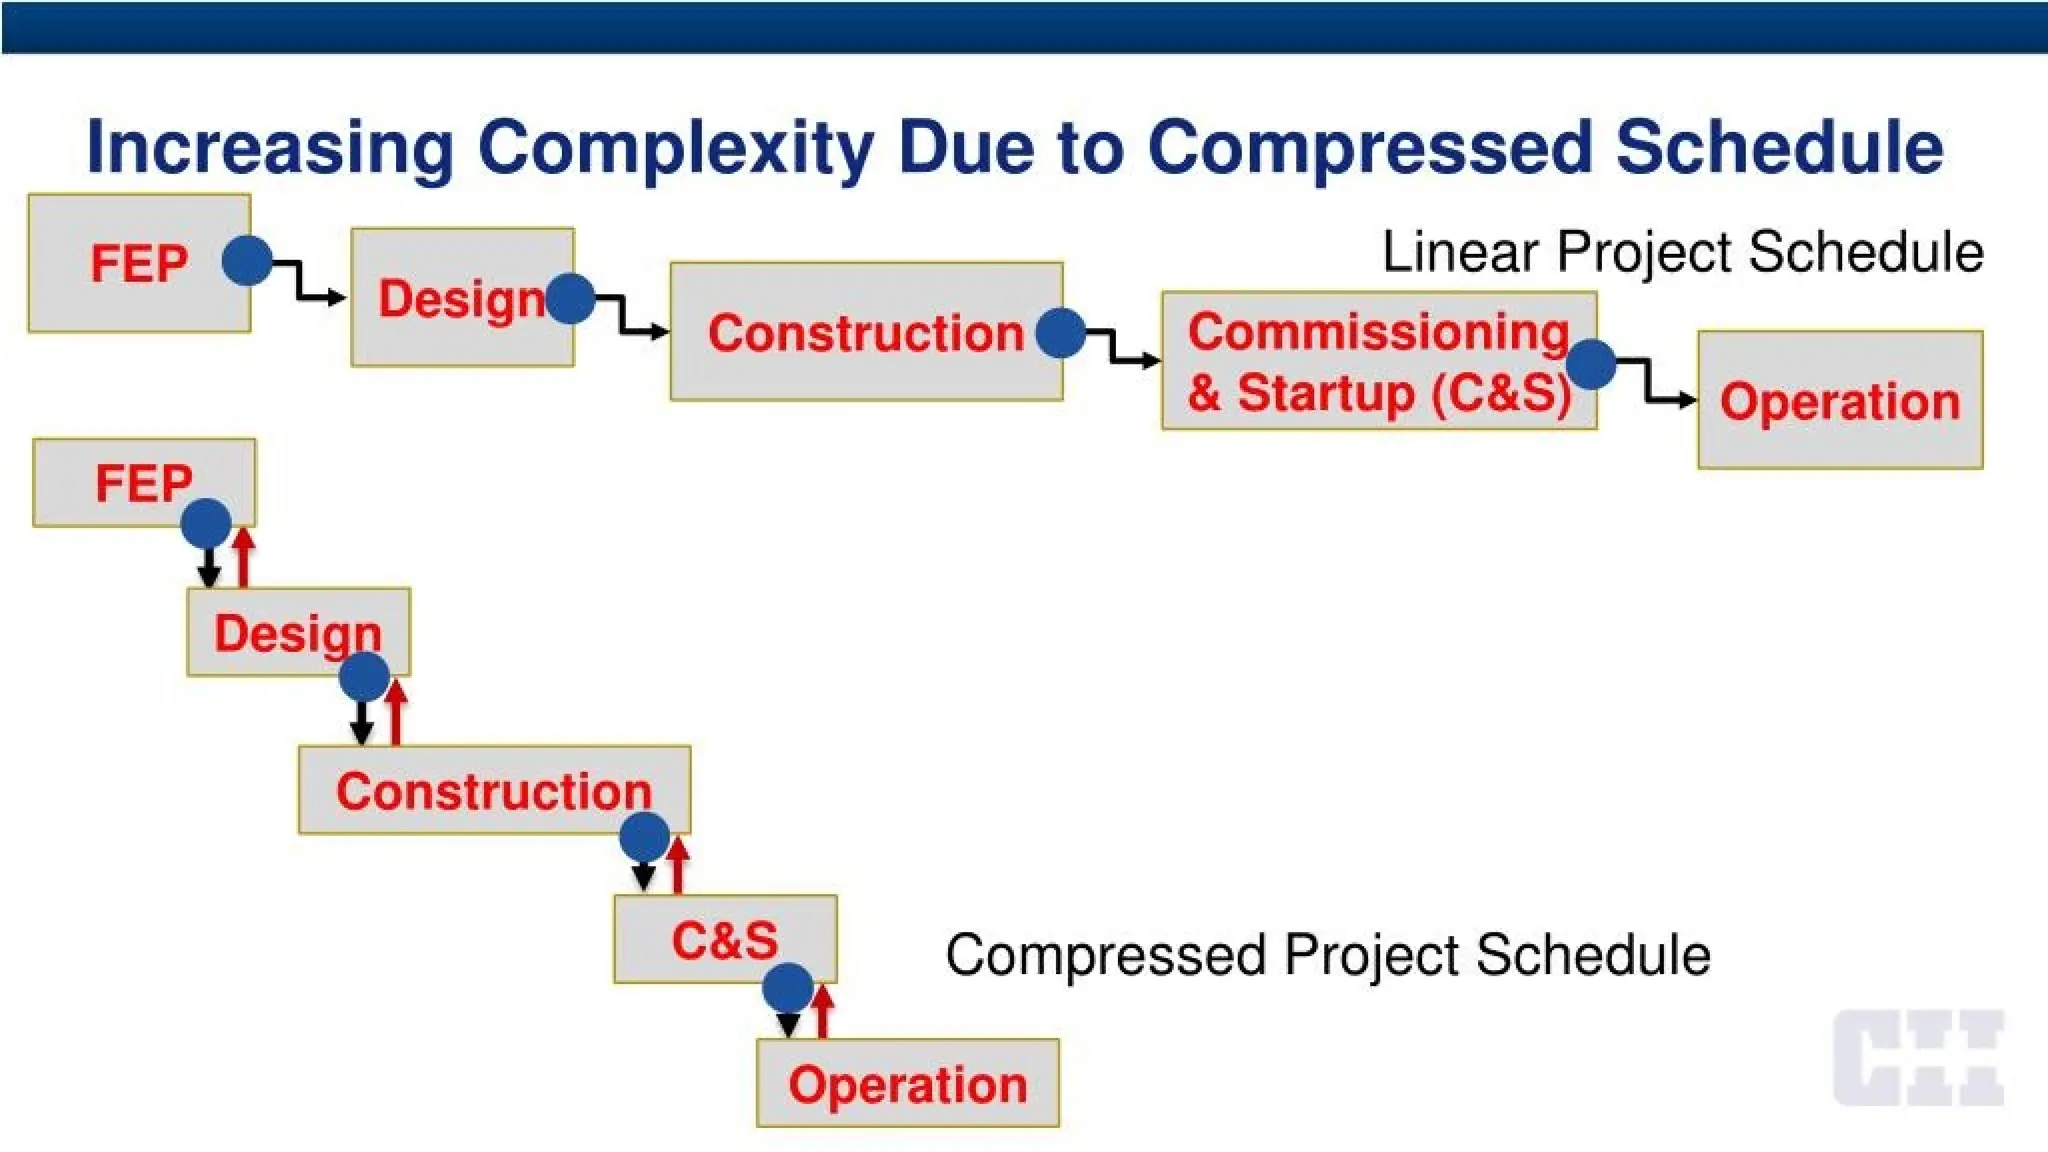
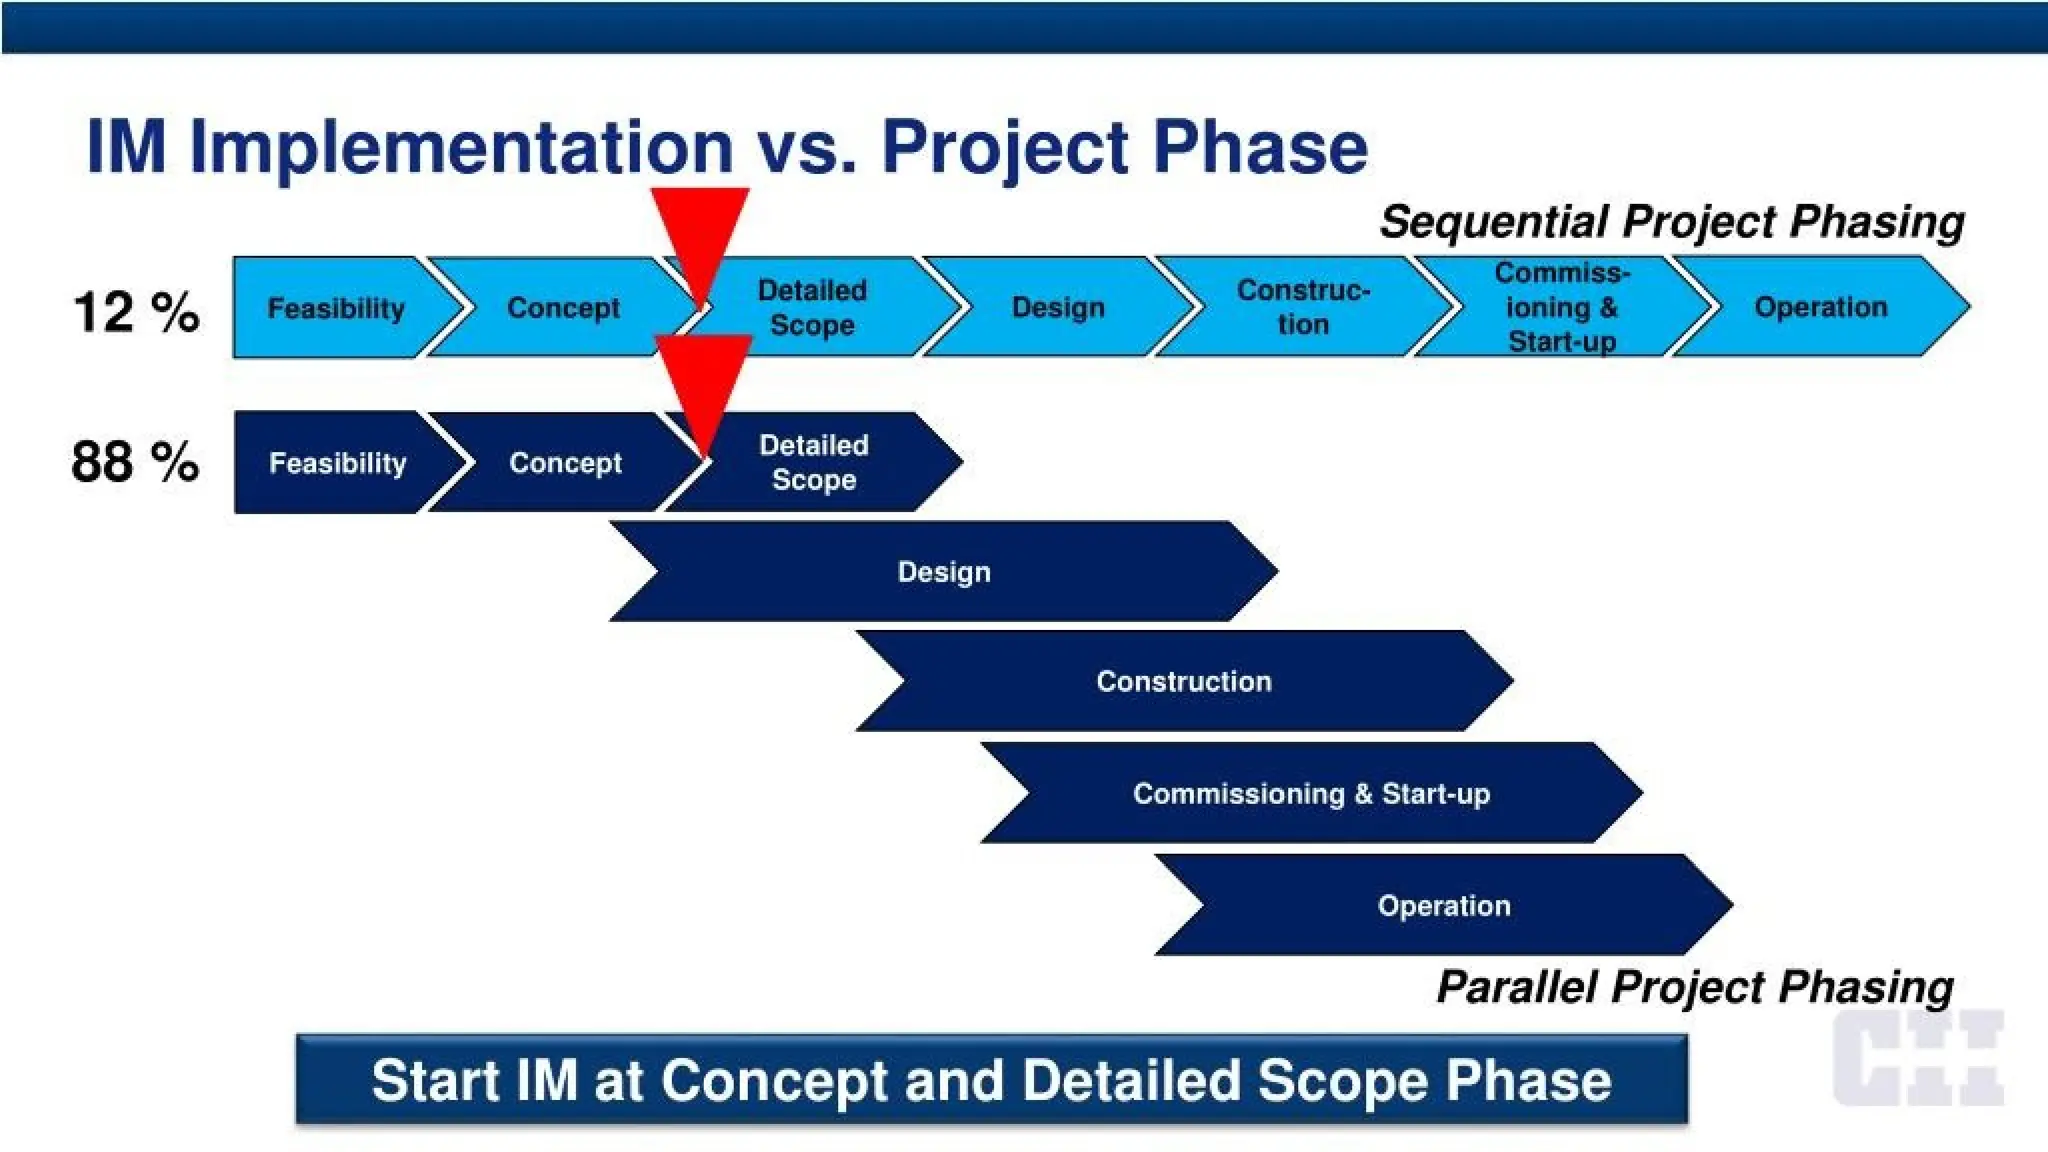
IM Implementation vs.Project Phase
Detailed
Scope
Sequential Project Phasing
Commiss-
ioning &
Start-up
Construc-
tion
12% Concept Design Operation
Feasibility
Feasibility
Detailed
Scope
88% Concept
Design
Construction
Commissioning & Start-up
Operation
Parallel Project Phasing
Start IM at Concept and Detailed Scope Phase
38.
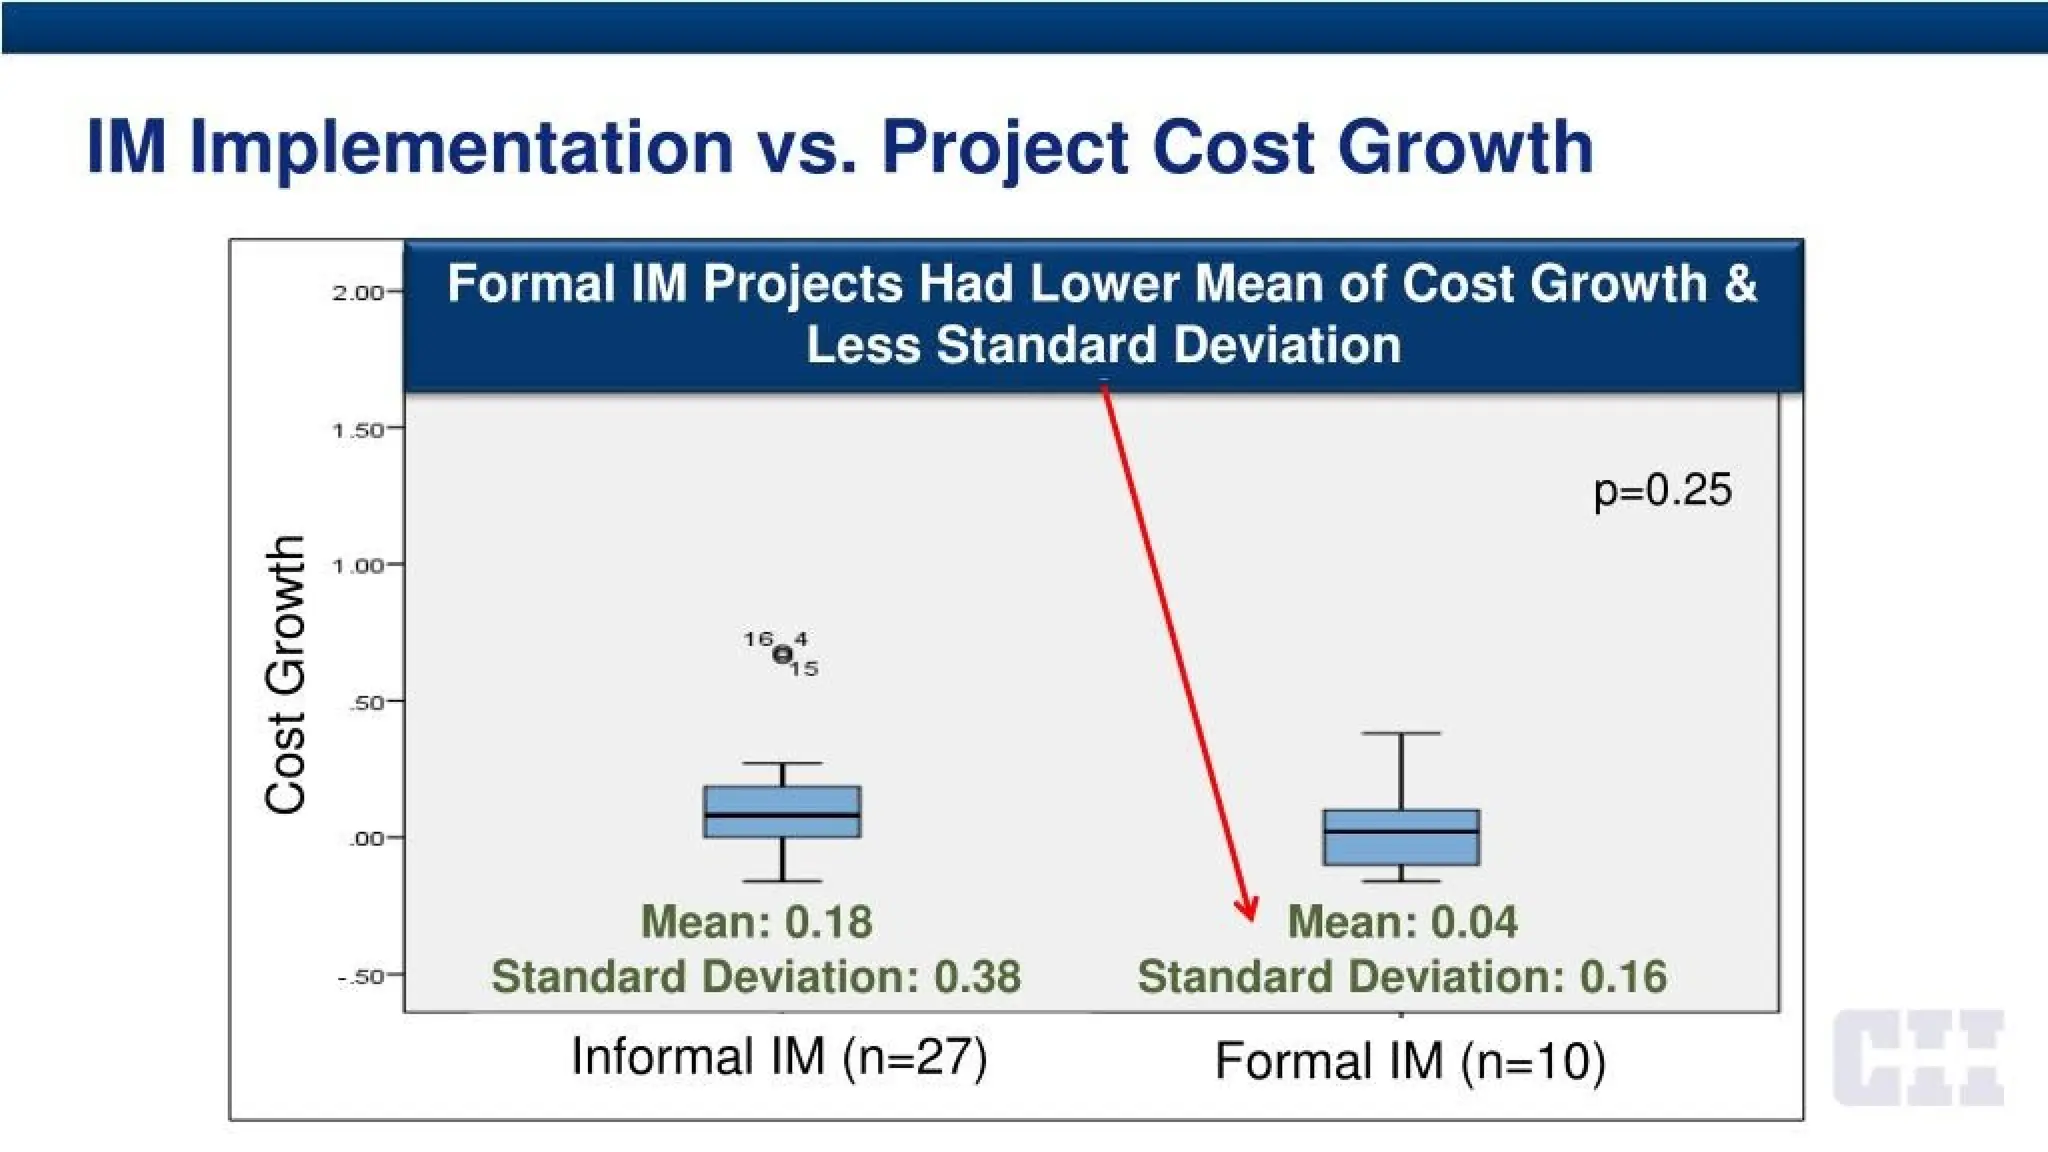
IM Implementation vs.Project Cost Growth
Formal IM Projects Had Lower Mean of Cost Growth &
Less Standard Deviation
2.00
Mean: 0.04
1 50
p=0.25
Cost
Growth
1 00
16 4
50
oo
Mean: 0.18
Standard Deviation: 0.38 Standard Deviation: 0.16
-.50
Informal IM (n=27) Formal IM <n=10)
Formal Interface Management
•Interface Management Personnel
• IM Procedures & Practices
• Standardized Interface Agreement Forms
• IM Specific Software
41.
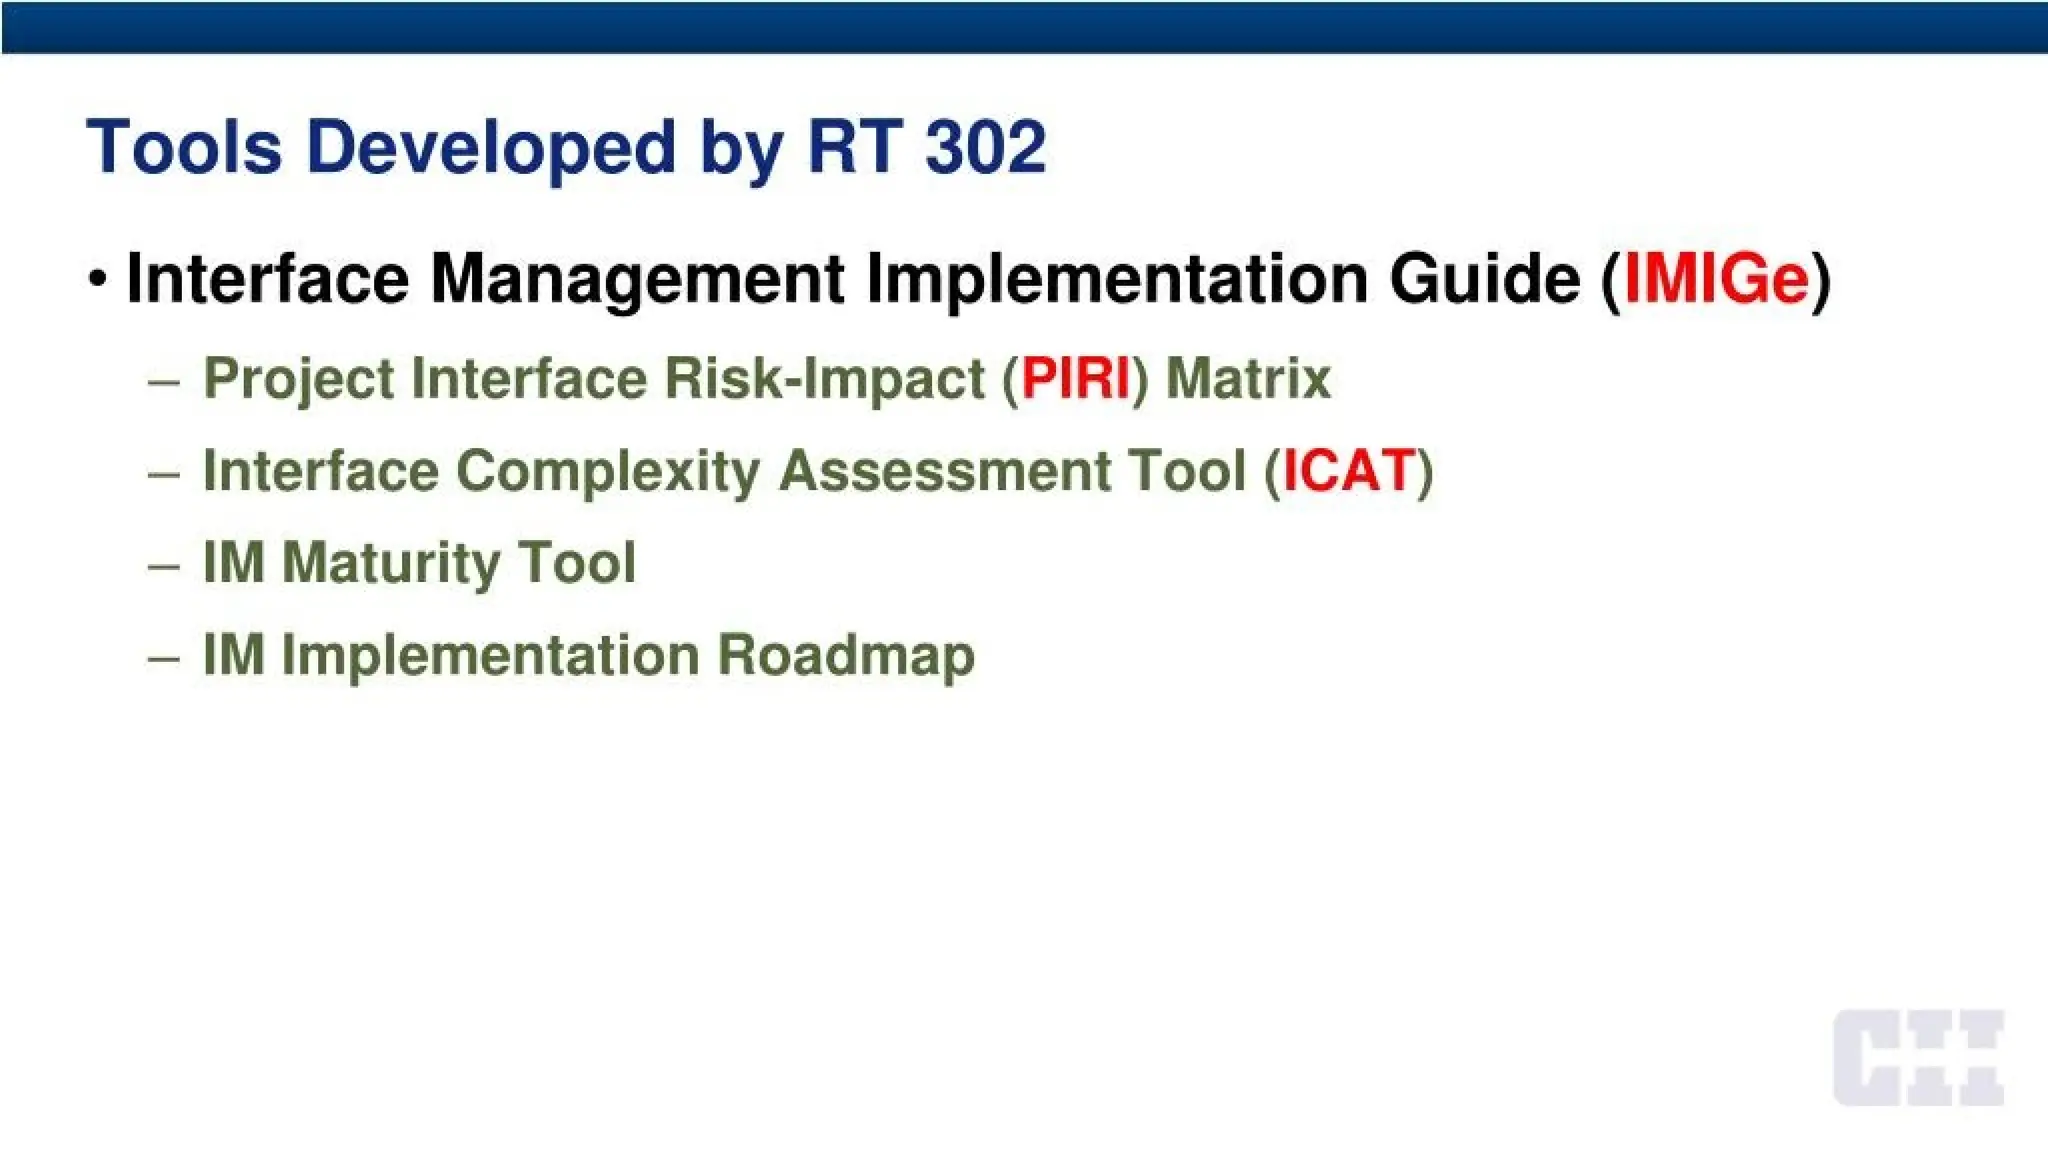
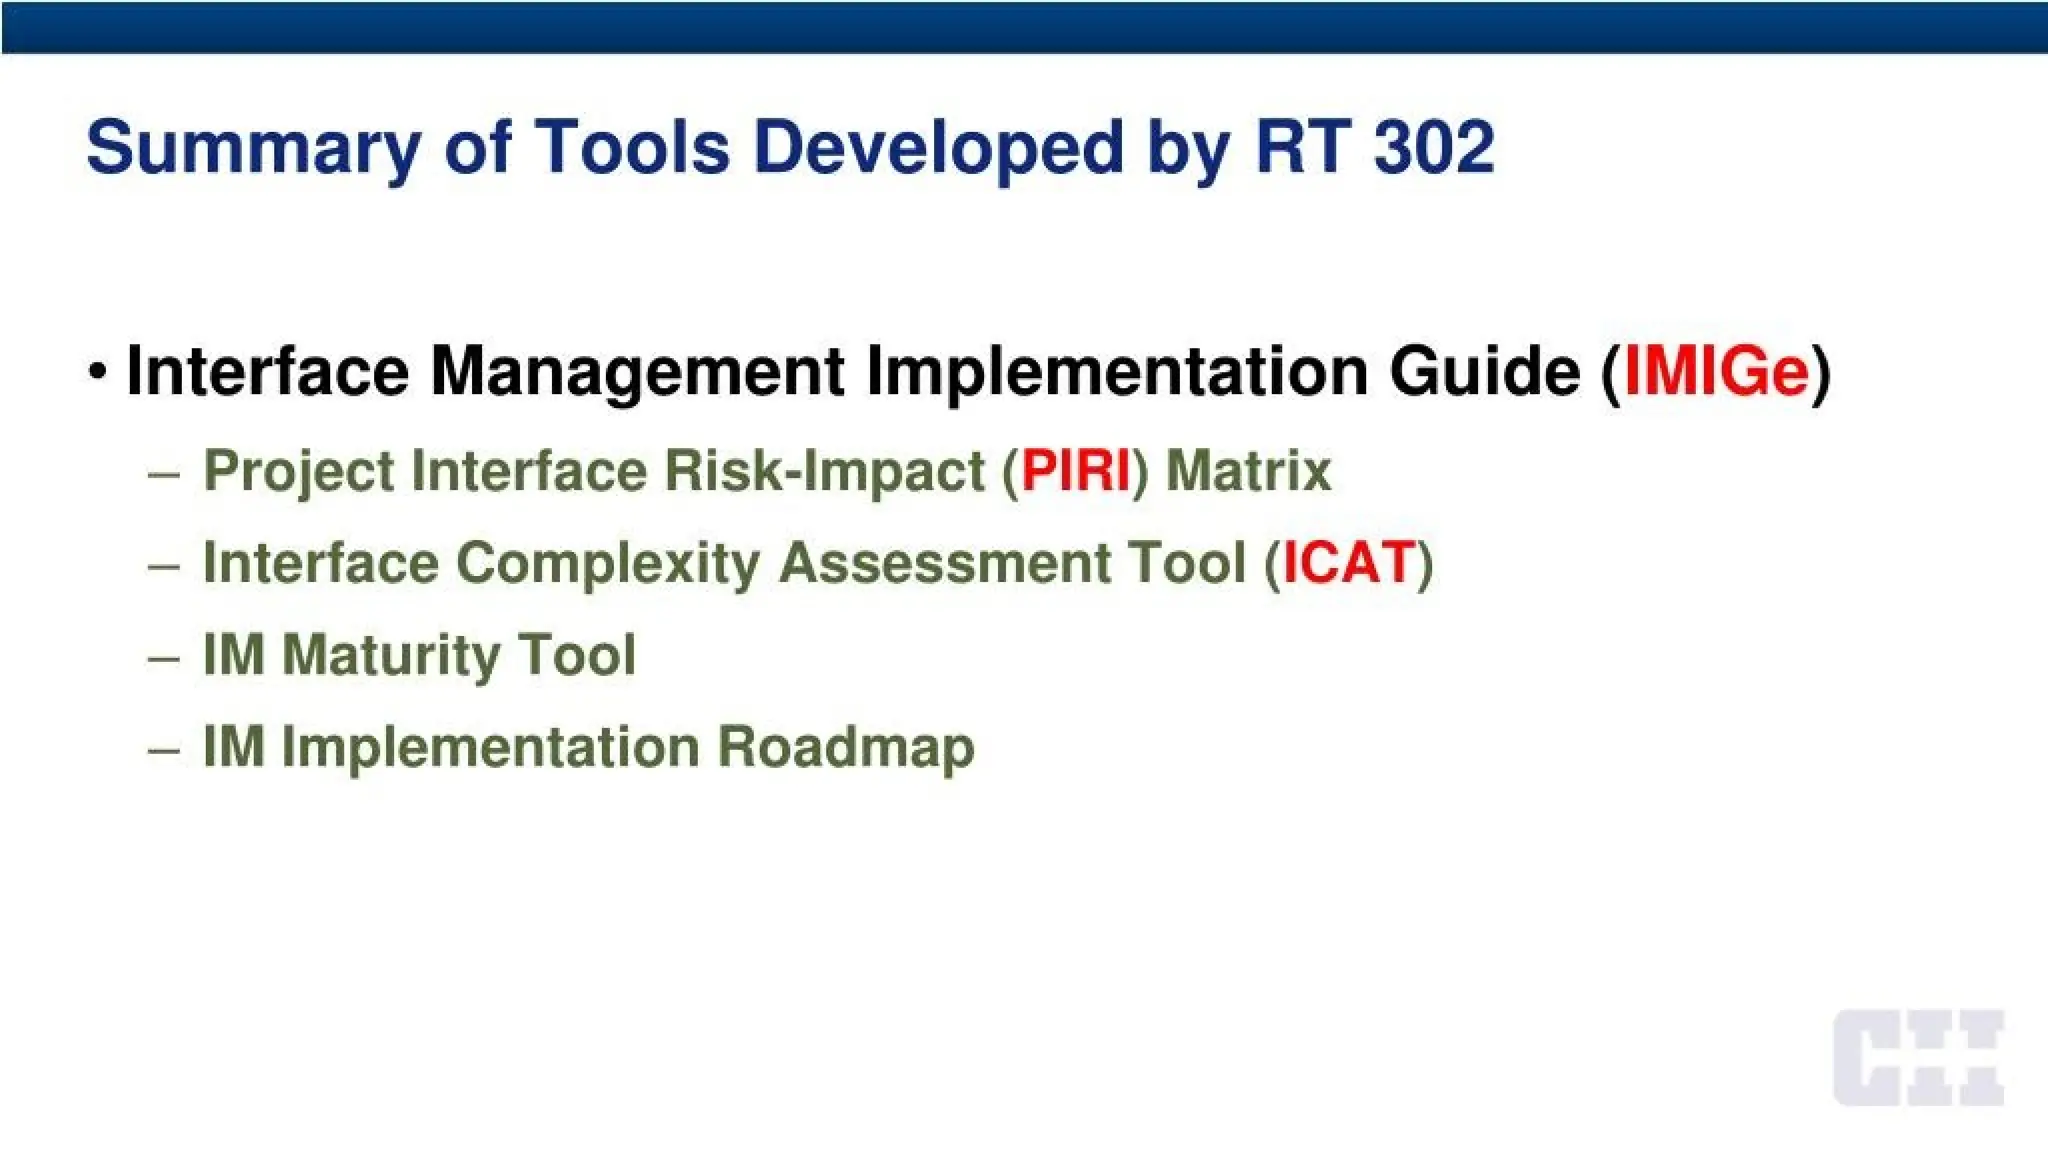
Tools Developed byRT 302
• Interface Management Implementation Guide (IMIGe)
- Project Interface Risk-Impact (PIRI) Matrix
- Interface Complexity Assessment Tool (ICAT)
- IM Maturity Tool
- IM Implementation Roadmap
42.
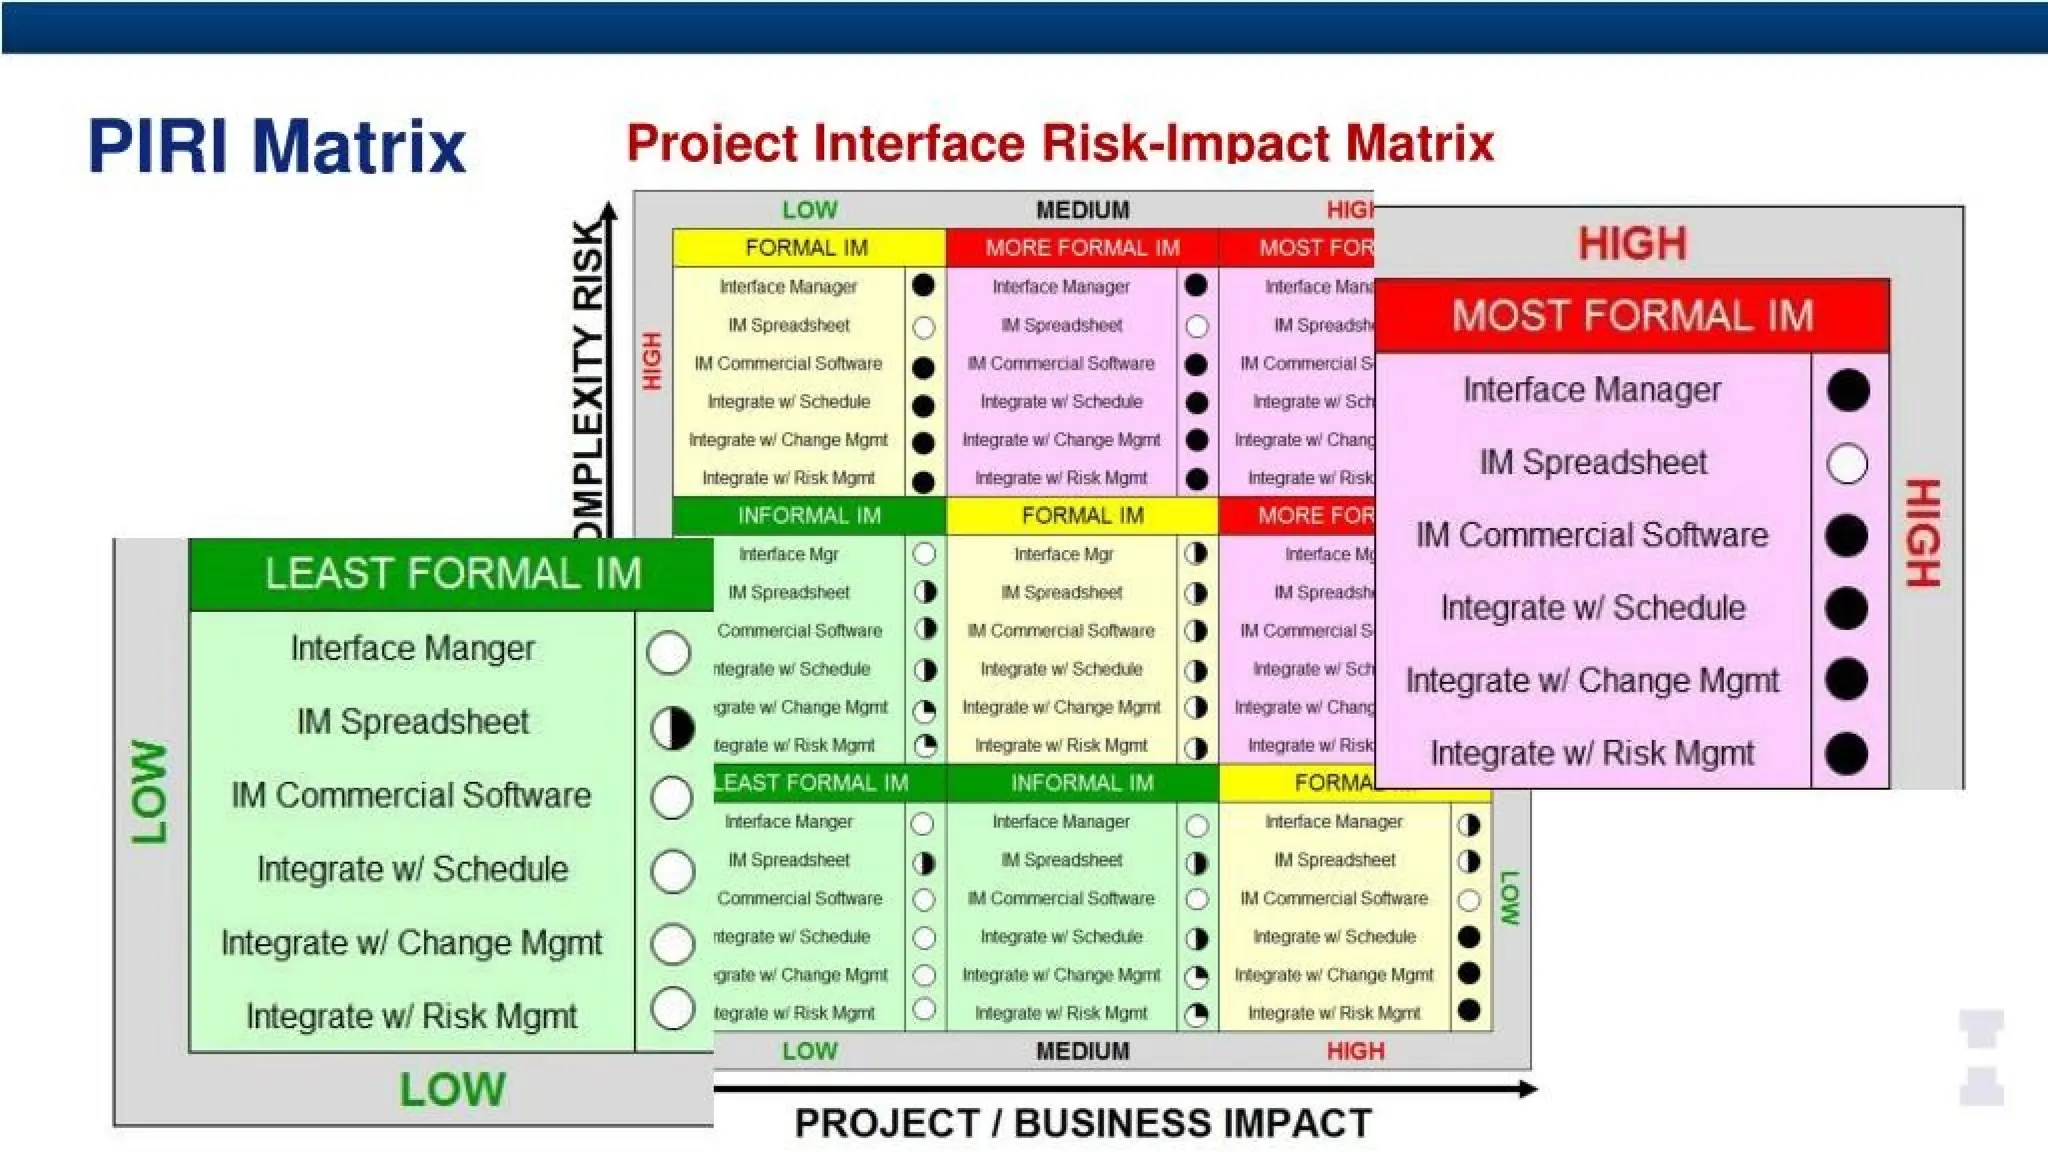
PIRI Matrix
LOW MEDIUMHlGh
3MPLEXITY
RISK
HIGH
MORE FORMAL IM MOST FOfd
literfacc Mnnagci • interlace hfard
At SpttadBhrW*
o IM spnatm
W Commercial Software • IM Ccmmeicial S
Integrate wf ScbecMe • integrate Set
Inlegrale w>Charge Mtrrfl • Integrate w.‘Chant
Integrate w1
Risk Mgmt • Integrate w Risk
FORMAL IM MORE FOR
Interface Mgi * interface Mr
■w spreadsheet > IM Spreads!!
W Ccimrwo# Sottwfirrj o IM Commercial 5
Inteyriite w'SctedJa MEHJtetew.' SC/
Inteqiale w- Charge kVnfl Integrate Chant
Integrate w' Risk Mgmt
•3 Integrate w1
Risk
FORMAL IM
interfaceManager •
IM SpreadSheel
O
IM Commercial Software
•
Integrate wr
Schedule
•
integrate w,1
Change Mgrrt
•
Integrate wr Rtsk Mgnl
•
INFORMAL IM
MOST FORMAL IM
Interface Manager •
IM Spreadsheet (2
IM Commercial Software •
Integrate w/ Schedule •
Integrate w/ Change Mgmt •
Integrate w/ Risk Mgmt •
□
HIGH
nlerfarft Mgi
IM Spiendsheel
Gomnwraal Scflwant
Interface Manger
IM Spreadsheet
IM Commercial Software
Integrate w/ Schedule
Integrate w/ Change Mgmt
Integrate w Risk Mgmt
LOW
nlegiate w Stfiedute
■gratew' Change Mqn'l
teqrate w’Risk Moml
L
O
W
LEAST FORMAL IM INFORMAL IM
0 Interface Manager
O interlace Manager
» U Speadsheei
» IM Spreadsheel »
0 H Gonimercjai Software O IM n fjnmarcial Software O
0 integrate w,' Schetttie O Megrare w sofieduie •
0 Ntgrafa wi chanoeMann & integrate w Change Mgmt •
0 Heonte w/ Risk Munn kileurttie w Risk Mgrri •
Interface Manger
IM Spreadsheel
Commercial Software
rtegrateuwSciteAfe
flrataw.'CMmosMortit
teyttee w- Risk Msjrtl
LOW MEDIUM HIGH
PROJECT / BUSINESS IMPACT
43.
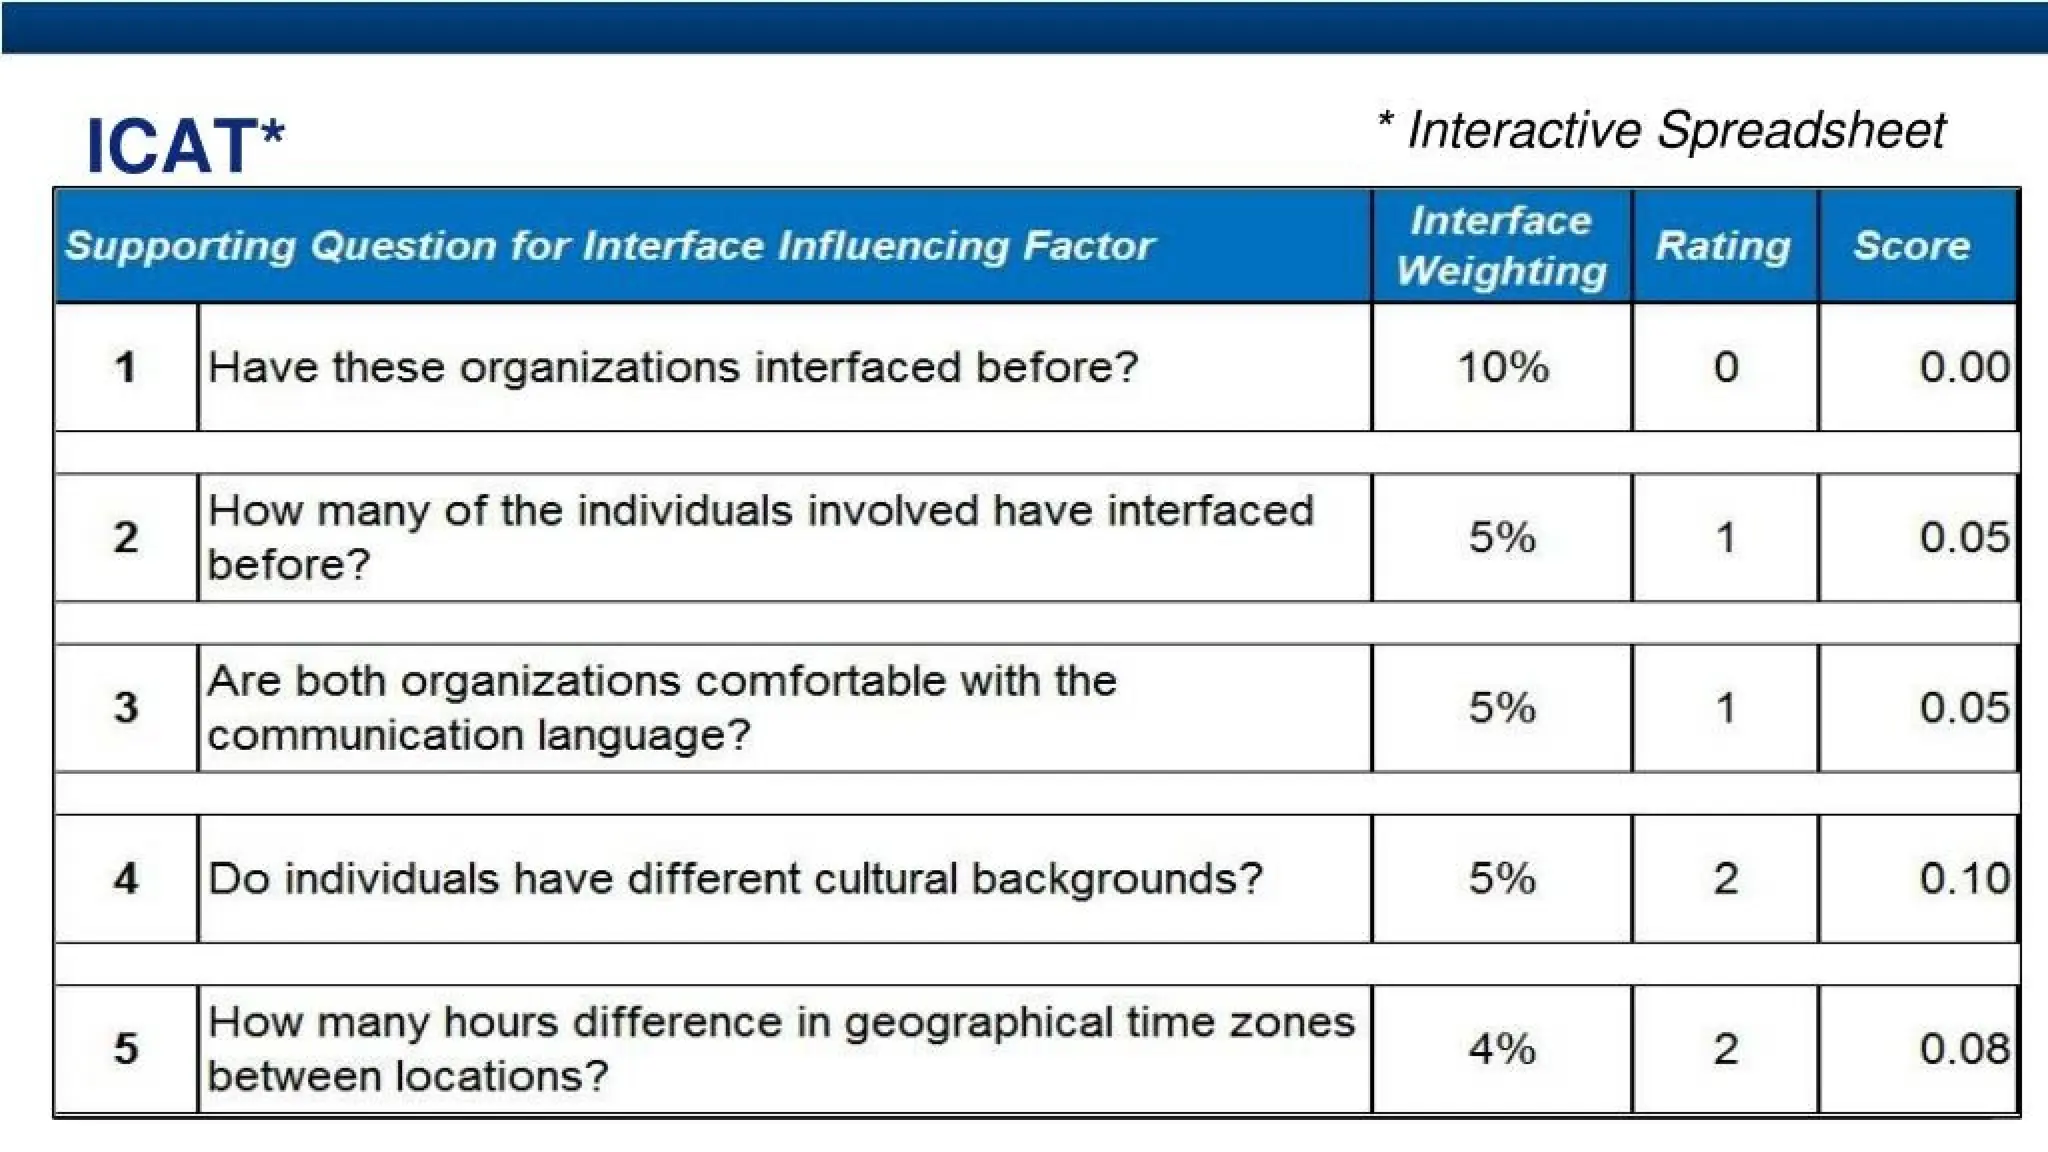
* Interactive Spreadsheet
ICAT*
SupportingQuestion for Interface Influencing Factor
Interface
Weighting
Rating Score
1 Have these organizations interfaced before? 10% 0 0.00
2
How many of the individuals involved have interfaced
before?
5% 1 0.05
3
Are both organizations comfortable with the
communication language?
5% 1 0.05
4 Do individuals have different cultural backgrounds? 5% 2 0.10
5
How many hours difference in geographical time zones
between locations?
4% 2 0.08
44.
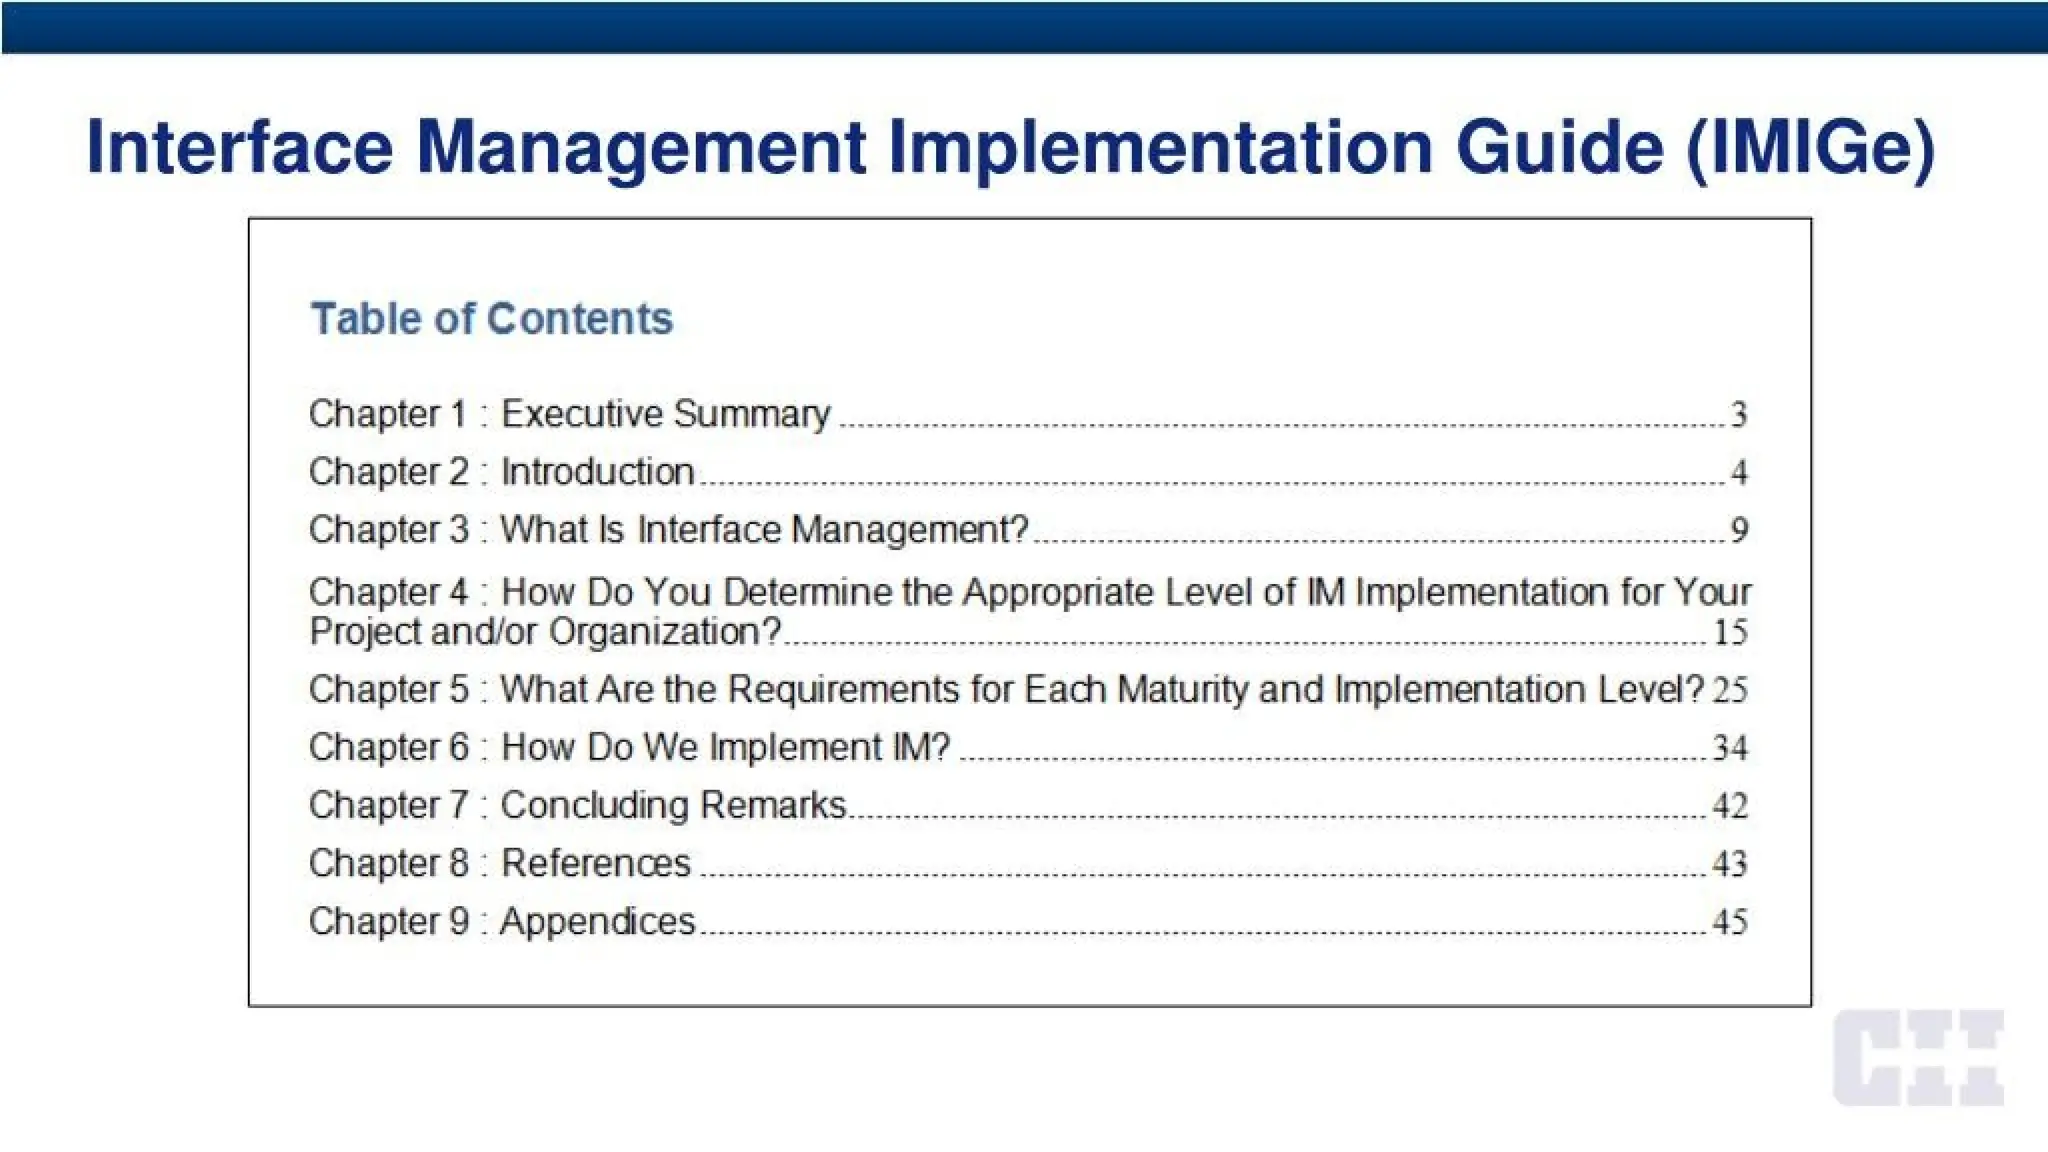
Interface Management ImplementationGuide (IMIGe)
Table of Contents
Chapter 1 ; Executive Summary 3
Chapter 2 : Introduction 4
Chapter3 : What Is Interface Management? 9
Chapter 4 How Do You Determine the Appropriate Level of IM Implementation for Your
Project and/or Organization? _________ _______ _ _______15
Chapter 5 : What Are the Requirements for Each Maturity and Implementation Level? 25
Chapter 6 : How Do We Implement IM? 34
Chapter? : Concluding Remarks.. . . .42
Chapters : References 43
Chapters : Appendices .....45
Summary of ToolsDeveloped by RT 302
* Interface Management Implementation Guide (IMIGe)
- Project Interface Risk-Impact (PIRI)Matrix
- Interface Complexity Assessment Tool (ICAT)
- IM Maturity Tool
- IM Implementation Roadmap
47.
Learning Objectives
• Learningabout Interface Management (IM)
- What is Interface Management?
- Why IM?
- What level of IM is appropriate for a project or organization?
• Understanding research findings
Introducing available IM products and tools
48.
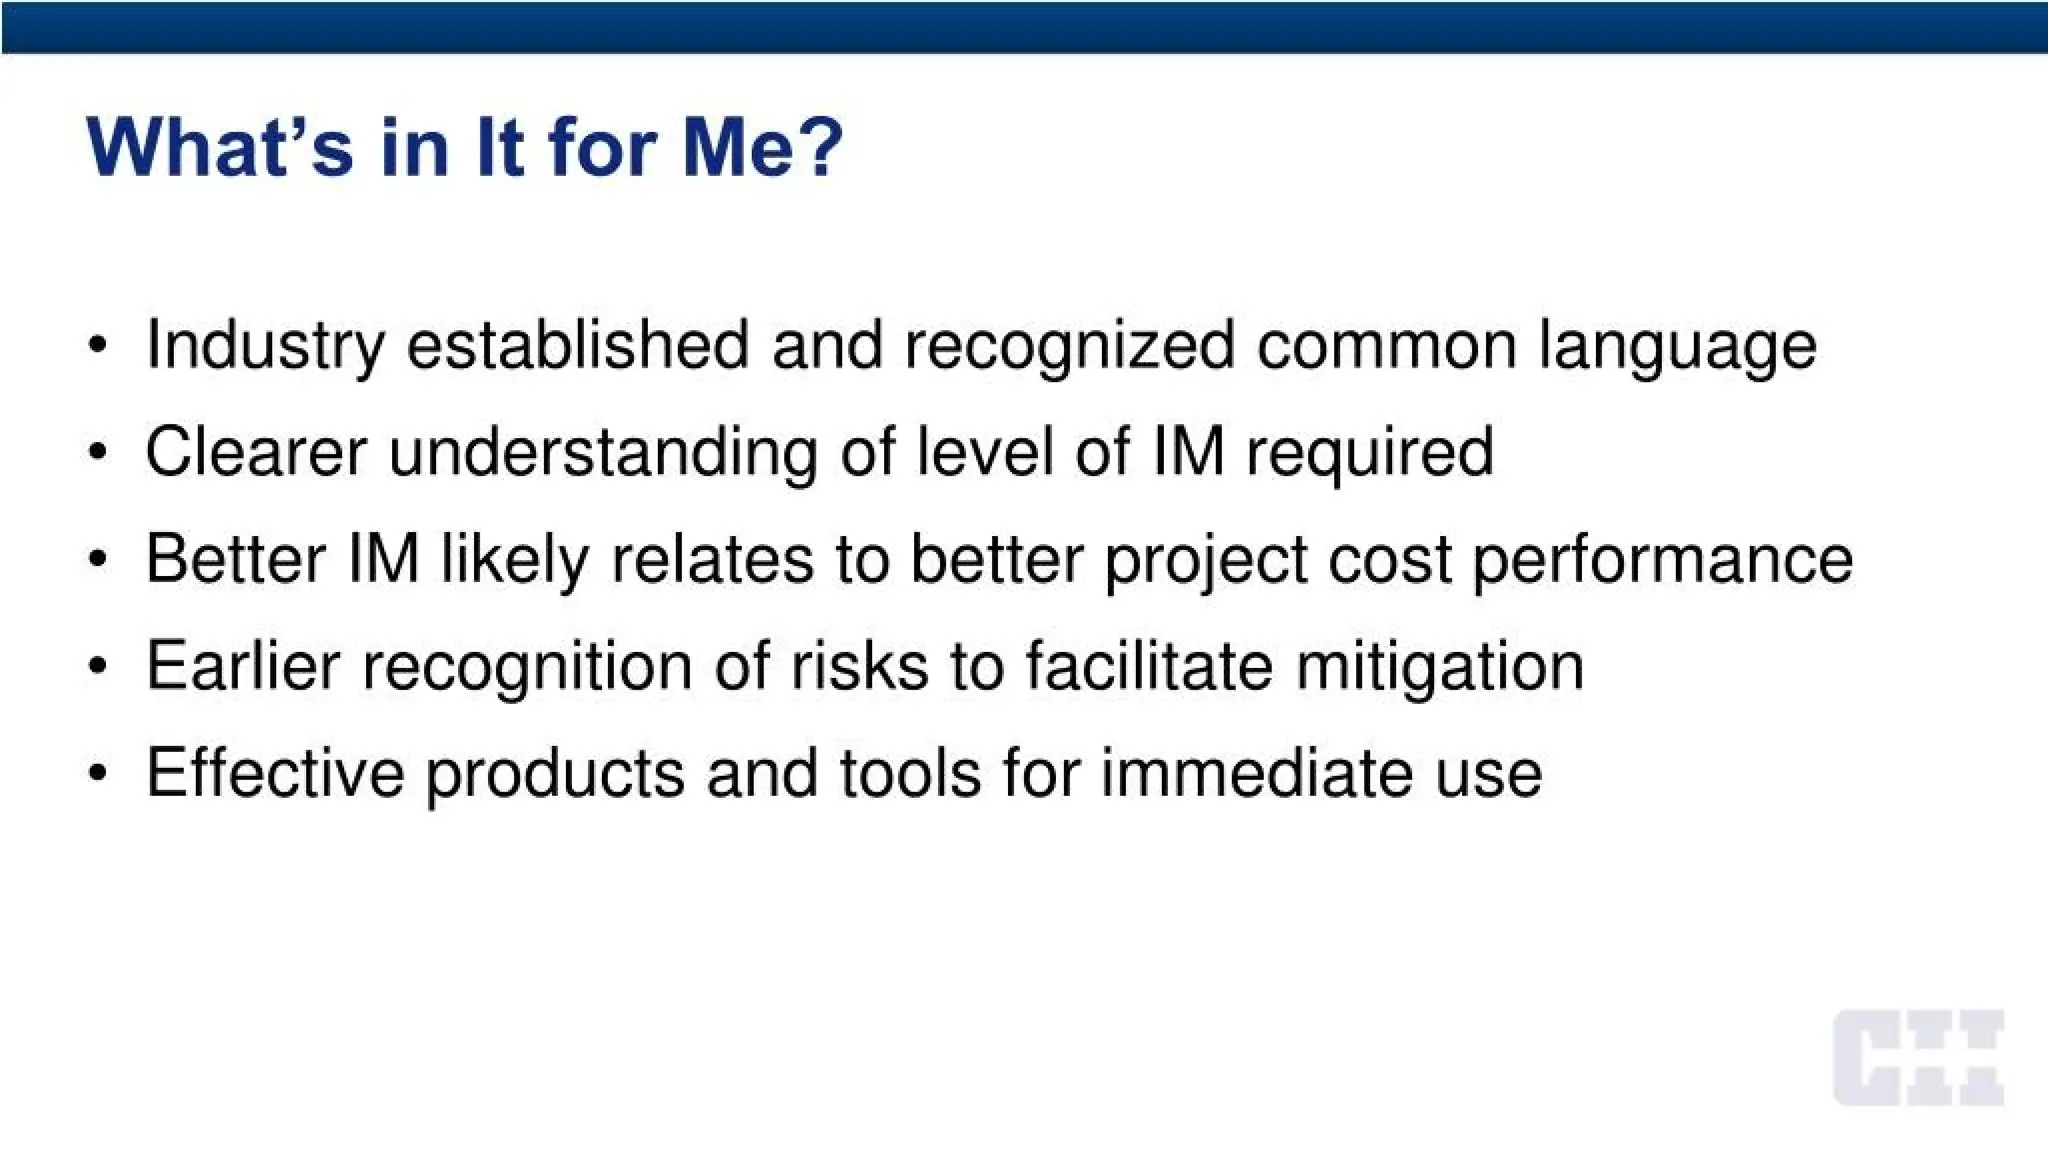
What’s in Itfor Me?
• Industry established and recognized common language
• Clearer understanding of level of IM required
• Better IM likely relates to better project cost performance
• Earlier recognition of risks to facilitate mitigation
• Effective products and tools for immediate use
49.
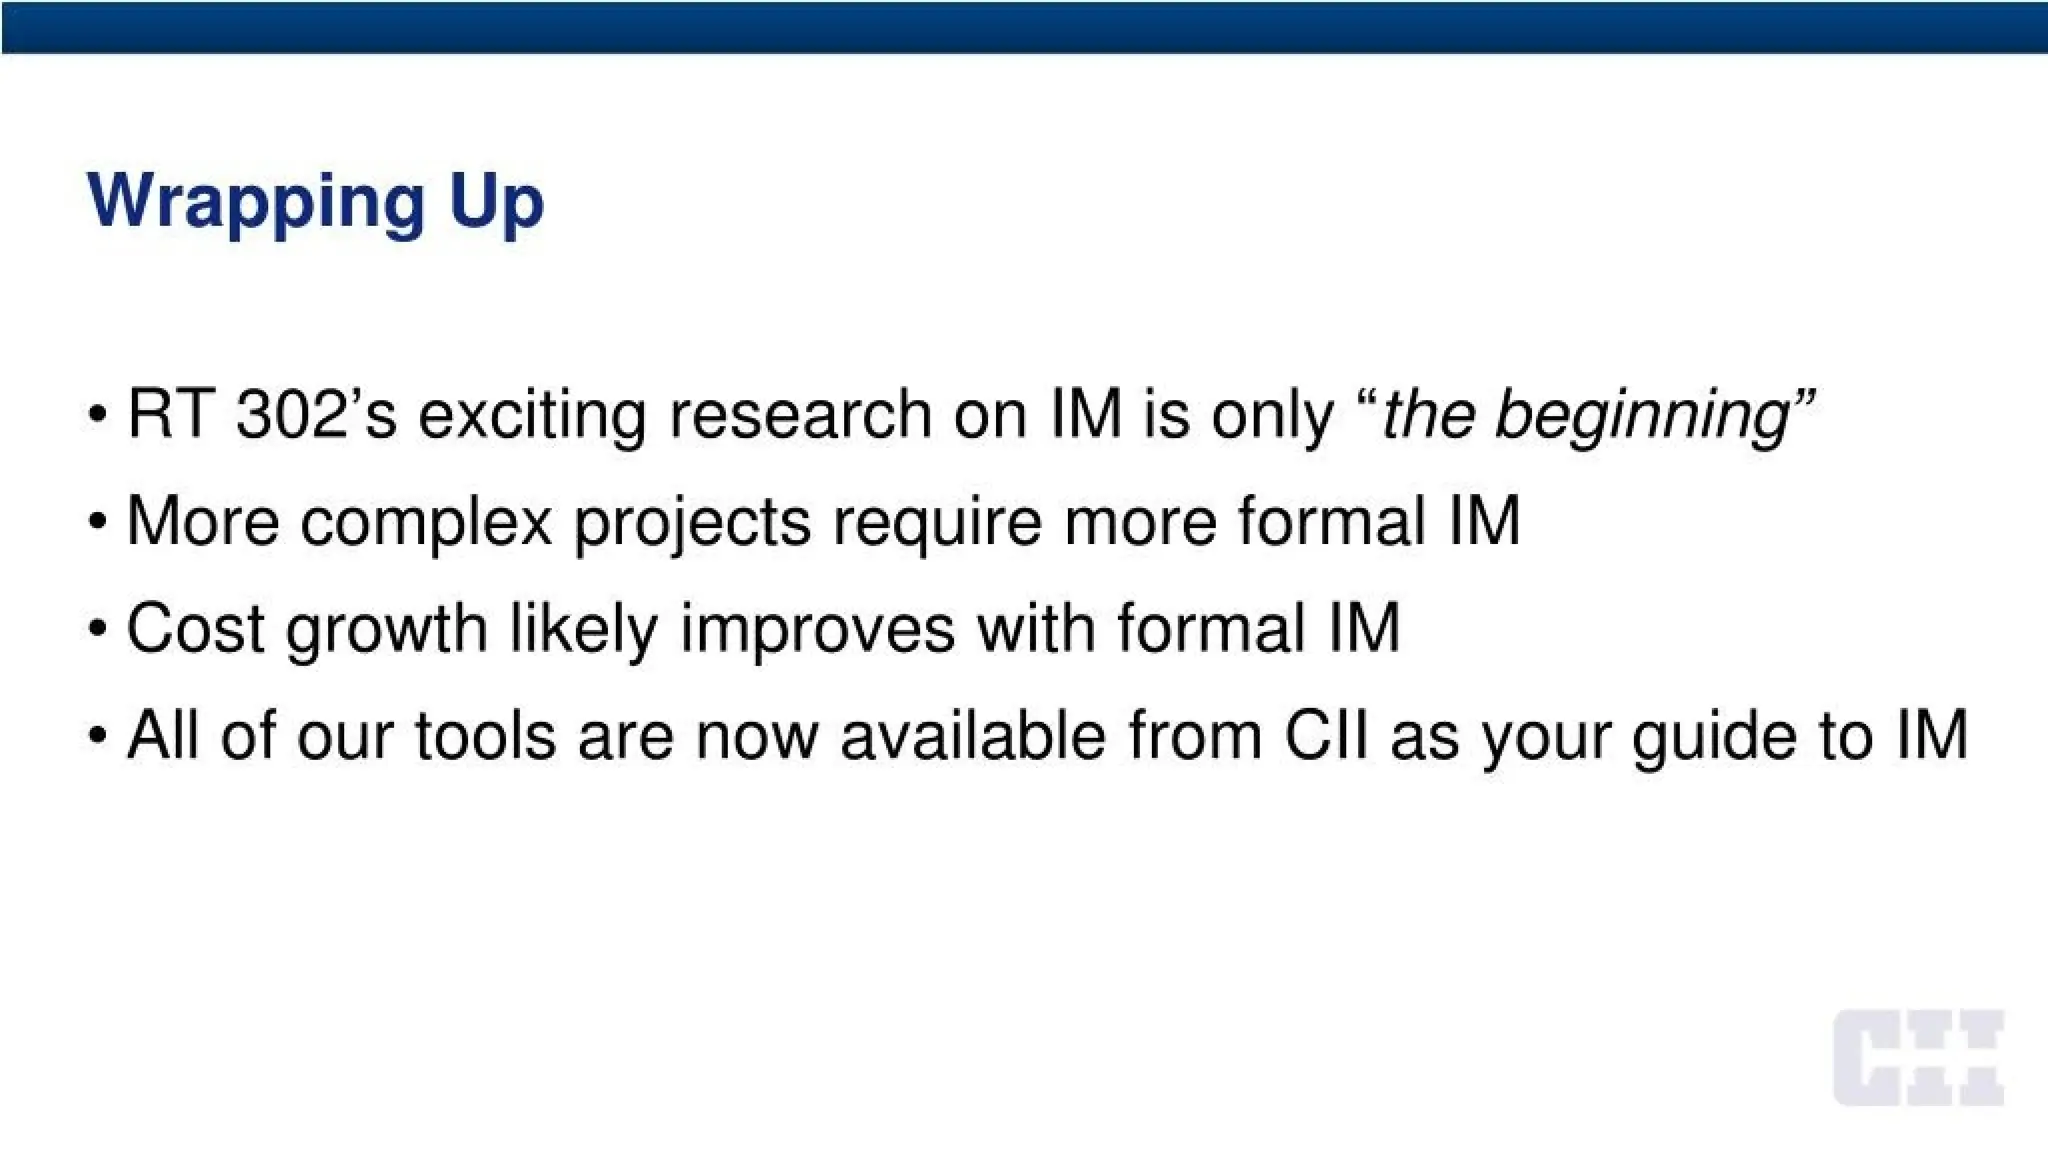
Wrapping Up
• RT302’s exciting research on IM is only “the beginning”
• More complex projects require more formal IM
• Cost growth likely improves with formal IM
• All of our tools are now available from CH as your guide to IM
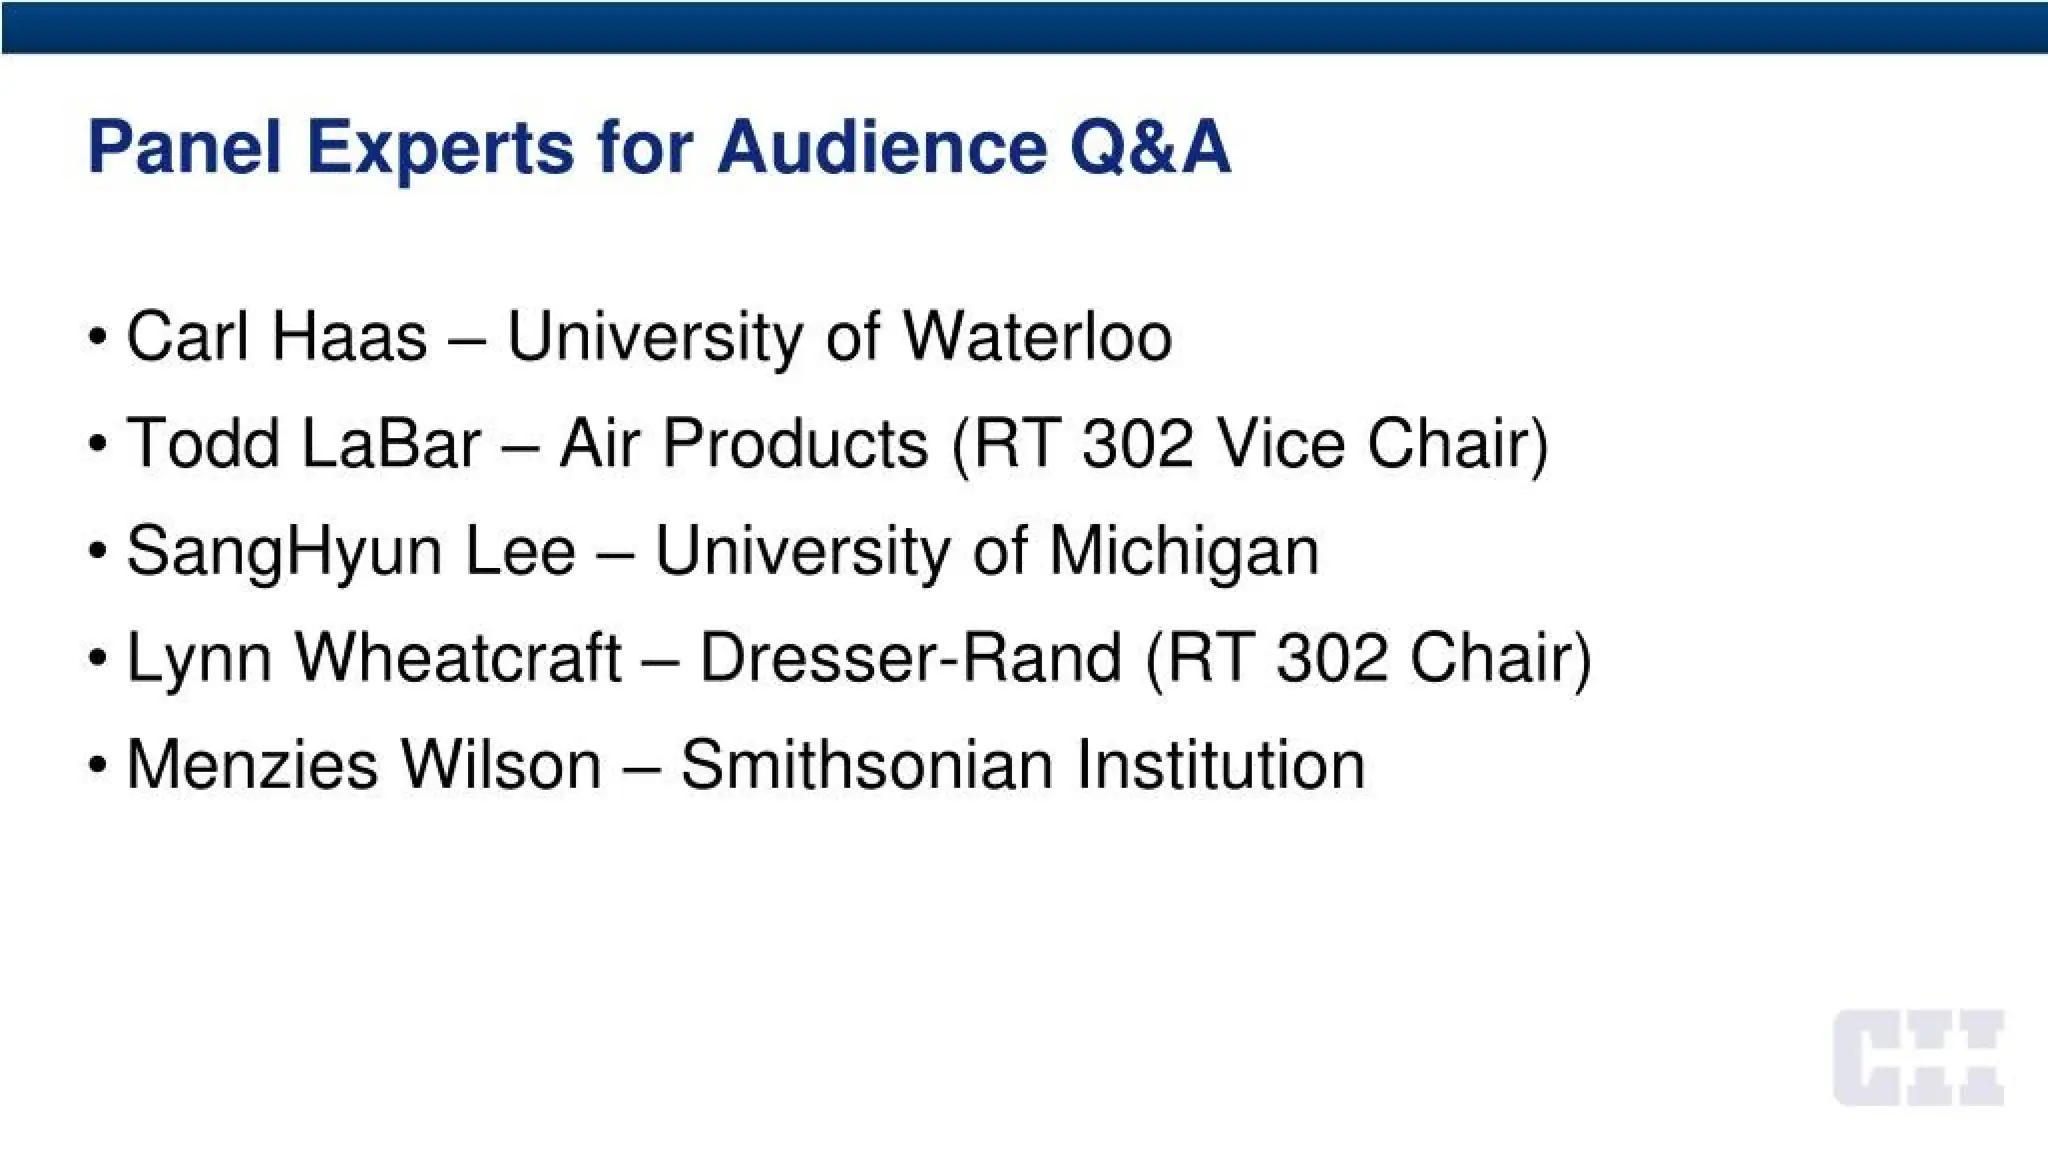
Panel Experts forAudience Q&A
• Carl Haas - University of Waterloo
• Todd LaBar - Air Products (RT 302 Vice Chair)
• SangHyun Lee - University of Michigan
• Lynn Wheatcraft - Dresser-Rand (RT 302 Chair)
• Menzies Wilson - Smithsonian Institution