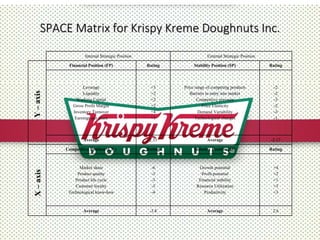
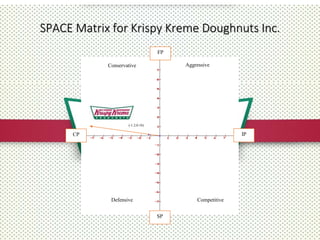
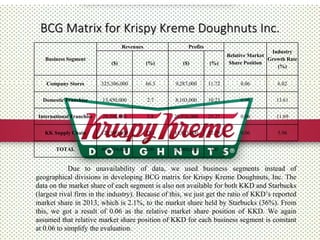
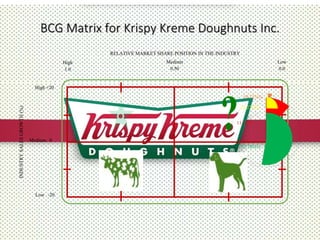
Jholina B. Gamboa
Kate Bernadette T. Madayag
BA 190 – Marketing Management
University of the Philippines
Prof. Mita Angela M. Dimalanta
SPACE Matrix for Krispy Kreme Doughnuts Inc.
Y–axisX–axis
Internal Strategic Position External Strategic Position
Financial Position (FP) Rating Stability Position (SP) Rating
Leverage
Liquidity
Working Capital
Gross Profit Margin
Inventory Turnover
Earnings per share
+3
+2
+2
+2
+4
+1
Price range of competing products
Barriers to entry into market
Competitive pressure
Price Elasticity
Demand Variability
Technological changes
-2
-2
-3
-2
-3
-1
Average 2.33 Average -2.17
Competitive Position (CP ) Rating Industry Position (IP) Rating
Market share
Product quality
Product life cycle
Customer loyalty
Technological know-how
-6
-3
-3
-3
-4
Growth potential
Profit potential
Financial stability
Resource Utilization
Productivity
+4
+2
+1
+3
+3
Average -3.8 Average 2.6
SPACE Matrix for Krispy Kreme Doughnuts Inc.
FP
IP
SP
CP
(-1.2,0.16)
Conservative Aggressive
Defensive Competitive
BCG Matrix for Krispy Kreme Doughnuts Inc.
Business Segment
Revenues Profits
Relative Market
Share Position
Industry
Growth Rate
(%)
($) (%) ($) (%)
Company Stores 325,306,000 66.3 9,287,000 11.72 0.06 6.02
Domestic Franchise 13,450,000 2.7 8,103,000 10.23 0.06 13.61
International Franchise 28,598,000 5.8 20,026,000 25.27 0.06 11.69
KK Supply Chain 122,980,000 25.1 41,823,000 52.78 0.06 5.96
TOTAL 490,334,000 100 30,060,000 100
Due to unavailability of data, we used business segments instead of
geographical divisions in developing BCG matrix for Krispy Kreme Doughnuts, Inc. The
data on the market share of each segment is also not available for both KKD and Starbucks
(largest rival firm in the industry). Because of this, we just get the ratio of KKD’s reported
market share in 2013, which is 2.1%, to the market share held by Starbucks (36%). From
this, we got a result of 0.06 as the relative market share position of KKD. We again
assumed that relative market share position of KKD for each business segment is constant
at 0.06 to simplify the evaluation.
BCG Matrix for Krispy Kreme Doughnuts Inc.
11.72%
INDUSTRYSALESGROWTH(%)
RELATIVE MARKET SHARE POSITION IN THE INDUSTRY
Low
0.0
Medium
0.50
High
1.0
Medium 0
Low -20
High +20
10.23%%
25.27%%
52.78%%
Product-Positioning Map for Krispy Kreme Doughnuts Inc.
High freshness
Low freshness
High PriceLow Price

Krispy Kreme SPACE Matrix, BCG Matrix and Product Positioning Map

  • 1.
    Jholina B. Gamboa KateBernadette T. Madayag BA 190 – Marketing Management University of the Philippines Prof. Mita Angela M. Dimalanta
  • 2.
    SPACE Matrix forKrispy Kreme Doughnuts Inc. Y–axisX–axis Internal Strategic Position External Strategic Position Financial Position (FP) Rating Stability Position (SP) Rating Leverage Liquidity Working Capital Gross Profit Margin Inventory Turnover Earnings per share +3 +2 +2 +2 +4 +1 Price range of competing products Barriers to entry into market Competitive pressure Price Elasticity Demand Variability Technological changes -2 -2 -3 -2 -3 -1 Average 2.33 Average -2.17 Competitive Position (CP ) Rating Industry Position (IP) Rating Market share Product quality Product life cycle Customer loyalty Technological know-how -6 -3 -3 -3 -4 Growth potential Profit potential Financial stability Resource Utilization Productivity +4 +2 +1 +3 +3 Average -3.8 Average 2.6
  • 3.
    SPACE Matrix forKrispy Kreme Doughnuts Inc. FP IP SP CP (-1.2,0.16) Conservative Aggressive Defensive Competitive
  • 4.
    BCG Matrix forKrispy Kreme Doughnuts Inc. Business Segment Revenues Profits Relative Market Share Position Industry Growth Rate (%) ($) (%) ($) (%) Company Stores 325,306,000 66.3 9,287,000 11.72 0.06 6.02 Domestic Franchise 13,450,000 2.7 8,103,000 10.23 0.06 13.61 International Franchise 28,598,000 5.8 20,026,000 25.27 0.06 11.69 KK Supply Chain 122,980,000 25.1 41,823,000 52.78 0.06 5.96 TOTAL 490,334,000 100 30,060,000 100 Due to unavailability of data, we used business segments instead of geographical divisions in developing BCG matrix for Krispy Kreme Doughnuts, Inc. The data on the market share of each segment is also not available for both KKD and Starbucks (largest rival firm in the industry). Because of this, we just get the ratio of KKD’s reported market share in 2013, which is 2.1%, to the market share held by Starbucks (36%). From this, we got a result of 0.06 as the relative market share position of KKD. We again assumed that relative market share position of KKD for each business segment is constant at 0.06 to simplify the evaluation.
  • 5.
    BCG Matrix forKrispy Kreme Doughnuts Inc. 11.72% INDUSTRYSALESGROWTH(%) RELATIVE MARKET SHARE POSITION IN THE INDUSTRY Low 0.0 Medium 0.50 High 1.0 Medium 0 Low -20 High +20 10.23%% 25.27%% 52.78%%
  • 6.
    Product-Positioning Map forKrispy Kreme Doughnuts Inc. High freshness Low freshness High PriceLow Price