
Recommended
More Related Content
What's hot
Viewers also liked
Viewers also liked (11)
Similar to KPI Examples
Similar to KPI Examples (20)
KPI Examples
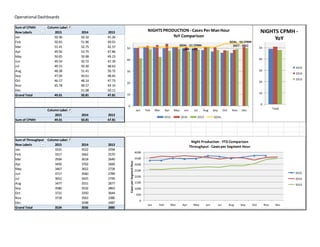
- 1. Operational Dashboards Sum of CPMH Column Labels Row Labels 2015 2014 2013 Jan 50.36 50.32 41.26 Feb 50.65 51.96 49.01 Mar 51.41 52.75 42.57 Apr 49.92 53.75 47.86 May 50.65 50.98 49.23 Jun 49.54 50.72 47.39 Jul 49.15 50.30 48.63 Aug 48.38 51.41 50.72 Sep 47.04 50.61 48.65 Oct 46.17 48.14 47.73 Nov 45.78 48.57 49.14 Dec 0.00 51.08 50.11 Grand Total 49.01 50.81 47.81 Column Labels 2015 2014 2013 Sum of CPMH 49.01 50.81 47.81 Sum of Throughput Column Labels Row Labels 2015 2014 2013 Jan 3331 3522 2594 Feb 3317 3662 2570 Mar 3504 3618 2640 Apr 3456 3702 2660 May 3467 3652 2728 Jun 3717 3560 2789 Jul 3652 3425 2749 Aug 3477 3551 2877 Sep 3580 3532 2863 Oct 3721 3350 3044 Nov 3718 3563 3386 Dec #DIV/0! 3598 3487 Grand Total 3534 3556 2885 GOAL - 51 CPMH (JAN - SEP) GOAL - 54 CPMH (OCT - DEC) 0 10 20 30 40 50 Jan Feb Mar Apr May Jun Jul Aug Sep Oct Nov Dec NIGHTS PRODUCTION - Cases Per ManHour YoY Comparison 2015 2014 2013 GOAL 0 10 20 30 40 50 Total NIGHTS CPMH - YoY 2015 2014 2013 0 500 1000 1500 2000 2500 3000 3500 4000 Jan Feb Mar Apr May Jun Jul Aug Sep Oct Nov Dec CasesperSegmentHour Night Production - YTD Comparison Throughput - Cases per Segment Hour 2015 2014 2013
- 2. AS ISv. TO BE Costanalysis Static Fringe YES 10 Headcount Savings OT % Rentals Cases 22,000 Cases 22,000 10 Hr Pay YES 70 $1,100.68 26.82% Routes 85 Routes 98.50 Mileage & Maint. Reduc. NO 110% 70.5 $1,113.18 26.30% Cs/Rt 258.82 Cs/Rt 223.35 Trucks Owned 80 71 $1,125.68 25.77% Fixed Truck Cost 75 71.5 $1,138.18 25.25% OT% 11% OT% 0.00% Truck Rental Cost 88.00$ 72 $1,150.68 24.73% 72.5 $1,163.18 24.20% Cs/Hr 23.00 Cs/Hr 23.00 Average Miles 112 73 $1,175.68 23.68% 73.5 $1,188.18 23.16% Hours 956.52 Hours 956.52 74 $1,200.68 22.64% Cost Hr/Rt 11.25 Hr/Rt 9.71 74.5 $1,213.18 22.11% 25.00$ Reg 10.00 250.00$ Reg 10.00 250.00$ 75 $1,225.68 21.59% 37.50$ OT 1.25 46.99$ OT 0.00 -$ 75.5 $1,238.18 21.07% 50.00$ DT 0.00 -$ DT 0.00 -$ 76 $1,250.68 20.55% 25.00$ Fringe 10.00 250.00$ Fringe 10.00 250.00$ 76.5 $1,263.18 20.02% 77 $1,275.68 19.50% 547$ 500$ 77.5 $1,288.18 18.98% 46,495$ Wage 49,250$ Wage 78 $1,300.68 18.45% 6,000$ Fixed Truck Cost 6,000$ Fixed Truck Cost 78.5 $1,313.18 17.93% 44$ Mileage & Maintainance 44$ Mileage & Maintainance 79 $1,325.68 17.41% 9,517$ Total Fixed Truck 9,517$ Total Fixed Truck 79.5 $1,338.18 16.89% 440$ Additional Truck Rental 1,628$ Additional Truck Rental 80 $1,307.20 16.36% 0 242$ Mileage & Maintainance 896$ Mileage & Maintainance 80.5 $1,176.48 15.84% 0.5 682$ Total Rental 2,524$ Total Rental 81 $1,045.76 15.32% 1 2.58$ 56,694$ ==> (4,597)$ <== 61,291$ 3$ 81.5 $915.04 14.80% 1.5 82 $784.32 14.27% 2 82.5 $653.60 13.75% 2.5 83 $522.88 13.23% 3 83.5 $392.16 12.70% 3.5 84 $261.44 12.18% 4 84.5 $130.72 11.66% 4.5 85 $0.00 11.14% 5 85.5 ($130.72) 10.61% 5.5 86 ($261.44) 10.09% 6 86.5 ($392.16) 9.57% 6.5 87 ($522.88) 9.05% 7 87.5 ($653.60) 8.52% 7.5 88 ($784.32) 8.00% 8 88.5 ($915.04) 7.48% 8.5 89 ($1,045.76) 6.95% 9 89.5 ($1,176.48) 6.43% 9.5 Current Proposed RENTALS FIXED ASSET WAGE Graph 0% 5% 10% 15% 20% 25% 30% -5000 -4000 -3000 -2000 -1000 0 1000 2000 70 75 80 85 90 95 Sum of Savings Sum of OT % 0% Overtime Goal Seek