
Recommended
Recommended
More Related Content
What's hot
What's hot (19)
Similar to Tej vardhan sail_valuation
Similar to Tej vardhan sail_valuation (20)
Recently uploaded
Recently uploaded (20)
Tej vardhan sail_valuation
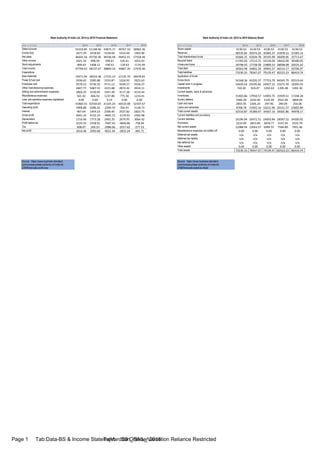
- 1. Page 1 Tab:Data-BS & Income Statement 20 October 2016TejVardhan_SAIL_Valuation Reliance Restricted Steel Authority of India Ltd. 2014 to 2018 Financial Statement Steel Authority of India Ltd. 2014 to 2018 Balance Sheet Amt. in Crores 2014 2015 2016 2017 2018 Amt. in Crores 2014 2015 2016 2017 2018 Sales turnover 52319.85 51148.96 43875.17 49767.10 58962.36 Share capital 4130.53 4130.53 4130.53 4130.53 4130.53 Excise duty 5677.29 5418.60 5128.69 5314.69 1403.90 Reserves 38535.82 39374.25 35065.37 31878.53 31583.14 Net sales 46642.56 45730.36 38746.48 44452.41 57558.46 Total shareholders funds 42666.35 43504.78 39195.90 36009.06 35713.67 Other income 2021.50 998.59 594.67 535.61 1053.43 Secured loans 11765.05 17113.71 16134.04 18416.09 30180.65 Stock adjustments -894.63 1408.12 -540.61 -120.63 -1135.49 Unsecured loans 18798.93 17728.58 23809.53 28098.08 20525.42 Total income 47769.43 48137.07 38800.54 44867.39 57476.40 Total debt 30563.98 34842.29 39943.57 46514.17 50706.07 Expenditure Total liabilities 73230.33 78347.07 79139.47 82523.23 86419.74 Raw materials 19271.94 18523.38 17155.23 21125.70 26678.81 Application of funds Power & fuel cost 5036.65 5585.88 5333.87 5354.95 5925.63 Gross block 54168.36 65205.37 77753.70 84565.79 95519.44 Employee cost 9578.52 9736.35 9715.12 9164.57 9104.27 Capital work in progress 33650.54 29195.82 24927.22 23275.39 18395.43 Other manufacturing expenses 4607.77 5087.55 4315.88 4972.42 4914.11 Investments 720.20 919.07 1292.63 1395.48 1491.30 Selling and administration expenses 2804.25 3150.95 3347.49 3117.28 4510.44 Current assets, loans & advances Miscellaneous expenses 561.42 466.54 1237.80 775.56 1214.41 Inventories 15403.86 17950.57 14903.75 15939.51 17248.28 Less: pre-operative expenses capitalised 0.00 0.00 0.15 0.00 0.00 Sundry debtors 5482.28 3192.00 3143.49 2921.69 3869.94 Total expenditure 41860.55 42550.65 41105.24 44510.48 52347.67 Cash and bank 2855.95 2305.24 297.96 289.09 254.06 Operating profit 5908.88 5586.42 -2304.70 356.91 5128.73 Loans and advances 8768.78 11942.16 16221.96 20151.57 23605.89 Interest 967.64 1454.23 2300.45 2527.82 2822.75 Total current assets 32510.87 35389.97 34567.16 39301.86 44978.17 Gross profit 4941.24 4132.19 -4605.15 -2170.91 2305.98 Current liabilities and provisions Depreciation 1716.69 1773.28 2402.35 2679.95 3064.92 Current liabilities 18196.94 20472.51 24693.84 28587.52 34500.92 Profit before tax 3224.55 2358.91 -7007.50 -4850.86 -758.94 Provisions 2224.99 2853.89 2878.77 3147.45 2555.79 Tax 608.07 266.23 -2986.06 -2017.62 -277.23 Net current assets 12088.94 12063.57 6994.55 7566.89 7921.46 Net profit 2616.48 2092.68 -4021.44 -2833.24 -481.71 Miscellaneous expenses not written off 0.00 0.00 0.00 0.00 0.00 Deferred tax assets n/a n/a n/a n/a n/a Deferred tax liability n/a n/a n/a n/a n/a Net deferred tax n/a n/a n/a n/a n/a Other assets 0.00 0.00 0.00 0.00 0.00 Total assets 73230.33 78347.07 79139.47 82523.23 86419.74 Source : https://www.business-standard. com/company/steel-authority-of-india-ltd- 2299/financials-profit-loss Source : https://www.business-standard. com/company/steel-authority-of-india-ltd- 2299/financials-balance-sheet
- 2. Page 2 Tab:Sales-forecast 20 October 2016TejVardhan_SAIL_Valuation Reliance Restricted Sales Forecast 2014 2015 2016 2017 2018 2019 Projected 2020 Projected Sales 46,642.56 45,730.36 38,746.48 44,452.41 57,558.46 61299.759965284.24429 Year on Year growth -2% -15% 15% 29% Growth rate (assumed)* 6.50% CAGR 4.30% Average growth rate for the last years 6.75% *Therefore, the sales growth rate should lie somewhere 4.5% -7% . To be conservative, we take the growth rate to be 6.5% for 2019 and 2020.
- 3. Page 3 Tab:Key Ratios 20 October 2016TejVardhan_SAIL_Valuation Reliance Restricted Fundamental Ratio Analysis Ratios 2014 2015 2016 2017 2018 Liquidity Ratio Current ratio 1.79 1.73 1.40 1.37 1.30 Quick ratio 0.94 0.85 0.80 0.82 0.80 Capital structure Debt/equity 7.40 8.44 9.67 11.26 12.28 Debt/total assets 0.42 0.44 0.50 0.56 0.59 Asset utilization ROA 0.04 0.03 -0.05 -0.03 -0.01 Inventory turnover 5.89 5.84 5.44 6.41 7.89 Asset turnover 0.64 0.58 0.49 0.54 0.67 Profitability Ratio PE 8.8 18.1 -5.6 -8 -113.3 EPS 6.4 4.9 -10.1 -6.7 -0.7 Dividend yield (%) 3.6 2.2 0 0 0 Avg Mkt Cap (Rs. m) 232,342 367,824 232,342 220,261 318,877 Net profit margin 0.06 0.05 -0.10 -0.06 -0.01 Gross profit margin 0.11 0.09 -0.12 -0.05 0.04 Source : https://www.equitymaster.com/stock-research/financial-data/SAIL/STEEL-AUTHORITY-OF-INDIA-LIMITED-Detailed-Share-Analysis
- 4. Page 4 Tab:WACC cal 20 October 2016TejVardhan_SAIL_Valuation Reliance Restricted Particulars 2014 2015 2016 2017 2018 Sales 46,643) 45,730) 38,746) 44,452) 57,558) EBIT 5,909) 5,586) (2,305) 357) 5,129) Depreciation 1,717) 1,773) 2,402) 2,680) 3,065) Tangible Non current Asset 54,168) 65,205) 77,754) 84,566) 95,519) Capex for the year na 12,810) 14,951) 9,492) 14,019) WACC Calculation Ke Calculation Growth Rate 6.75% Rf 6.50% Ke 20.67% Beta 1.42) Kd 5.57% Rm 16.48% We 0.048) Wd 0.952) WACC 3.52%
- 5. Page 5 Tab:Rm calcuation 20 October 2016TejVardhan_SAIL_Valuation Reliance Restricted Market Return calculation Period Date Share Price BSE Sensex Year 1 1-Apr-09 238.05 11403.25 Year 1 1-May-09 406.30 14625.25 Year 1 1-Jun-09 390.80 14493.84 Year 1 1-Jul-09 462.70 15670.31 Year 1 1-Aug-09 424.30 15666.64 Year 1 1-Sep-09 510.35 17126.84 Year 1 1-Oct-09 471.60 15896.28 Year 1 1-Nov-09 575.40 16926.22 Year 1 1-Dec-09 617.60 17464.81 Year 1 1-Jan-10 569.00 16357.96 Year 1 1-Feb-10 573.65 16429.55 Year 1 1-Mar-10 632.65 17527.77 Year 2 1-Apr-10 618.80 17558.71 Year 2 1-May-10 500.60 16944.63 Year 2 1-Jun-10 485.60 17700.90 Year 2 1-Jul-10 537.15 17868.29 Year 2 1-Aug-10 522.40 17971.12 Year 2 1-Sep-10 651.70 20069.12 Year 2 1-Oct-10 590.00 20032.34 Year 2 1-Nov-10 584.20 19521.25 Year 2 1-Dec-10 678.95 20509.09 Year 2 1-Jan-11 637.75 18327.76 Year 2 1-Feb-11 605.95 17823.40 Year 2 1-Mar-11 620.50 19445.22 Year 3 1-Apr-11 614.75 19135.96 Year 3 1-May-11 589.10 18503.28 Year 3 1-Jun-11 608.70 18845.87 Year 3 1-Jul-11 565.10 18197.20 Year 3 1-Aug-11 468.55 16676.75 Year 3 1-Sep-11 415.25 16453.76 Year 3 1-Oct-11 482.95 17705.01 Year 3 1-Nov-11 384.90 16123.46 Year 3 1-Dec-11 335.25 15454.92 Year 3 1-Jan-12 451.00 17193.55 Year 3 1-Feb-12 471.75 17752.68 Year 3 1-Mar-12 470.40 17404.20 Year 4 1-Apr-12 463.65 17318.81 Year 4 1-May-12 402.85 16218.53 Year 4 1-Jun-12 441.30 17429.98 Year 4 1-Jul-12 413.60 17236.18 Year 4 1-Aug-12 362.50 17429.56 Year 4 1-Sep-12 400.75 18762.74 Year 4 1-Oct-12 373.72 18505.38 Year 4 1-Nov-12 367.20 19339.90 Year 4 1-Dec-12 408.07 19426.71 Year 4 1-Jan-13 385.68 19894.98 Year 4 1-Feb-13 326.18 18861.54 Year 4 1-Mar-13 297.55 18835.77 Year 5 1-Apr-13 288.55 19504.18 Year 5 1-May-13 278.02 19760.30 Year 5 1-Jun-13 260.87 19395.81
- 6. Page 6 Tab:Rm calcuation 20 October 2016TejVardhan_SAIL_Valuation Reliance Restricted Year 5 1-Jul-13 205.51 19345.70 Year 5 1-Aug-13 261.30 18619.72 Year 5 1-Sep-13 258.77 19379.77 Year 5 1-Oct-13 318.61 21164.52 Year 5 1-Nov-13 381.92 20791.93 Year 5 1-Dec-13 403.45 21170.68 Year 5 1-Jan-14 339.33 20513.85 Year 5 1-Feb-14 327.80 21120.12 Year 5 1-Mar-14 375.25 22386.27 Year 6 1-Apr-14 381.68 22417.80 Year 6 1-May-14 452.57 24217.34 Year 6 1-Jun-14 503.35 25413.78 Year 6 1-Jul-14 527.26 25894.97 Year 6 1-Aug-14 489.30 26638.11 Year 6 1-Sep-14 437.61 26630.51 Year 6 1-Oct-14 466.24 27865.83 Year 6 1-Nov-14 450.95 28693.99 Year 6 1-Dec-14 380.49 27499.42 Year 6 1-Jan-15 372.01 29182.95 Year 6 1-Feb-15 338.85 29361.50 Year 6 1-Mar-15 301.89 27957.49 Year 7 1-Apr-15 343.47 27011.31 Year 7 1-May-15 312.98 27828.44 Year 7 1-Jun-15 290.31 27780.83 Year 7 1-Jul-15 235.62 28114.56 Year 7 1-Aug-15 214.42 26283.09 Year 7 1-Sep-15 201.89 26154.83 Year 7 1-Oct-15 235.10 26656.83 Year 7 1-Nov-15 219.18 26145.67 Year 7 1-Dec-15 247.29 26117.54 Year 7 1-Jan-16 238.24 24870.69 Year 7 1-Feb-16 237.34 23002.00 Year 7 1-Mar-16 304.41 25341.86 Year 8 1-Apr-16 333.99 25606.62 Year 8 1-May-16 318.65 26667.96 Year 8 1-Jun-16 306.70 26999.72 Year 8 1-Jul-16 338.00 28051.86 Year 8 1-Aug-16 352.95 28452.17 Year 8 1-Sep-16 356.72 27865.96 Year 8 1-Oct-16 385.54 27930.21 Year 8 1-Nov-16 395.35 26652.81 Year 8 1-Dec-16 372.63 26626.46 Year 8 1-Jan-17 440.56 27655.96 Year 8 1-Feb-17 459.85 28743.32 Year 8 1-Mar-17 459.85 29620.50 Year 9 1-Apr-17 427.65 29918.40 Year 9 1-May-17 481.05 31145.80 Year 9 1-Jun-17 518.64 30921.61 Year 9 1-Jul-17 540.74 32514.94 Year 9 1-Aug-17 607.87 31730.49 Year 9 1-Sep-17 620.30 31283.72 Year 9 1-Oct-17 670.42 33213.13 Year 9 1-Nov-17 662.32 33149.35
- 7. Page 7 Tab:Rm calcuation 20 October 2016TejVardhan_SAIL_Valuation Reliance Restricted Year 9 1-Dec-17 697.86 34056.83 Year 9 1-Jan-18 705.05 35965.02 Year 9 1-Feb-18 671.70 34184.04 Year 9 1-Mar-18 570.90 32968.68 Year 9 1-Apr-18 594.70 35160.36 Year 10 1-May-18 575.45 35322.38 Year 10 1-Jun-18 567.85 35423.48 Year 10 1-Jul-18 562.85 37606.58 Year 10 1-Aug-18 601.65 38645.07 Return of Market (Rm) 16.48%
- 8. Page 8 Tab:Intrinsic Value cal 20 October 2016TejVardhan_SAIL_Valuation Reliance Restricted Particulars 2014 2015 2016 2017 2018 2019 Projected 2020 Projected Sales 46,643) 45,730) 38,746) 44,452) 57,558) 61,300) 65,284) EBIT 5,909) 5,586) (2,305) 357) 5,129) 5,775) 6,503) Average of EBIT margin for 8 yrs 5.73% EBIT MARGIN 12.67% 12.22% -5.95% 0.80% 8.91% 9.42% 9.96% CAGR for depreciation 12.29% Less Tax 608) 266) (2,986) (2,018) (277) 2,760) 3,108) CAGR for capex 2% Tax rate 23% 13% 74% 71% 58% 47.80% 47.80% CAGR Working Capital change 16% NOPAT or EBIT(1-t) 5,301) 5,320) 681) 2,375) 5,406) 3,015) 3,395) Tax rate (assumed avg of last 5 yrs) 47.80% Add Depreciation 1,717) 1,773) 2,402) 2,680) 3,065) 3,442) 3,865) Less Capex - ) 12,810) 14,951) 9,492) 14,019) 14,338) 14,665) Less Working Cap Changes (25) (5,069) 572) 355) (7,921) (9,192) (10,667) FCFF 7,043) (648) (12,439) (4,792) 2,374) 1,311) 3,262) TV n/a n/a n/a n/a n/a n/a 104,740) Present Value n/a n/a n/a n/a n/a 1,311) 91,921) Enterprise Value 93,232) Less Debt (50,706) Add Cash 254) Less Minority Interest - ) Value of Equity 144,192) No of Equity Shares 413) Face value is Rs. 10 Market value 32,238.75 Intrinsic Value 349) No of shares 413.05 Market value per share 78.05 Intrinsic value per share 349.09 UNDERPRICED Recommendation : BUY or HOLD