Download as PDF, PPTX
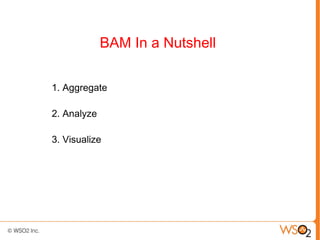
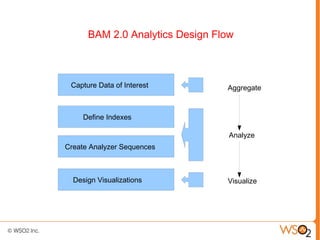
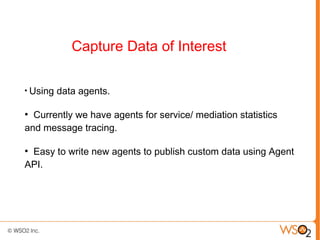
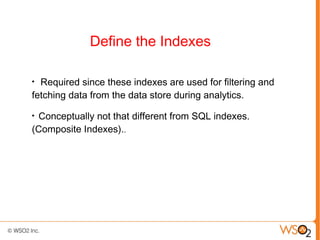
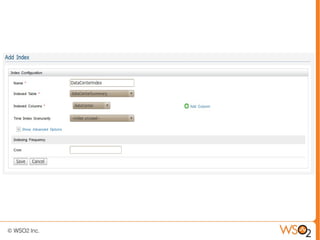
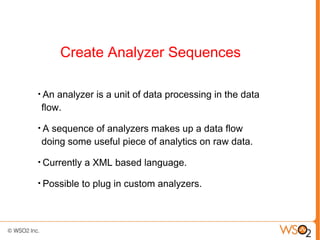
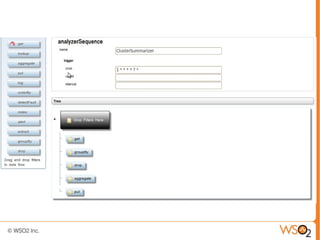
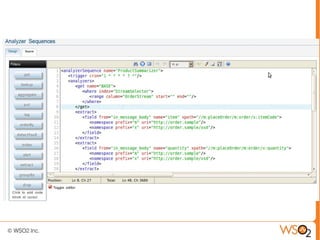
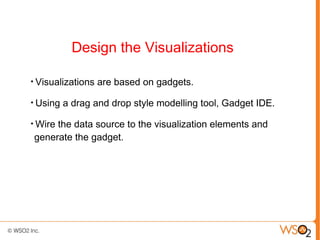
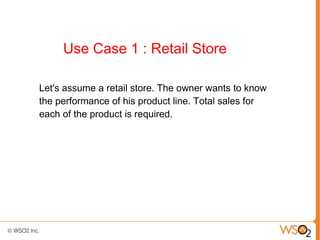
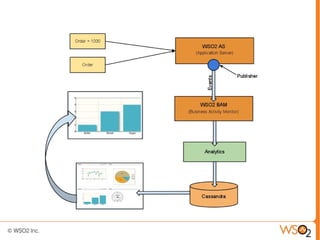
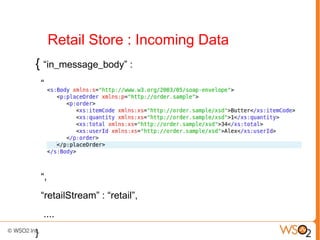
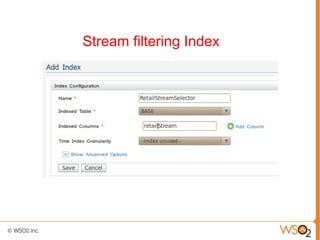
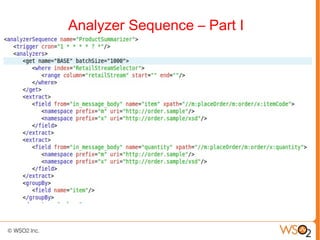
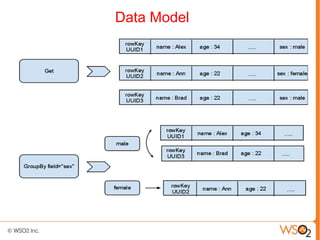
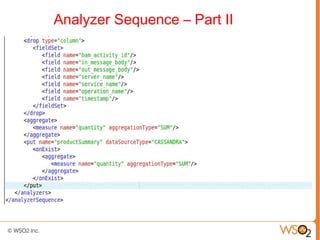
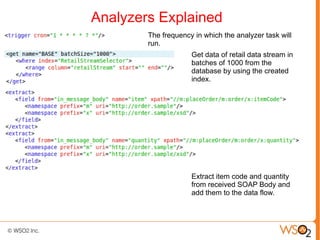
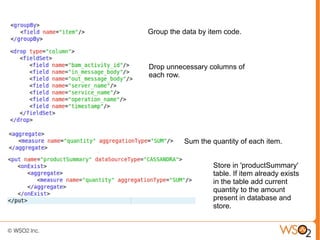
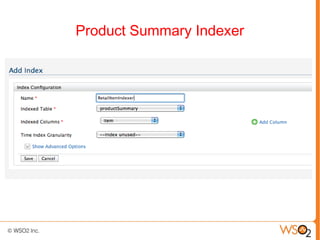
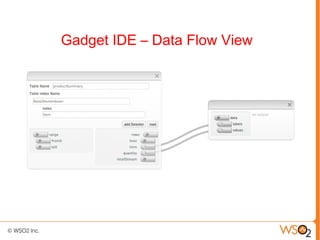
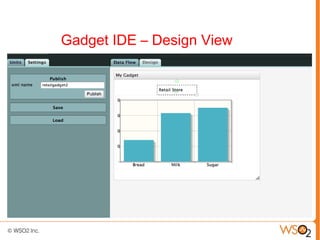
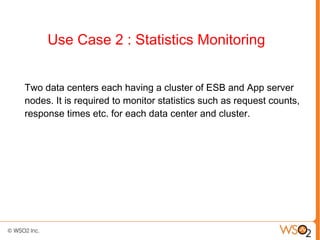
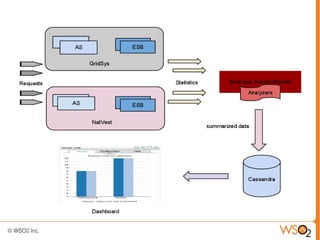
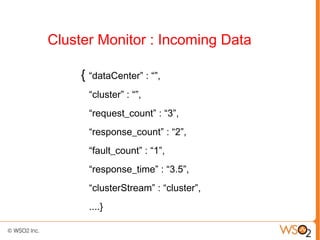
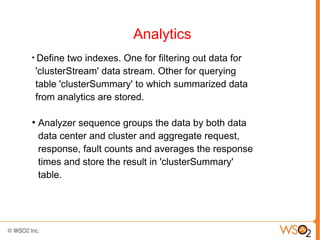
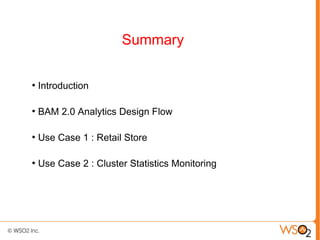
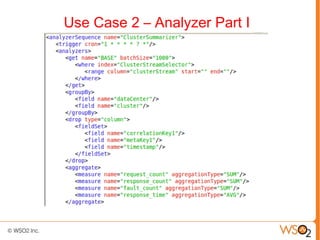
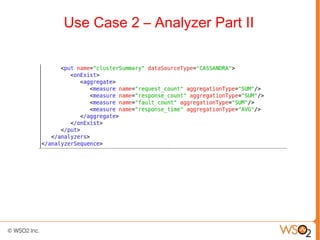
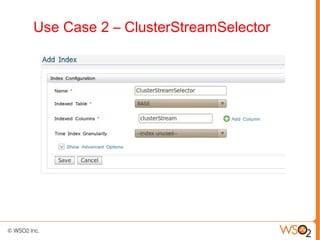
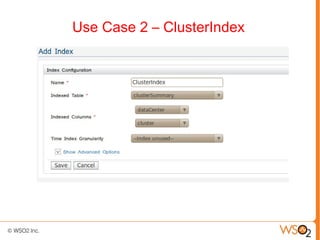

This document discusses key performance indicator (KPI) definition using WSO2 Business Activity Monitoring (BAM) 2.0. It provides an overview of BAM and the BAM 2.0 analytics design flow. It also presents two use cases - one for monitoring retail store performance and another for monitoring statistics across data centers and clusters. The document explains how to capture and analyze data, define indexes, create analyzer sequences, and design visualizations for these use cases in BAM 2.0.


![Back to [Jaspersoft] Basics: Rest API 101](https://cdn.slidesharecdn.com/ss_thumbnails/backtobasics-restapi101-170627102733-thumbnail.jpg?width=640&height=640&fit=bounds)


![Back to [Jaspersoft] basics: visualize.js 101](https://cdn.slidesharecdn.com/ss_thumbnails/backtobasics-visualize-170503082821-thumbnail.jpg?width=640&height=640&fit=bounds)


![[WSO2Con EU 2018] Simplifying Digital Transformation with an "API Aware" Mindset](https://cdn.slidesharecdn.com/ss_thumbnails/sudarakajayashankawso2coneu2018presentationtemplate-181114053247-thumbnail.jpg?width=640&height=640&fit=bounds)


![[apidays Live Australia] How do you enhance customer experience through event...](https://cdn.slidesharecdn.com/ss_thumbnails/shiro-eventdrivenapis-customerenhancement-roundtable1-210922093028-thumbnail.jpg?width=640&height=640&fit=bounds)


![[WSO2Con USA 2018] Patterns for Building Streaming Apps](https://cdn.slidesharecdn.com/ss_thumbnails/wso2conusa2018presentation-patternsforbuildingstreamingapps-180717043111-thumbnail.jpg?width=640&height=640&fit=bounds)
![[WSO2Con Asia 2018] Patterns for Building Streaming Apps](https://cdn.slidesharecdn.com/ss_thumbnails/wso2conasia2018presentation-patternsforbuildingstreamingapps-180810110016-thumbnail.jpg?width=640&height=640&fit=bounds)


![[Roundtable] Choreo - The AI-Native Internal Developer Platform as a Service](https://cdn.slidesharecdn.com/ss_thumbnails/choreo-deck-250328074645-511dded7-thumbnail.jpg?width=640&height=640&fit=bounds)


![5G Explained! A High Level Overview [Introduction]](https://cdn.slidesharecdn.com/ss_thumbnails/5gexplainedahighleveloverview-260119165306-cc137a3e-thumbnail.jpg?width=640&height=640&fit=bounds)


