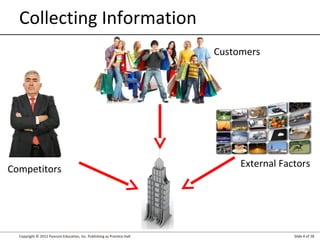
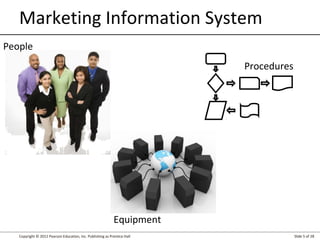
Kotler • Keller
Phillip Kevin Lane
Marketing Management • 14e
Collecting Information and
Forecasting Demand
Chapter 3
Copyright © 2012 Pearson Education, Inc. Publishing as Prentice Hall Slide 3 of 28
Discussion Questions
1. What are the components of a modern
marketing information system?
2. What are useful internal records for such a
system?
3. What makes up a marketing intelligence system?
4. What are some influential macroeconomic
developments?
5. How can companies accurately measure and
forecast demand?
Copyright © 2012 Pearson Education, Inc. Publishing as Prentice Hall Slide 4 of 28
Collecting Information
Customers
Competitors
External Factors
Copyright © 2012 Pearson Education, Inc. Publishing as Prentice Hall Slide 5 of 28
Marketing Information System
People
Equipment
Procedures
Copyright © 2012 Pearson Education, Inc. Publishing as Prentice Hall Slide 6 of 28
Insight
Marketing Information System
Marketing Research
Marketing Intelligence
Internal Records
Copyright © 2012 Pearson Education, Inc. Publishing as Prentice Hall Slide 7 of 28
Internal Records
Order-to-Payment Cycle
Databases / Data Mining
Sales Information
Systems
Copyright © 2012 Pearson Education, Inc. Publishing as Prentice Hall Slide 8 of 28
Marketing Intelligence
News and Trade Publications
Meet with customers,
suppliers, distributors,
and other managers
Monitor social
media sites
Copyright © 2012 Pearson Education, Inc. Publishing as Prentice Hall Slide 9 of 28
Improving Marketing Intelligence
Sales Force
External Experts
Establish industry network
Customer Advisory Panel
Copyright © 2012 Pearson Education, Inc. Publishing as Prentice Hall Slide 10 of 28
Marketing Intelligence & the Internet
Independent Online Forums
Distributor or sales agents feedback sites
Customer review and expert opinion
sites
Customer complaint sites
Copyright © 2012 Pearson Education, Inc. Publishing as Prentice Hall Slide 11 of 28
Using Marketing Intelligence
Share Information
Quickly
Copyright © 2012 Pearson Education, Inc. Publishing as Prentice Hall Slide 12 of 28
Analyzing the Macroenvironment
Copyright © 2012 Pearson Education, Inc. Publishing as Prentice Hall Slide 13 of 28
Needs and Trends
Fad
Megatrend
Trend
Copyright © 2012 Pearson Education, Inc. Publishing as Prentice Hall Slide 14 of 28
Major Environmental Forces
Economic
Sociocultural
Natural
Technological
Political-Legal
Demographics
Copyright © 2012 Pearson Education, Inc. Publishing as Prentice Hall Slide 15 of 28
Demographic Environment
Worldwide population growth
Population age mix
Ethnic and other markets
Educational Groups
Household patterns
Copyright © 2012 Pearson Education, Inc. Publishing as Prentice Hall Slide 16 of 28
The World as a Village
If the world were a village of 100 people:
61 – Asian (20 Chinese, 17 Indian)
18 – Unable to read (33 have cell phones)
18 – Under 10 years of age (11 over 60 years old)
18 – Cars in the village
63 – Inadequate sanitation
67 – Non-Christian
30 – Unemployed or underemployed
53 – Live on less than $2 a day
26 – Smoke
14 – Obese
01 – Have AIDS
Source: David J. Smith and Shelagh Armstrong, If the World Were a Village: A
Book About the World’s People, 2nd
ed. (Tonawanda, NY: Kids Can Press,
2002)
Copyright © 2012 Pearson Education, Inc. Publishing as Prentice Hall Slide 17 of 28
Economic Environment
Consumer
Psychology
Income
Distribution
Copyright © 2012 Pearson Education, Inc. Publishing as Prentice Hall Slide 18 of 28
Sociocultural
Environment
Copyright © 2012 Pearson Education, Inc. Publishing as Prentice Hall Slide 19 of 28
Natural Environment
Environmental Regulations
Copyright © 2012 Pearson Education, Inc. Publishing as Prentice Hall Slide 20 of 28
Technological Environment
Accelerated pace of change
Unlimited opportunities
R&D Spending
Copyright © 2012 Pearson Education, Inc. Publishing as Prentice Hall Slide 21 of 28
Political-Legal Environment
Special Interest Groups
Government Agencies
Laws
Copyright © 2012 Pearson Education, Inc. Publishing as Prentice Hall Slide 22 of 28
Forecasting and Demand Measurement
Market
- Size
- Growth
- Profit potential
Copyright © 2012 Pearson Education, Inc. Publishing as Prentice Hall Slide 23 of 28
Market Types
Potential Market
Available Market
Target Market
Penetrated Market
Copyright © 2012 Pearson Education, Inc. Publishing as Prentice Hall Slide 24 of 28
Figure
3.2
Ninety Types of Demand Measurement
Copyright © 2012 Pearson Education, Inc. Publishing as Prentice Hall Slide 25 of 28
Demand Measurement
Market Demand
Company Demand
Copyright © 2012 Pearson Education, Inc. Publishing as Prentice Hall Slide 26 of 28
Figure
3.3
Market Demand Functions
Copyright © 2012 Pearson Education, Inc. Publishing as Prentice Hall Slide 27 of 28
Estimating Current Demand
Area market potential
Total market potential
Potential
Buyers
Average
purchase
quantity
Average
price
X X
Chain-ratio method
Demand
for new
light beer
Population
Average percentage of income spent on:
X X Food X Beverages X
Alcoholic
beverages
X
Expected % of
spending on
Light beer
Copyright © 2012 Pearson Education, Inc. Publishing as Prentice Hall Slide 28 of 28
Estimating Future Demand
Sales Force Opinions
Forecasting
Past Sales Analysis
Buyer’s Intentions
Expert Opinions

Kotlermm14ch03dppt 4

  • 1.
    Kotler • Keller PhillipKevin Lane Marketing Management • 14e
  • 2.
  • 3.
    Copyright © 2012Pearson Education, Inc. Publishing as Prentice Hall Slide 3 of 28 Discussion Questions 1. What are the components of a modern marketing information system? 2. What are useful internal records for such a system? 3. What makes up a marketing intelligence system? 4. What are some influential macroeconomic developments? 5. How can companies accurately measure and forecast demand?
  • 4.
    Copyright © 2012Pearson Education, Inc. Publishing as Prentice Hall Slide 4 of 28 Collecting Information Customers Competitors External Factors
  • 5.
    Copyright © 2012Pearson Education, Inc. Publishing as Prentice Hall Slide 5 of 28 Marketing Information System People Equipment Procedures
  • 6.
    Copyright © 2012Pearson Education, Inc. Publishing as Prentice Hall Slide 6 of 28 Insight Marketing Information System Marketing Research Marketing Intelligence Internal Records
  • 7.
    Copyright © 2012Pearson Education, Inc. Publishing as Prentice Hall Slide 7 of 28 Internal Records Order-to-Payment Cycle Databases / Data Mining Sales Information Systems
  • 8.
    Copyright © 2012Pearson Education, Inc. Publishing as Prentice Hall Slide 8 of 28 Marketing Intelligence News and Trade Publications Meet with customers, suppliers, distributors, and other managers Monitor social media sites
  • 9.
    Copyright © 2012Pearson Education, Inc. Publishing as Prentice Hall Slide 9 of 28 Improving Marketing Intelligence Sales Force External Experts Establish industry network Customer Advisory Panel
  • 10.
    Copyright © 2012Pearson Education, Inc. Publishing as Prentice Hall Slide 10 of 28 Marketing Intelligence & the Internet Independent Online Forums Distributor or sales agents feedback sites Customer review and expert opinion sites Customer complaint sites
  • 11.
    Copyright © 2012Pearson Education, Inc. Publishing as Prentice Hall Slide 11 of 28 Using Marketing Intelligence Share Information Quickly
  • 12.
    Copyright © 2012Pearson Education, Inc. Publishing as Prentice Hall Slide 12 of 28 Analyzing the Macroenvironment
  • 13.
    Copyright © 2012Pearson Education, Inc. Publishing as Prentice Hall Slide 13 of 28 Needs and Trends Fad Megatrend Trend
  • 14.
    Copyright © 2012Pearson Education, Inc. Publishing as Prentice Hall Slide 14 of 28 Major Environmental Forces Economic Sociocultural Natural Technological Political-Legal Demographics
  • 15.
    Copyright © 2012Pearson Education, Inc. Publishing as Prentice Hall Slide 15 of 28 Demographic Environment Worldwide population growth Population age mix Ethnic and other markets Educational Groups Household patterns
  • 16.
    Copyright © 2012Pearson Education, Inc. Publishing as Prentice Hall Slide 16 of 28 The World as a Village If the world were a village of 100 people: 61 – Asian (20 Chinese, 17 Indian) 18 – Unable to read (33 have cell phones) 18 – Under 10 years of age (11 over 60 years old) 18 – Cars in the village 63 – Inadequate sanitation 67 – Non-Christian 30 – Unemployed or underemployed 53 – Live on less than $2 a day 26 – Smoke 14 – Obese 01 – Have AIDS Source: David J. Smith and Shelagh Armstrong, If the World Were a Village: A Book About the World’s People, 2nd ed. (Tonawanda, NY: Kids Can Press, 2002)
  • 17.
    Copyright © 2012Pearson Education, Inc. Publishing as Prentice Hall Slide 17 of 28 Economic Environment Consumer Psychology Income Distribution
  • 18.
    Copyright © 2012Pearson Education, Inc. Publishing as Prentice Hall Slide 18 of 28 Sociocultural Environment
  • 19.
    Copyright © 2012Pearson Education, Inc. Publishing as Prentice Hall Slide 19 of 28 Natural Environment Environmental Regulations
  • 20.
    Copyright © 2012Pearson Education, Inc. Publishing as Prentice Hall Slide 20 of 28 Technological Environment Accelerated pace of change Unlimited opportunities R&D Spending
  • 21.
    Copyright © 2012Pearson Education, Inc. Publishing as Prentice Hall Slide 21 of 28 Political-Legal Environment Special Interest Groups Government Agencies Laws
  • 22.
    Copyright © 2012Pearson Education, Inc. Publishing as Prentice Hall Slide 22 of 28 Forecasting and Demand Measurement Market - Size - Growth - Profit potential
  • 23.
    Copyright © 2012Pearson Education, Inc. Publishing as Prentice Hall Slide 23 of 28 Market Types Potential Market Available Market Target Market Penetrated Market
  • 24.
    Copyright © 2012Pearson Education, Inc. Publishing as Prentice Hall Slide 24 of 28 Figure 3.2 Ninety Types of Demand Measurement
  • 25.
    Copyright © 2012Pearson Education, Inc. Publishing as Prentice Hall Slide 25 of 28 Demand Measurement Market Demand Company Demand
  • 26.
    Copyright © 2012Pearson Education, Inc. Publishing as Prentice Hall Slide 26 of 28 Figure 3.3 Market Demand Functions
  • 27.
    Copyright © 2012Pearson Education, Inc. Publishing as Prentice Hall Slide 27 of 28 Estimating Current Demand Area market potential Total market potential Potential Buyers Average purchase quantity Average price X X Chain-ratio method Demand for new light beer Population Average percentage of income spent on: X X Food X Beverages X Alcoholic beverages X Expected % of spending on Light beer
  • 28.
    Copyright © 2012Pearson Education, Inc. Publishing as Prentice Hall Slide 28 of 28 Estimating Future Demand Sales Force Opinions Forecasting Past Sales Analysis Buyer’s Intentions Expert Opinions

Editor's Notes

  • #5 Marketers are in position to collect information from customers, competitors, and other external factors/group that can help to identify market changes.
  • #6 A marketing information system consists of people, equipment, and procedures to gather, sort, analyze, evaluate, and distribute information that is needed, timely and accurate.
  • #7 A marketing information system consists of people, equipment, and procedures to gather, sort, analyze, evaluate, and distribute information that is needed, timely and accurate.
  • #8 The order-to-payment cycle entails the process that orders go through once they are received by the company. Includes invoices and shipping documents. Customers prefer firms that can get orders processed quickly and accurately. Sales information systems provide managers with up-to-date information on the current sales of individual products. Databases store and organize information that can be retrieved based on a number of criteria such as purchase history, product preferences, and can even contain demographic and psychographic information on customers.
  • #9 A marketing intelligence system is a set of procedures and sources that managers use to obtain everyday information about developments in the marketing environment. This information can come from reading books and trade journals; talking to customers, distributors, suppliers, etc; monitoring social media; and talking to other managers in the company.
  • #10 Companies can improve marketing intelligence through the methods listed on the slide as well as through channel members, government data sources, and the purchase of information through secondary data sources.
  • #11 Epinions.com, Bizrate.com, or ConsumerReview.com
  • #12 Marketing intelligence should be gathered and shared with decision makers quickly in order to effectively use the information.
  • #13 Where the microenvironment refers to those elements closest to the company, customers, competitors, suppliers, etc., the macroenvrionment refers to those elements that can impact a company, but cannot be controlled. These include things such as the economy, culture, demographics, politics, technology, and the natural environment.
  • #14 Fad – Hula Hoop; Trend – Diet/exercise; Megatrend – Electric automobiles FAD: Unpredictable, short-lived, and without social, economic, and political significance. Fads are measured in months, rather than years. Wham-0 sold 25 million Hula Hoops in its first 4 months. Pet rocks were launched in the mid-1970’s and sold 1 million units in a matter of months. Five month’s later sales were almost non-existent. TRENDS: Offer a view of the future due to their momentum and durability. The fitness/diet trend is an example, although there have been many fads within this trend, the overall movement toward healthier living has remained. MEGATRENDS: Changes that are slow to form but once established last for 7 – 10 years (or more). Megatrends influence all factors of life that impact business, culture, economics, society, and personal lives.
  • #16 Worldwide population growth 6.8 billion in 2010; will grow to 9 billion in 2040 Population age mix Mexico young population; Italy old By 2011 in the US, those 65 and older will grow faster than the entire US population. Ethnic and other markets 25 million people in the US were born in another country Hispanic’s accounted for 11 percent of the US population in the 2000 census. By 2020 Hispanics are expected to account for 18.9 percent of the population. Educational Groups Household patterns - 20% of households “Married with Children”; 27% single live-alones; Single-parent families (8%); living with nonrelatives only (5%); and other family structures (8%)
  • #18 Purchasing power: is the amount of goods/services one unit of currency will purchase. Purchasing power is determined by income, prices, savings, credit availability, and debt. The financial crisis in 2008-09 may have permanently changed consumer buying habits. The income distribution of a country can influence the decision to enter a specific market.
  • #19 Sociocultural: The influence that both society and culture have on the views of individuals. A subculture is a group that shares a distinct culture different from the larger culture that they belong. Examples of subcultures include: Gothic, Metalhead, punk, Trekkies, biker, etc.
  • #20 Companies must be cognizant of the effects of their business on the environment and how regulations can influence its competitive position. Changes in regulations can also provide opportunities for companies, but these opportunities may only be recognized if the company includes this aspect into their strategic planning.
  • #22 Opportunities can arise due to changes in the political-legal environment. But so too can threats.
  • #23 Understanding a market potential involves more than just research and analysis. Companies must also determine market size, growth, and profit potential.
  • #24 Markets can be broken down in a number of ways.
  • #25 Companies can prepare as many as 90 different types of demand estimates, for six different product levels, five space levels, and three time periods. Each of these serves a different purpose. Short-run can for ordering raw materials, plan production, or borrow cash.
  • #26 Market demand is the total volume that would be bought by a defined customer group, in a defined geographical area, in a defined time period, in a defined marketing environment, under a defined marketing program. Company demand ( expected market share) is the company’s estimated share of market demand at alternative levels of company marketing efforts in a given time period.
  • #27 Market demand is not fixed as it can change based on a number of variables. If firms in an industry increase marketing expenditures, reduce (or raise) prices, then demand can increase (or fall). The financial environment (shown in figure b) also influences overall market demand.
  • #28 Total market potential is the maximum sales available to all firms in an industry during a given period, under a given level of industry marketing effort, and environmental conditions. Area market potential is the sales potential for a specific territory. Market-buildup Method looks to identify all potential buyers in a market and estimating their potential purchases. Market-factor Index Method – seeks to determine market potential based on proxy information. For example, if Virginia represents 2.55% of the US population, then the state may produce 2.55% of all US sales. Industry Sales Market Sales
  • #29 Market-test